Advertisement

Main menu

  • Home
  • Content
    • Current Issue
    • Accepted Manuscripts
    • Article Preview
    • Past Issue Archive
    • Video Articles
    • AJNR Case Collection
    • Case of the Week Archive
    • Case of the Month Archive
    • Classic Case Archive
  • Special Collections
    • AJNR Awards
    • ASNR Foundation Special Collection
    • Most Impactful AJNR Articles
    • Photon-Counting CT
    • Spinal CSF Leak Articles (Jan 2020-June 2024)
  • Multimedia
    • AJNR Podcasts
    • AJNR SCANtastic
    • Trainee Corner
    • MRI Safety Corner
    • Imaging Protocols
  • For Authors
    • Submit a Manuscript
    • Submit a Video Article
    • Submit an eLetter to the Editor/Response
    • Manuscript Submission Guidelines
    • Statistical Tips
    • Fast Publishing of Accepted Manuscripts
    • Graphical Abstract Preparation
    • Imaging Protocol Submission
    • Author Policies
  • About Us
    • About AJNR
    • Editorial Board
    • Editorial Board Alumni
  • More
    • Become a Reviewer/Academy of Reviewers
    • Subscribers
    • Permissions
    • Alerts
    • Feedback
    • Advertisers
    • ASNR Home

User menu

  • Alerts
  • Log in

Search

  • Advanced search
American Journal of Neuroradiology

American Journal of Neuroradiology

ASHNR American Society of Functional Neuroradiology ASHNR American Society of Pediatric Neuroradiology ASSR
  • Alerts
  • Log in

Advanced Search

  • Home
  • Content
    • Current Issue
    • Accepted Manuscripts
    • Article Preview
    • Past Issue Archive
    • Video Articles
    • AJNR Case Collection
    • Case of the Week Archive
    • Case of the Month Archive
    • Classic Case Archive
  • Special Collections
    • AJNR Awards
    • ASNR Foundation Special Collection
    • Most Impactful AJNR Articles
    • Photon-Counting CT
    • Spinal CSF Leak Articles (Jan 2020-June 2024)
  • Multimedia
    • AJNR Podcasts
    • AJNR SCANtastic
    • Trainee Corner
    • MRI Safety Corner
    • Imaging Protocols
  • For Authors
    • Submit a Manuscript
    • Submit a Video Article
    • Submit an eLetter to the Editor/Response
    • Manuscript Submission Guidelines
    • Statistical Tips
    • Fast Publishing of Accepted Manuscripts
    • Graphical Abstract Preparation
    • Imaging Protocol Submission
    • Author Policies
  • About Us
    • About AJNR
    • Editorial Board
    • Editorial Board Alumni
  • More
    • Become a Reviewer/Academy of Reviewers
    • Subscribers
    • Permissions
    • Alerts
    • Feedback
    • Advertisers
    • ASNR Home
  • Follow AJNR on Twitter
  • Visit AJNR on Facebook
  • Follow AJNR on Instagram
  • Join AJNR on LinkedIn
  • RSS Feeds

AJNR is seeking candidates for the AJNR Podcast Editor. Read the position description.

Research ArticlePEDIATRICS

Temporal Lobe, Autism, and Macrocephaly

Erin D. Bigler, David F. Tate, E. Shannon Neeley, Lara J. Wolfson, Michael J. Miller, Sara A. Rice, Howard Cleavinger, Carol Anderson, Hilary Coon, Sally Ozonoff, Michael Johnson, Elena Dinh, Jeff Lu, William Mc Mahon and Janet E. Lainhart
American Journal of Neuroradiology November 2003, 24 (10) 2066-2076;
Erin D. Bigler
  • Find this author on Google Scholar
  • Find this author on PubMed
  • Search for this author on this site
David F. Tate
  • Find this author on Google Scholar
  • Find this author on PubMed
  • Search for this author on this site
E. Shannon Neeley
  • Find this author on Google Scholar
  • Find this author on PubMed
  • Search for this author on this site
Lara J. Wolfson
  • Find this author on Google Scholar
  • Find this author on PubMed
  • Search for this author on this site
Michael J. Miller
  • Find this author on Google Scholar
  • Find this author on PubMed
  • Search for this author on this site
Sara A. Rice
  • Find this author on Google Scholar
  • Find this author on PubMed
  • Search for this author on this site
Howard Cleavinger
  • Find this author on Google Scholar
  • Find this author on PubMed
  • Search for this author on this site
Carol Anderson
  • Find this author on Google Scholar
  • Find this author on PubMed
  • Search for this author on this site
Hilary Coon
  • Find this author on Google Scholar
  • Find this author on PubMed
  • Search for this author on this site
Sally Ozonoff
  • Find this author on Google Scholar
  • Find this author on PubMed
  • Search for this author on this site
Michael Johnson
  • Find this author on Google Scholar
  • Find this author on PubMed
  • Search for this author on this site
Elena Dinh
  • Find this author on Google Scholar
  • Find this author on PubMed
  • Search for this author on this site
Jeff Lu
  • Find this author on Google Scholar
  • Find this author on PubMed
  • Search for this author on this site
William Mc Mahon
  • Find this author on Google Scholar
  • Find this author on PubMed
  • Search for this author on this site
Janet E. Lainhart
  • Find this author on Google Scholar
  • Find this author on PubMed
  • Search for this author on this site
  • Article
  • Figures & Data
  • Info & Metrics
  • Responses
  • References
  • PDF
Loading

Article Figures & Data

Figures

  • Tables
  • Fig 1.
    • Download figure
    • Open in new tab
    • Download powerpoint
    Fig 1.

    A, T1-weighted coronal image shows the five temporal gyri: superior temporal gyrus (A), middle temporal gyrus (B), inferior temporal gyrus (C), fusiform gyrus (D), parahippocampal gyrus (E), and hippocampus (F). The red triangle (G) defines the region of classification for determining the volume of the temporal stem, which represents the trunk of the white matter projections of the temporal lobe in the coronal plane.

    B, Coregistered T2-weighted image.

    C, Edited segmented image from the T1- and T2-weighted images depicts gray matter in gray, white matter in white, and CSF in blue. The Volume Render Module and region-of-interest feature in ANALYZE (54, 55) were used to identify gyral boundaries, defined by each sulcus.

    D, Three-dimensional reconstruction of this subject’s brain depicts a lateral view showing the region where gyral quantification occurred (green) and the temporal pole (yellow). Anterior to the coronal sections in A and B, where the temporal horn is no longer definable, was the landmark to begin measuring the temporal pole. The red triangle (G) in A defines the region of classification for determining the volume of the temporal stem. The mesial vertical boundary was defined by connecting the inner extension of the sylvian fissure to the most lateral aspect of the temporal horn, triangulated with the gray matter extension at the innermost point of the superior temporal sulcus. CSF boundaries were defined by CSF segmented pixels in the region bounded by the inferior frontal lobe and the superior temporal gyrus for the sylvian fissure; between the superior and inferior temporal gyri for the middle temporal sulcus; between the inferior and fusiform for the inferior temporal sulcus; and the rhinal sulcus between the fusiform and parahippocampal gyrus.
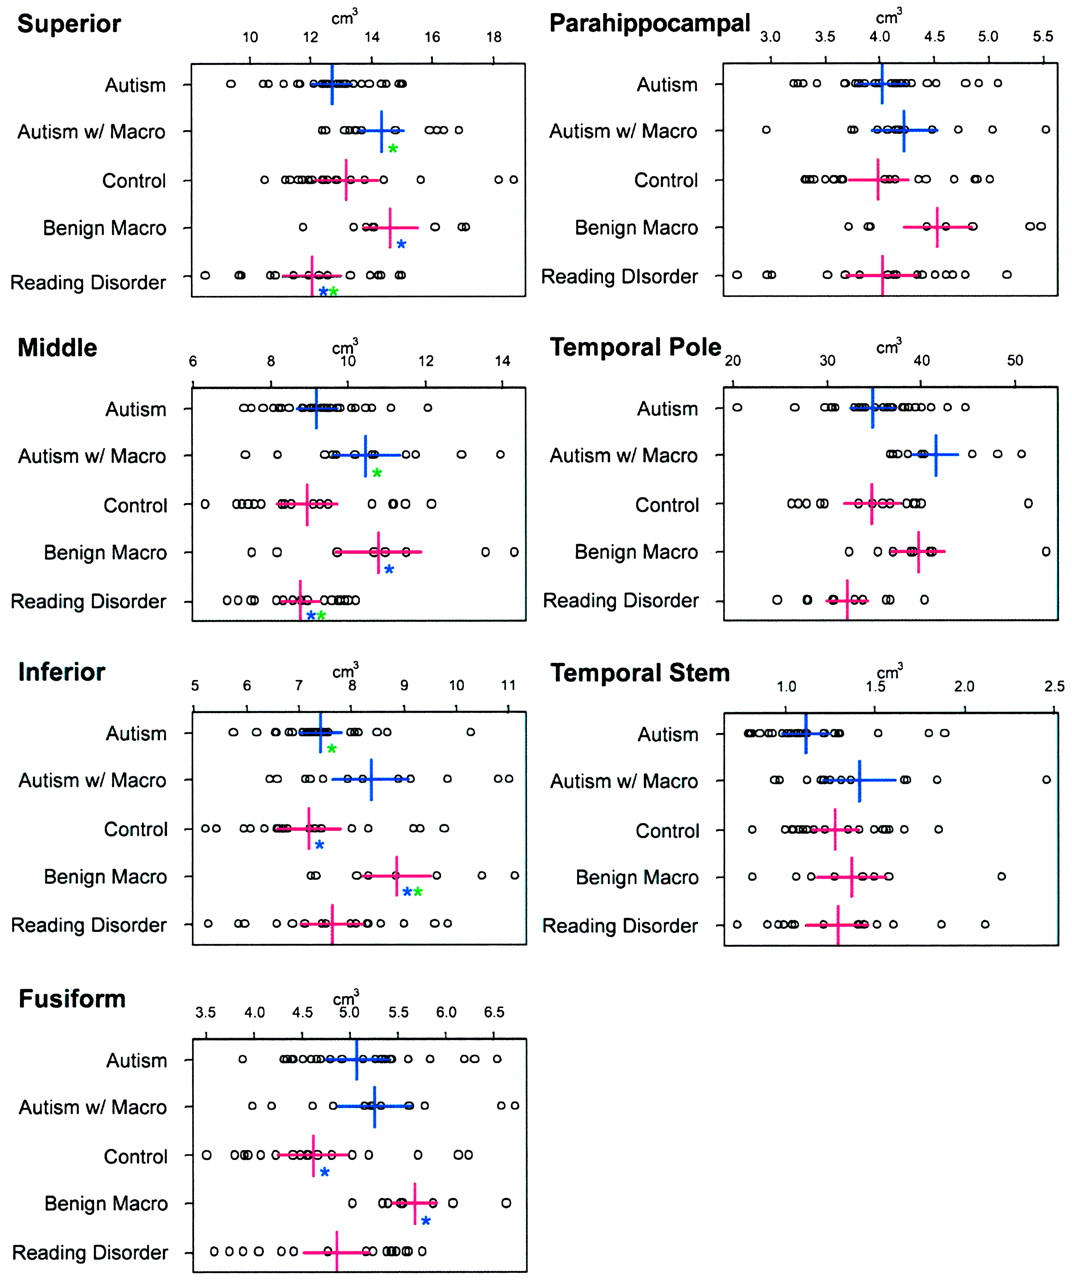
  • Fig 2.
    • Download figure
    • Open in new tab
    • Download powerpoint
    Fig 2.

    Parenchymal gyral volumes of the temporal lobe, volume of the temporal lobe tip, and white matter stem. Each box contains the actual data point representing the uncorrected volume for each structure. The five groups are represented on the y axis. The x axis is in cm3. Colored asterisks indicate where significance (P < .05) is present and between which groups the significance resides (ie, same color). For example, in the superior temporal gyrus panel in the upper left, the two blue asterisks indicate that subjects with reading disorder had smaller volume than that of the control subjects with benign macrocephaly (Macro). Note that there are basically no significant differences between autistic and control subjects with normal head size or between autistic and control subjects with large head size. The only comparisons that were significant were between one of the macrocephalic groups and the normocephalic groups.

  • Fig 3.
    • Download figure
    • Open in new tab
    • Download powerpoint
    Fig 3.

    Volumetric comparisons of subcortical regions of the temporal lobe including the amygdala, total hippocampal volume, area dentata (AD), and the CA1-CA3 region plus subiculum (CAS) of the hippocampus. Legend is otherwise the same as that in Figure 2. Note that AD and CAS values are in mm2 as they represent the surface area at that level.

  • Fig 4.
    • Download figure
    • Open in new tab
    • Download powerpoint
    Fig 4.

    Growth plots by age for total temporal lobe white matter and gray matter, fusiform gyrus white and gray matter, and parahippocampal gyrus white and gray matter. Controls include typically developing subjects with or without macrocephaly, and subjects with reading disorder. The nature of the relationship of structure, development, and age was tested by either a linear or quadratic fit. As can be seen for all white matter structures, the better fit was linear. For gray matter structures, the fit was quadratic. The dash-line represents the extension of the quadratic for the autistic subjects older than 23 years. Since there were no controls to compare beyond that age, the actual regression line stops with the solid line and the projected regression is represented by the dash. None of these growth plots were significantly different, indicating generally similar growth patterns between autistic and control subjects, even though the curves showed some differences. Large blue ‘bulls eye’ points denote macrocephalic (both selected and unselected) autistic subjects, and the large red diamonds indicate macrocephalic control subjects. Age is shown on the x axis and volume (cm3) on the y axis.

  • Fig 5.
    • Download figure
    • Open in new tab
    • Download powerpoint
    Fig 5.

    Growth plots by structure and age, for amygdala, temporal lobe, white matter stem, hippocampus, area dentata, and the CAS region of the hippocampus. As with Figure 4, the fit was tested for quadratic and linear, and, in the case of these structures, several showed no superiority of one fit over the other, therefore both are presented. Legend is otherwise the same as that in Figure 4. Of interest was that as a group, the autistic subjects had smaller white matter stem volumes than those of the control subjects earlier in life (younger than 17 years), although the slopes of the regression lines were not different. Note that area dentata and CAS values are in mm2 as they represent the surface area at that level.

Tables

  • Figures
    • View popup
    TABLE 1:

    Age, PIQ, head circumference, and height data for autistic and control subjects

    CharacteristicAutistic SubjectsControl SubjectsF Values
    NormocephalicMacrocephalicNormocephalicMacrocephalicReading Disorder
    No. of subjects*261219817
    Age (y)
     Mean (SD)14.15 (6.05)12.75 (4.43)12.53 (4.48)12.50 (3.46)12.65 (3.10).48, P = .75
     Range8–317–197–228–167–18
    No. of subjects older than 19 y40200
    PIQ
     Mean (SD)97.50 (19.29)108.58 (18.22)101.25 (15.55)117.88 (11.69)100.18 (10.88)2.82, P = .03
     Range62–14169–12574–126103–13682–129
    zHC
     Mean (SD)0.45 (0.98)2.78 (0.77)0.20 (1.18)3.02 (1.01)−0.02 (1.36)21.86, P < .001
     Range−1.81–1.461.93–4.12−1.75–1.812.14–5.20−2.30–2.04
    zHgt
     Mean (SD)−0.23 (1.12)0.72 (1.26)0.56 (1.05)0.83 (.67)0.50 (.98)2.97, P = .02
     Range−2.51–1.98−1.38–3.17−0.69–2.860.24–1.98−1.20–2.86
    Grade level mean67596
    • Note.—zHC indicates z score for head circumference; zHgt, z score for height. The z score is the number of SDs a value is away from the reference data mean for age and sex. In reference data mean, zHC + zHgt = 0.

    • * All subjects are male.

    • View popup
    TABLE 2:

    Clinical MR imaging findings

    FindingAutistic SubjectsControl Subjects
    Normocephaly (n = 26)Macrocephaly (n = 12)Normocephaly (n = 19)Benign Macrocephaly (n = 8)Reading Disorder (n = 17)
    Signal hyperintensity4(15.4)1(8.3)2(10.5)2*(25.0)1(5.9)
    Mild atrophy2(7.7)--------
    Prominent perivascular spaces2(7.7)1(8.3)1(5.3)2*(25.0)--
    Temporal horn prominence1(3.8)1(8.3)----1(5.9)
    Hypothalamic signal abnormality1(3.8)------
    Ventricular asymmetry--------1(5.9)
    Arachnoid cyst----1(5.3)--3(17.6)
    Left choroidal fissure cyst1(3.8)------1(5.9)
    Possible pineal cyst1(3.8)--------
    • Note.—Data are the number of subjects. Numbers in parentheses are percentages.

    • * One subject with benign macrocephaly had both a signal abnormality and prominent perivascular space noted. No other dual clinical abnormalities were identified in other subjects.

    • View popup
    TABLE 3:

    Temporal lobe CSF volumes by sulcus and horn of the lateral ventricle

    RegionVolumes (cm3) by Diagnostic Group
    Autism (n = 26)Autism with Macrocephaly (n = 12)Normal (n = 19)Benign (n = 8)Reading Disorder (n = 17)
    Sylvian0.89 (0.60)1.02 (0.50)0.71 (0.45)0.95 (0.39)0.69 (0.36)
    Superior0.22 (0.17)0.26 (0.14)0.18 (0.13)0.18 (0.08)0.15 (0.09)
    Middle0.09 (0.07)0.08 (0.04)0.06 (0.05)0.10 (0.06)0.09 (0.08)
    Inferior0.04 (0.02)0.04 (0.03)0.04 (0.02)0.05 (0.04)0.04 (0.04)
    Rhinal0.06 (0.03)0.06 (0.03)0.06 (0.05)0.08 (0.05)0.05 (0.04)
    Horn0.37 (0.15)0.51 (0.14)0.48 (0.19)0.51 (0.23)0.52 (0.22)
    • Note. Data are the mean. Numbers in parentheses are SD.

    • View popup
    TABLE 4:

    Temporal lobe gray and white matter ratios

    GroupGray MatterWhite Matter
    TICV Ratio*TBV Ratio†TICV Ratio*TBV Ratio†
    Autism (n = 26)13.98 (7.96)15.22 (8.61)7.66 (4.40)8.35 (4.81)
    Autism with macrocephaly (n = 12)15.70 (7.54)16.84 (8.07)9.19 (4.51)9.86 (4.88)
    Control (n = 19)17.36 (4.43)18.67 (4.67)9.92 (2.65)10.68 (2.86)
    Benign macrocephaly (n = 8)13.46 (8.56)14.77 (9.38)8.42 (5.78)9.23 (6.30)
    Reading disorder (n = 17)15.13 (7.29)16.24 (7.83)9.05 (4.42)9.70 (4.73)
    F statistic0.760.670.860.75
    P value.56.62.49.56
    • Note.—Data are the mean. Numbers in parentheses are SD.

    • * TICV Ratio = (Temporal Gray or White Matter/Total Intracranial Volume) × 100

    • † TBV Ratio = (Temporal Gray or White Matter/Total Brain Volume) × 100

PreviousNext
Back to top

In this issue

American Journal of Neuroradiology: 24 (10)
American Journal of Neuroradiology
Vol. 24, Issue 10
1 Nov 2003
  • Table of Contents
  • Index by author
Advertisement
Print
Download PDF
Email Article

Thank you for your interest in spreading the word on American Journal of Neuroradiology.

NOTE: We only request your email address so that the person you are recommending the page to knows that you wanted them to see it, and that it is not junk mail. We do not capture any email address.

Enter multiple addresses on separate lines or separate them with commas.
Temporal Lobe, Autism, and Macrocephaly
(Your Name) has sent you a message from American Journal of Neuroradiology
(Your Name) thought you would like to see the American Journal of Neuroradiology web site.
CAPTCHA
This question is for testing whether or not you are a human visitor and to prevent automated spam submissions.
Cite this article
Erin D. Bigler, David F. Tate, E. Shannon Neeley, Lara J. Wolfson, Michael J. Miller, Sara A. Rice, Howard Cleavinger, Carol Anderson, Hilary Coon, Sally Ozonoff, Michael Johnson, Elena Dinh, Jeff Lu, William Mc Mahon, Janet E. Lainhart
Temporal Lobe, Autism, and Macrocephaly
American Journal of Neuroradiology Nov 2003, 24 (10) 2066-2076;

Citation Manager Formats

  • BibTeX
  • Bookends
  • EasyBib
  • EndNote (tagged)
  • EndNote 8 (xml)
  • Medlars
  • Mendeley
  • Papers
  • RefWorks Tagged
  • Ref Manager
  • RIS
  • Zotero
0 Responses
Respond to this article
Share
Bookmark this article
Temporal Lobe, Autism, and Macrocephaly
Erin D. Bigler, David F. Tate, E. Shannon Neeley, Lara J. Wolfson, Michael J. Miller, Sara A. Rice, Howard Cleavinger, Carol Anderson, Hilary Coon, Sally Ozonoff, Michael Johnson, Elena Dinh, Jeff Lu, William Mc Mahon, Janet E. Lainhart
American Journal of Neuroradiology Nov 2003, 24 (10) 2066-2076;
del.icio.us logo Twitter logo Facebook logo Mendeley logo
  • Tweet Widget
  • Facebook Like
  • Google Plus One

Jump to section

  • Article
    • Abstract
    • Methods
    • Results
    • Discussion
    • Conclusion
    • Acknowledgments
    • Footnotes
    • References
  • Figures & Data
  • Info & Metrics
  • Responses
  • References
  • PDF

Related Articles

  • No related articles found.
  • PubMed
  • Google Scholar

Cited By...

  • Morphological study of embryonic Chd8+/- mouse brains using light-sheet microscopy
  • Crossref
  • Google Scholar

This article has not yet been cited by articles in journals that are participating in Crossref Cited-by Linking.

More in this TOC Section

  • SyMRI & MR Fingerprinting in Brainstem Myelination
  • Comparison of Image Quality and Radiation Dose in Pediatric Temporal Bone CT Using Photon-Counting Detector CT and Energy-Integrating Detector CT
  • Neonatal Hypocalcemia: Cerebral MRI Abnormalities
Show more Pediatrics

Similar Articles

Advertisement

Indexed Content

  • Current Issue
  • Accepted Manuscripts
  • Article Preview
  • Past Issues
  • Editorials
  • Editor's Choice
  • Fellows' Journal Club
  • Letters to the Editor
  • Video Articles

Cases

  • Case Collection
  • Archive - Case of the Week
  • Archive - Case of the Month
  • Archive - Classic Case

Special Collections

  • AJNR Awards
  • ASNR Foundation Special Collection
  • Most Impactful AJNR Articles
  • Photon-Counting CT
  • Spinal CSF Leak Articles (Jan 2020-June 2024)

More from AJNR

  • Trainee Corner
  • Imaging Protocols
  • MRI Safety Corner

Multimedia

  • AJNR Podcasts
  • AJNR Scantastics

Resources

  • Turnaround Time
  • Submit a Manuscript
  • Submit a Video Article
  • Submit an eLetter to the Editor/Response
  • Manuscript Submission Guidelines
  • Statistical Tips
  • Fast Publishing of Accepted Manuscripts
  • Graphical Abstract Preparation
  • Imaging Protocol Submission
  • Evidence-Based Medicine Level Guide
  • Publishing Checklists
  • Author Policies
  • Become a Reviewer/Academy of Reviewers
  • News and Updates

About Us

  • About AJNR
  • Editorial Board
  • Editorial Board Alumni
  • Alerts
  • Permissions
  • Not an AJNR Subscriber? Join Now
  • Advertise with Us
  • Librarian Resources
  • Feedback
  • Terms and Conditions
  • AJNR Editorial Board Alumni

American Society of Neuroradiology

  • Not an ASNR Member? Join Now

© 2025 by the American Society of Neuroradiology All rights, including for text and data mining, AI training, and similar technologies, are reserved.
Print ISSN: 0195-6108 Online ISSN: 1936-959X

Powered by HighWire