
Abstract
Summary: Flow dynamics in intracranial aneurysms and their adjacent parent vessels play important roles in the development and rupture of intracranial aneurysms. Combined with tagged MR imaging and the use of particle image velocimetry software, tagged MR image velocimetry reveals flow vectors, vorticity, and shear strains at each location in the aneurysm replica every 9 milliseconds. This technique is a promising and noninvasive technique for assessing hemodynamics in intracranial aneurysms.
The annual rupture rate of intracranial aneurysms smaller than 10 mm and without a history of subarachnoid hemorrhage is reported to be 0.05% on the basis of data collected from 53 participating centers in the United States, Canada, and Europe. (1). This is less than previously published rates of 0.1%–2% (2). If a subarachnoid hemorrhage occurs secondary to the rupture of an intracranial aneurysm, two-thirds of patients will die or have severe neurologic deficits. Therefore, the ability to estimate the possibility of future aneurysmal rupture is beneficial for patients and for their physicians, who must decide whether the patients should undergo treatment. However, we do not know the natural history of intracranial aneurysms, and therefore, we cannot estimate their potential for rupture.
Flow dynamics in intracranial aneurysms and their adjacent parent vessels are believed to play an important role in the development and rupture of intracranial aneurysms (3). If we can accurately determine the hemodynamics in intracranial aneurysms, we may be able to estimate their potential for rupture.
This study had two purposes: One was to investigate the possibility of visualizing the hemodynamics in a replica of intracranial aneurysms by using tagged MR imaging (4). The other was to apply particle image velocimetry (PIV) software (5, 6) to tagged MR images and to investigate whether this new technique, named tagged MR image velocimetry, could be used to calculate the flow velocity, vorticity, and shear strain in the replica.
Methods
Vascular Phantom and MR Unit
We used a silicon replica of an anterior communicating artery aneurysm. This replica had a height of 15 mm, a fundus diameter of 10 mm, and a neck diameter of 5 mm (normal aortic arch, anterior circulation with anterior communicating artery aneurysm; Shelley Medical Imaging Technologies; London, Ontario, Canada). The replica also had a pulsatile flow pump system (Shelley Medical Imaging Technologies). A mixture of glycerol and distilled water (ratio, 2:3) was used as flowing fluid. Its properties, such as density and viscosity, mimicked those of human blood (7). MR imaging was performed by using a 1.5-T MR unit (Signa Horizon; GE Medical Systems, Milwaukee, WI) and a commercially available head coil.
Experimental Procedure
Setup for the Phantom System.—
We placed the vascular model into the gantry of the MR machine and connected it with the pulsatile pump system by means of a silicon tube.
Flow Measurements.—
We changed the flow volume of the pulsatile pump by using its control unit and measured the flow velocity several times by using the MR machine. Flow measurements were made by means of ECG-gated 2D phase-mapping MR imaging with the following parameters: TR/TE/NEX, 19/7.8/1; flip angle (FA), 30°; FOV, 18 × 18 cm; matrix, 256 × 256; section thickness, 5 mm; bandwidth, 15.6 kHz; and imaging time, 3 minutes 32 seconds. We adjusted the peak systolic velocity in the center of the C5 segment of the internal carotid artery to 50 cm/s. This velocity was thought to be within normal limits (8, 9).
Three-Dimensional Time-of-Flight MR Angiography.—
We performed 3D time-of-flight (TOF) MR angiography to determine the shape of the aneurysm. Imaging parameters were as follows: 40/6.9/1; FA, 30°; FOV, 16 × 16 cm; matrix, 256 × 192; section thickness, 1 mm; number of partitions aided with zero-filled interpolation (ZIP), 88; partition gap aided with ZIP, 0.5 mm; bandwidth, 15.6 kHz; imaging orientation, transaxial; and imaging time, 10 minutes 32 seconds. MR angiograms (Fig 1) were processed with a maximum intensity projection (MIP) algorithm.
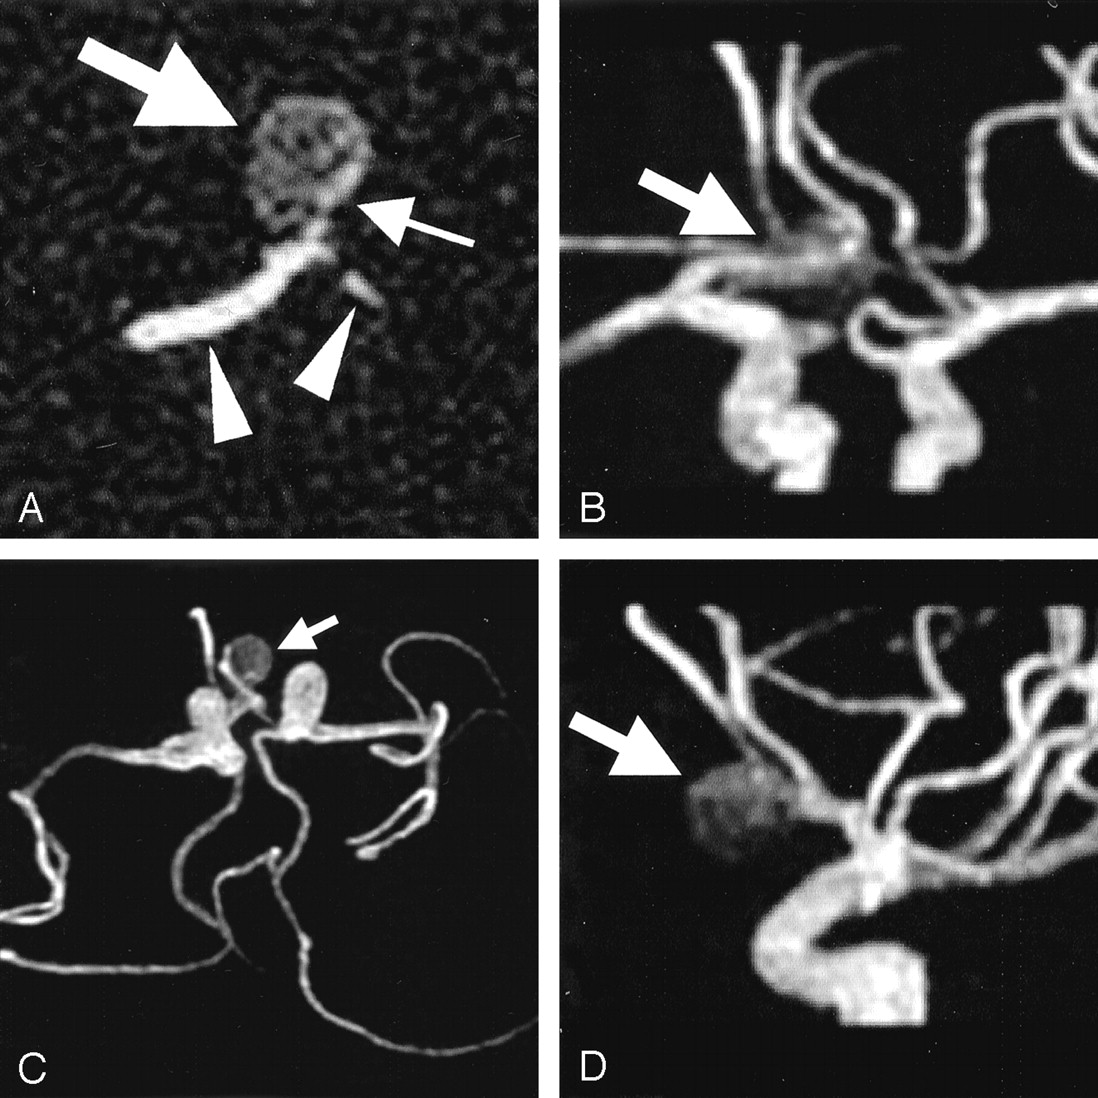
Images of the replica of an anterior communicating artery aneurysm.
A, On an original axial image, transverse through the center of the aneurysm, an aneurysmal sac (left arrow) shows relatively low signal intensity compared with the A1 segments (arrowheads) of the anterior cerebral artery. This signal intensity is due to the relatively slow flow in the intracranial aneurysm. Stronger signal intensity (right arrow) at the left aspect of the replica is observed; this is due to stronger flow from the right A1 segment into the left aspect of the aneurysm.
B–D, Anteroposterior (B), inferosuperior (C), and left-to-right (D) projections of MIP MR angiograms show the anterior communicating artery aneurysm (arrow).
Tagged MR Imaging.—
We performed tagged MR imaging to assess the intra-aneurysmal hemodynamics. The imaging sequence was an ECG-gated fast spoiled gradient-echo sequence combined with spatial modulation of a magnetization technique (4). The following parameters were used: 9 .1/2.1/8; FA, 20°; FOV, 16 × 16 cm; matrix, 256 × 128; section thickness, 5 mm; bandwidth, 15.6 kHz; and imaging time, 14 minutes 3 seconds. Axial imaging planes were selected to include the anterior communicating artery and the center of the aneurysm. Tag stripes were placed at 3-mm intervals in a grid pattern.
Trigger timing was adjusted to the diastolic and systolic phases by changing the trigger pulse of the control unit so that tagged MR imaging was performed during both the diastolic phase and the systolic phase, respectively. Tagged MR images were obtained every 9 milliseconds.
Data Processing with PIV software.—
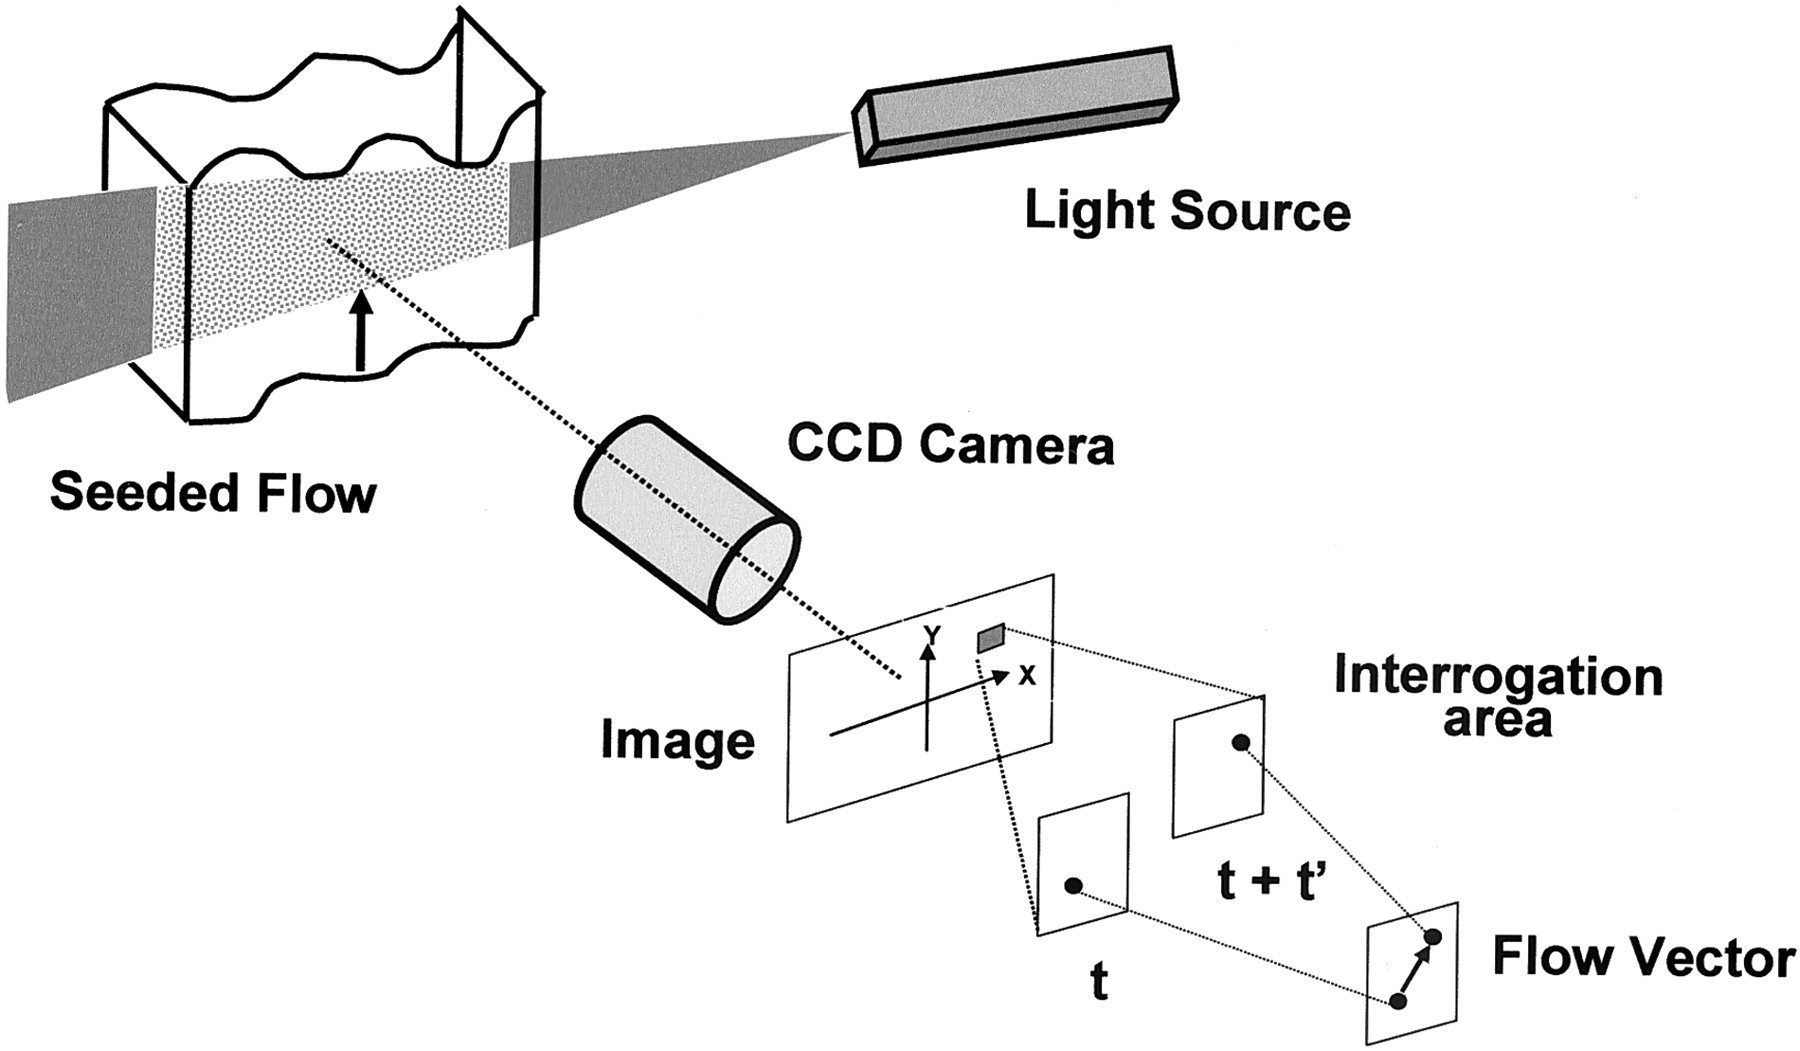
The PIV technique is one method for visualizing flow dynamics. The technique uses two sequential digital images of the particles. PIV software calculates the flow vector on the basis of the positional changes of the particles in the flowing fluid (Fig 2). PIV software can also address sequential movements of groups of particles and the light and shading caused by particles. We thought that the PIV software would treat the gridlike pattern of tag lines on tagged MR images as particles or groups of particles. We also thought that we could apply the PIV software to calculate flow vectors on tagged MR images of the aneurysm replica.

Schematic diagram of the PIV system. The PIV technique is used to calculate the flow vector on the basis of the positional changes of the particles in the flowing fluid; for this, two sequential digital images are used.
We used PIV software (VidPIV4.0; Oxford Lasers, Ltd., Dideot, Oxon, U.K.) to analyze the tagged MR images and to calculate flow vectors, vorticity, and shear strains in the aneurysm replica. Tag lines disappeared within 100–200 milliseconds because of T1 relaxation of the fluid and because of the mixture of tag lines due to vortex flow in the replica. Therefore, in this study, we dealt with the first six tagged MR images, with 9-millisecond intervals between each image. The PIV software calculated one image from two consecutive images, resulting in five images within 5 minutes.
Data Analysis
We estimated the hemodynamics by observing the motion of the tag lines in the aneurysm replica. We investigated the differences in flow vectors, vorticity, and shear strains in the diastolic and systolic phases.
Results
Tagged MR images, flow vectors, vorticity, and shear strains in the intracranial aneurysm replica during the diastolic and systolic phases are shown in Figures 3 and 4.
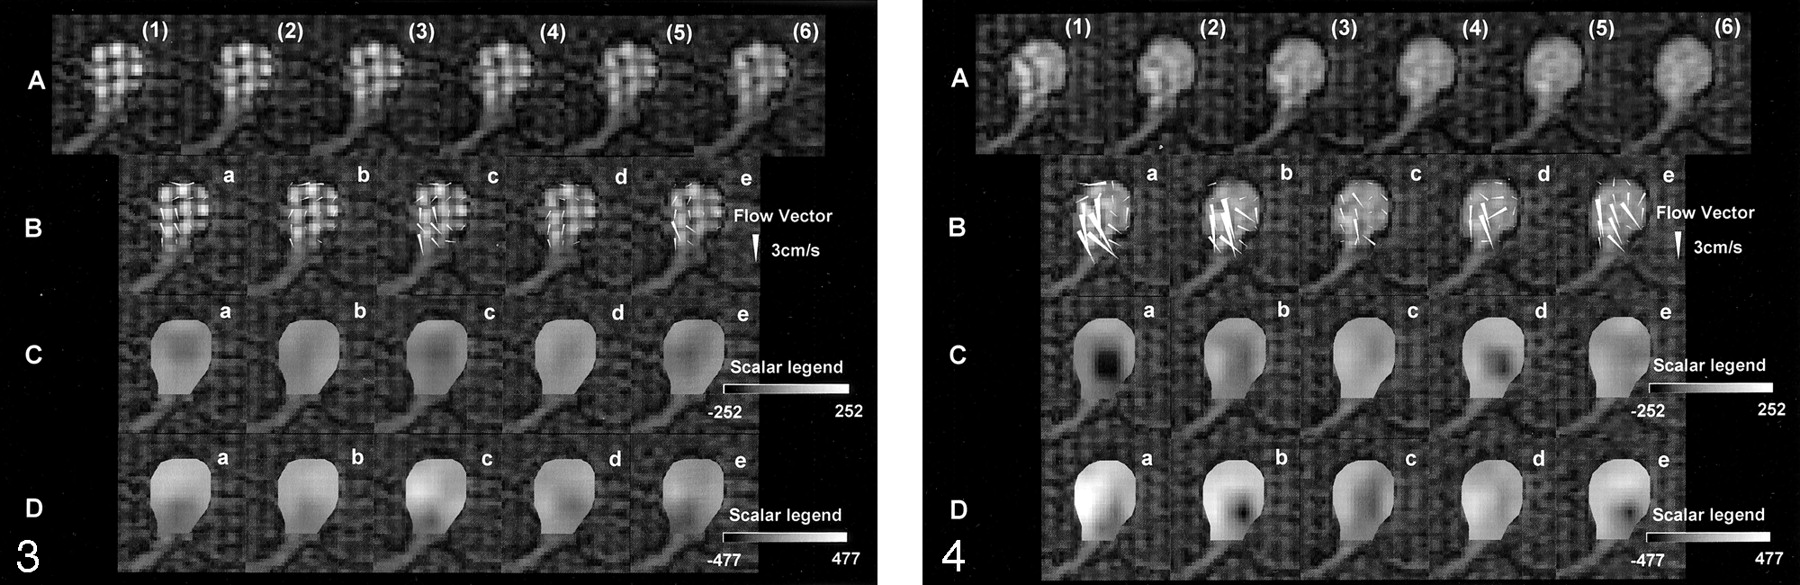
Tagged MR images and data processed with PIV software during the diastolic phase. Row A, Six tagged MR images, (1)–(6), were obtained with an interval of 9 milliseconds during the diastolic phase. In the aneurysm replica, counterclockwise rotation of the tag lines is observed. The quantitative velocity is not known; however, we can estimate the hemodynamics in the aneurysm. The tag lines gradually disappear due to the longitudinal relaxation of the spin in the flowing fluid and due to the mixture of the spin. Rows B–D, Flow-vector (row B), vorticity (row C), and shear-strain (row D) images were processed with the PIV software by using the data of tagged MR images. Each image—a, b, c, d, and e—was obtained from the following datasets, respectively: (1) and (2), (2) and (3), (3) and (4), (4) and (5), and (5) and (6). The aneurysm is displayed in the same orientation as in Figure 1A. The flow-vector images reveal the flow vector (arrowheads) of the flowing fluid at each location in the replica every 9 ms. We could measure the quantitative velocity and the direction of flowing fluid. The maximum flow was 2.2 cm/s. Vorticity and shear-strain images are shown in gray scale. In the scalar legends depicted, gray at the midpoint means no vorticity or shear strain. During the diastolic phase, the absolute value of vorticity and shear strain seem to be low, according to the color shown on the images.

Tagged MR images and data processed with PIV software during the systolic phase. Row A, Six tagged MR images, (1)–(6), were obtained with an interval of 9 milliseconds during the systolic phase. In the aneurysm replica, counterclockwise rotation of the tag lines is observed. The quantitative velocity is not known; however, we can estimate the hemodynamics in the aneurysm. Tag lines move more quickly in systolic phase than in the diastolic phase (Fig 3A). They also disappear sooner. Rows B–D, Flow vector images (B), vorticity images (C) and shear strain images (D) processed with PIV software from the data of tagged MR images (A) are shown. Each image—a, b, c, d, and e—was obtained from the following datasets, respectively: (1) and (2), (2) and (3), (3) and (4), (4) and (5), and (5) and (6). The aneurysm is displayed in the same orientation as in Figure 1A. Flow-vector images reveal the flow vector (arrowheads) of the flowing fluid at each location in the replica every 9 milliseconds. These velocities obtained in systolic phase (row B) are faster than those in the diastolic phase (Fig 3B). The maximum velocity is 4.5 cm/s, which is slower than expected. This velocity is due to the short neck of the aneurysm. Fewer flow vectors were noted in the left aspect of the aneurysm, where stronger inflow was estimated to be present; the tag lines were not clearly shown because of faster flow. Vorticity and shear-strain images are shown in gray scale. In the scalar legends depicted, gray at the midpoint means no vorticity or shear strain. Some vorticity images show black areas in the center of the aneurysm; these indicate counterclockwise vorticity. Vorticity is stronger during the systolic phase (row C) than during the diastolic phase (Fig 3C). The inflow portion of the left aspect of the replica shows a darker area, which indicates stronger shear strain (row D). On the other hand, the contralateral side of the replica demonstrated a lighter area, which indicates stronger shear strain. On the shear-strain images, differences in color reflect the differences in the direction of shear deformation. The difference in direction is not important because it is not related to the absolute value of the shear strain. Shear strains are stronger during the systolic phase (row D) than during diastolic phase (Fig 3D). Shear strain multiplied by viscosity equals shear stress. Therefore, the aneurysmal wall near the site with strong shear strain is estimated to have strong shear stress.
Tagged MR images showed counterclockwise vortex flow that was qualitatively faster in the systolic phase (Fig 4, row A) than in the diastolic phase (Fig 3, row A). Tag lines in the systolic phase also disappeared sooner as a result of more rapid flow in the aneurysm replica.
Flow vector images showed counterclockwise vortex flow that was quantitatively faster in the systolic phase (Fig 4, row B) than in the diastolic phase (Fig 3, row B). Fewer flow vectors were noted in the left aspect of the aneurysm, where the stronger inflow was estimated to be present; tag lines were not clearly shown because of faster flow.
Vorticity images (Fig 4, row C) and shear-strain images (Fig 4, row D) in the systolic phase demonstrated more contrast than did the images (Fig 3, rows C and D) in the diastolic phase. Counterclockwise vortex flow at the center of the aneurysm was apparent in the systolic phase (Fig 4C), as compared with the diastolic phase (Fig 3, row C). In the inflow portion of the left aspect of the aneurysm replica and on the contralateral side, vorticity was stronger in the systolic phase (Fig 4, row D) than in the diastolic phase (Fig 3, row D).
Discussion
The pattern of hemodynamics mainly consists of movement, rotation, and deformation. Movement is described by using the flow vector, which has components of flow velocity and direction. Vorticity reflects the degree of rotation. Deformation includes extensional deformation and shear deformation. Extensional deformation means a change in length between two points prior to and after deformation. The focus of our report was shear strain, which reflects the degree of shear deformation. The shear strain is defined as the change in the angle at the corner of interest in a square, when we divide the flowing fluid into many tiny squares. Shear strain multiplied by viscosity equals the shear stress. We can determine the shear stress of the aneurysmal wall if we measure the accurate shear strain very near the aneurysmal wall. We suspect that the shear strain is related to aneurysmal rupture.
In this study, we regarded grids of tag lines as groups of particles and applied PIV software to process the tagged MR images. We called this technique tagged MR image velocimetry. Combined with tagged MR imaging and the use of PIV software analyzing the flow vector, this technique demonstrated the vorticity and shear strain in the intracranial aneurysm replica. The information shown in our report can lead to the calculation of shear stress in the wall of an aneurysm. In the future, we hope to use this technique to estimate the rupture potential of an intracranial aneurysm on the basis of the wall stress caused by flow in the aneurysm.
We surmise that the signal-to-noise ratio (SNR) of the original images that we analyzed with the PIV software is important for good results. Our tagged MR images obtained might have had an insufficient SNR (Figs 3 and 4, row A). This might have led to fluctuations on the vector maps obtained by using PIV software (Figs 3 and 4, rows B–D). However, special coils with a high SNR and MR units with higher magnetic field strengths may be used to address this problem in the future.
The reliability of the tagged MR image velocimetry depends on their quality. To obtain clear, high-quality images, a high SNR is needed for MR imaging. Good-quality images with a high SNR will allow us to achieve sections thinner than the 5-mm sections that we used in this study. At present, a relatively long imaging time is needed. The development of a 3-T magnet or a head coil with a high SNR may resolve this problem.
Fewer flow vectors were observed in the left aspect of the aneurysm replica, where the stronger inflow was estimated to be present; tag lines were not clearly shown because of faster flow there. In this study, the temporal resolution of each consecutive tagged MR image was 9 milliseconds. We need a shorter TR to obtain clear tag lines in intracranial aneurysms with fast flow.
The tag lines disappeared soon after the trigger time of imaging. Therefore, trigger time should be selected to enable the acquisition of tagged MR images during any phase of the cardiac cycle.
This noninvasive technique can be applied in clinical practice, and it is believed to be a promising technique for estimating the hemodynamics in intracranial aneurysms. We should verify the accuracy of the tagged MR image velocimetry by using the original PIV technique as a reference.
Conclusion
Tagged MR imaging demonstrated the hemodynamics in the intracranial aneurysm replica. This study also demonstrated an analysis of the tagged MR image data with the aid of PIV software. Combined with tagged MR imaging and PIV analysis, this tagged MR image velocimetry showed flow vectors, vorticity, and shear strains in the replica. This technique is a promising and noninvasive technique for assessing the hemodynamics in intracranial aneurysms.
Footnotes
Supported by Grant-in-Aid for Scientific Research (B) from the Ministry of Education, Culture, Sports, Science and Technology, Japan.
Presented at the 40th annual meeting of American Society of Neuroradiology, Vancouver, British Columbia, Canada, May, 2002.
References
- Received May 21, 2002.
- Accepted after revision November 26, 2002.
- Copyright © American Society of Neuroradiology
In this issue


Jump to section
Related Articles
Cited By...
- No citing articles found.