Advertisement

Main menu

  • Home
  • Content
    • Current Issue
    • Accepted Manuscripts
    • Article Preview
    • Past Issue Archive
    • Video Articles
    • AJNR Case Collection
    • Case of the Week Archive
    • Case of the Month Archive
    • Classic Case Archive
  • Special Collections
    • AJNR Awards
    • ASNR Foundation Special Collection
    • Most Impactful AJNR Articles
    • Photon-Counting CT
    • Spinal CSF Leak Articles (Jan 2020-June 2024)
  • Multimedia
    • AJNR Podcasts
    • AJNR SCANtastic
    • Trainee Corner
    • MRI Safety Corner
    • Imaging Protocols
  • For Authors
    • Submit a Manuscript
    • Submit a Video Article
    • Submit an eLetter to the Editor/Response
    • Manuscript Submission Guidelines
    • Statistical Tips
    • Fast Publishing of Accepted Manuscripts
    • Graphical Abstract Preparation
    • Imaging Protocol Submission
    • Author Policies
  • About Us
    • About AJNR
    • Editorial Board
    • Editorial Board Alumni
  • More
    • Become a Reviewer/Academy of Reviewers
    • Subscribers
    • Permissions
    • Alerts
    • Feedback
    • Advertisers
    • ASNR Home

User menu

  • Alerts
  • Log in

Search

  • Advanced search
American Journal of Neuroradiology

American Journal of Neuroradiology

ASHNR American Society of Functional Neuroradiology ASHNR American Society of Pediatric Neuroradiology ASSR
  • Alerts
  • Log in

Advanced Search

  • Home
  • Content
    • Current Issue
    • Accepted Manuscripts
    • Article Preview
    • Past Issue Archive
    • Video Articles
    • AJNR Case Collection
    • Case of the Week Archive
    • Case of the Month Archive
    • Classic Case Archive
  • Special Collections
    • AJNR Awards
    • ASNR Foundation Special Collection
    • Most Impactful AJNR Articles
    • Photon-Counting CT
    • Spinal CSF Leak Articles (Jan 2020-June 2024)
  • Multimedia
    • AJNR Podcasts
    • AJNR SCANtastic
    • Trainee Corner
    • MRI Safety Corner
    • Imaging Protocols
  • For Authors
    • Submit a Manuscript
    • Submit a Video Article
    • Submit an eLetter to the Editor/Response
    • Manuscript Submission Guidelines
    • Statistical Tips
    • Fast Publishing of Accepted Manuscripts
    • Graphical Abstract Preparation
    • Imaging Protocol Submission
    • Author Policies
  • About Us
    • About AJNR
    • Editorial Board
    • Editorial Board Alumni
  • More
    • Become a Reviewer/Academy of Reviewers
    • Subscribers
    • Permissions
    • Alerts
    • Feedback
    • Advertisers
    • ASNR Home
  • Follow AJNR on Twitter
  • Visit AJNR on Facebook
  • Follow AJNR on Instagram
  • Join AJNR on LinkedIn
  • RSS Feeds

AJNR is seeking candidates for the AJNR Podcast Editor. Read the position description.

Research ArticleBRAIN

Quantitative Assessment of the Time Course of Infarct Signal Intensity on Diffusion-Weighted Images

James D. Eastwood, Stefan T. Engelter, James F. MacFall, David M. Delong and James M. Provenzale
American Journal of Neuroradiology April 2003, 24 (4) 680-687;
James D. Eastwood
  • Find this author on Google Scholar
  • Find this author on PubMed
  • Search for this author on this site
Stefan T. Engelter
  • Find this author on Google Scholar
  • Find this author on PubMed
  • Search for this author on this site
James F. MacFall
  • Find this author on Google Scholar
  • Find this author on PubMed
  • Search for this author on this site
David M. Delong
  • Find this author on Google Scholar
  • Find this author on PubMed
  • Search for this author on this site
James M. Provenzale
  • Find this author on Google Scholar
  • Find this author on PubMed
  • Search for this author on this site
  • Article
  • Figures & Data
  • Info & Metrics
  • Responses
  • References
  • PDF
Loading

Article Figures & Data

Figures

  • Fig 1.
    • Download figure
    • Open in new tab
    • Download powerpoint
    Fig 1.

    Simultaneous plots of signal intensity on DW images (thick line), signal intensity due to altered ADC (intermediate line), and signal intensity due to T2 effect (thin line). In this logarithmic plot, the effects of T2 and ADC add together to produce the total signal intensity seen on the DW image. The vertical lines separate four periods based on the magnitudes and signs (ie, positive or negative) of the relative contributions of SIb0 and SIRAT to SIDWI.

  • Fig 2.
    • Download figure
    • Open in new tab
    • Download powerpoint
    Fig 2.

    Scatterplot of the log of infarct signal intensity on DW images versus the log of hours from symptom onset. The thick line represents the polynomial function of best fit for the study data. The thin lines represent the 95% confidence limits for this fitted curve. The expected signal intensity of lesions was greater than that of control regions during the first 57 days after symptom onset.

  • Fig 3.
    • Download figure
    • Open in new tab
    • Download powerpoint
    Fig 3.

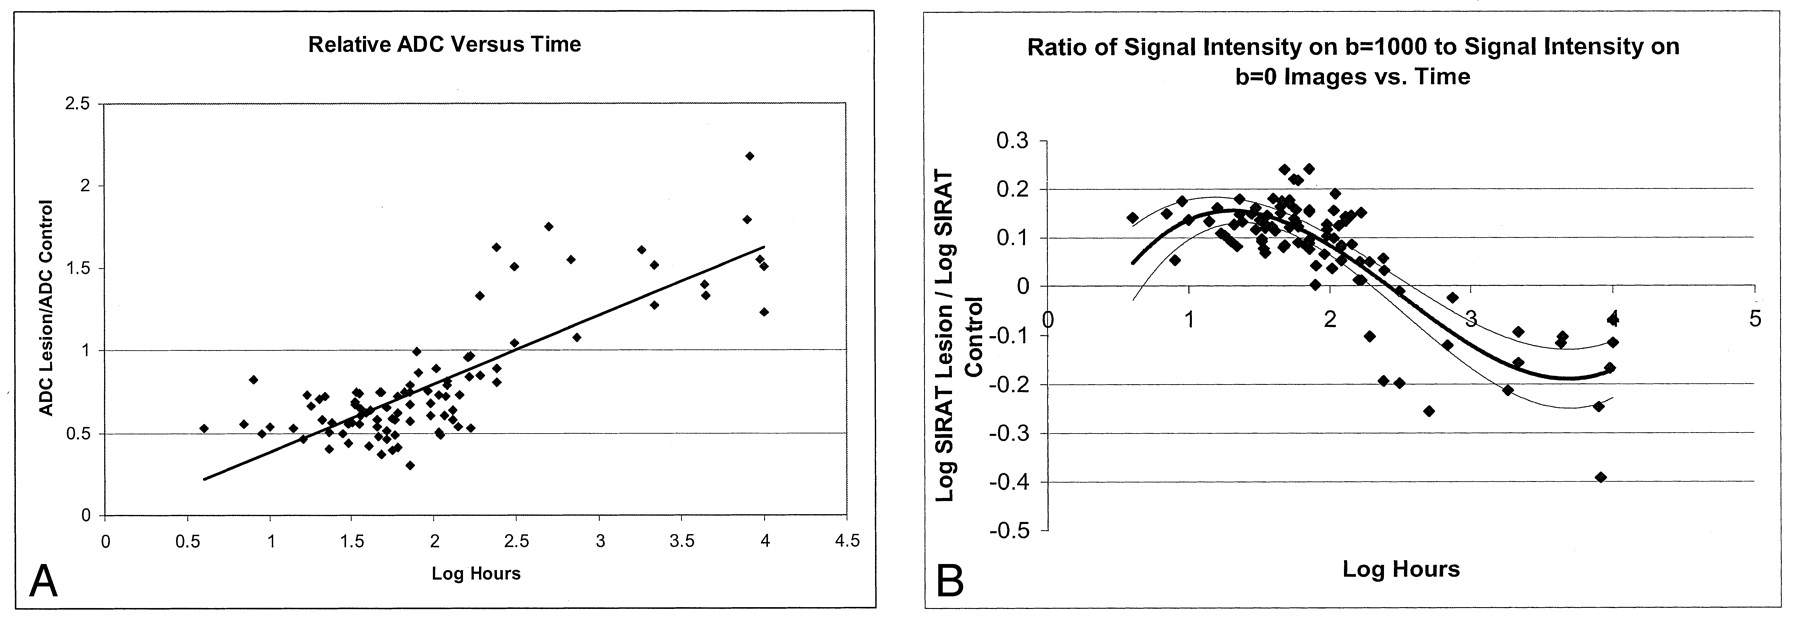
    Comparison of infarct diffusibility with time.

    A, Scatterplot of relative ADC versus log hours from symptom onset. The line represents the linear regression that fit the data. The line intercepts 1 (ie, infarcts had pseudonormal ADC values) at a time corresponding to 9.8 days.

    B, Scatterplot of log of the ratio of lesion signal intensity on the image with b = 1000 s/mm2 to the lesion signal intensity on the image with b = 0 s/mm2. The component of infarct signal intensity due to the ADC effect (SIRAT) is the ratio of SIDWI lesion/SIb0 lesion to SIDWI control/SIb0 control. Decreased ADC contributes in a positive way to infarct signal intensity during the first 10 days after symptom onset. Increased lesion ADC contributes in a negative way to infarct signal intensity thereafter. The thick line represents the best fit for the study data. The thin lines represent the 95% confidence limits for this fitted curve.

  • Fig 4.
    • Download figure
    • Open in new tab
    • Download powerpoint
    Fig 4.

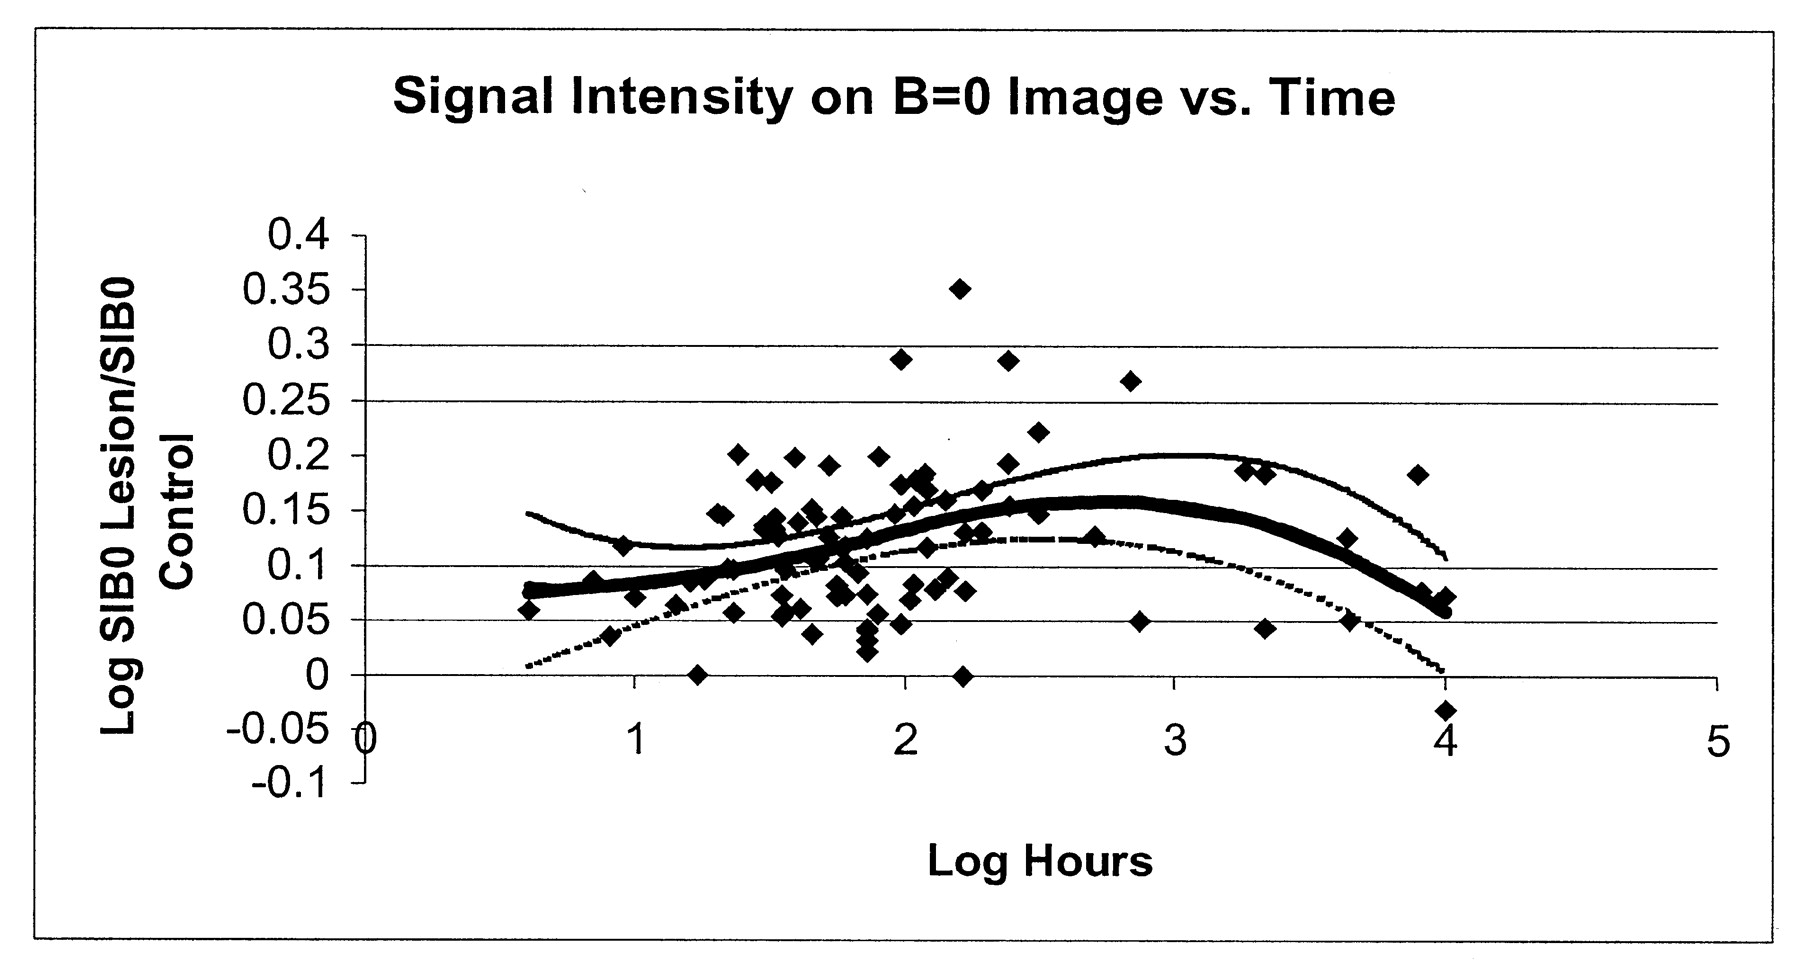
    Scatterplot of the log of SIb0 versus the log of hours from symptom onset. The thick line represents the polynomial function of best fit. The thin lines represent the 95% confidence limits for this fitted curve. T2 shine-through was typically substantial and positive throughout the studied time course, and it was maximal at about 2 weeks.

  • Fig 5.
    • Download figure
    • Open in new tab
    • Download powerpoint
    Fig 5.

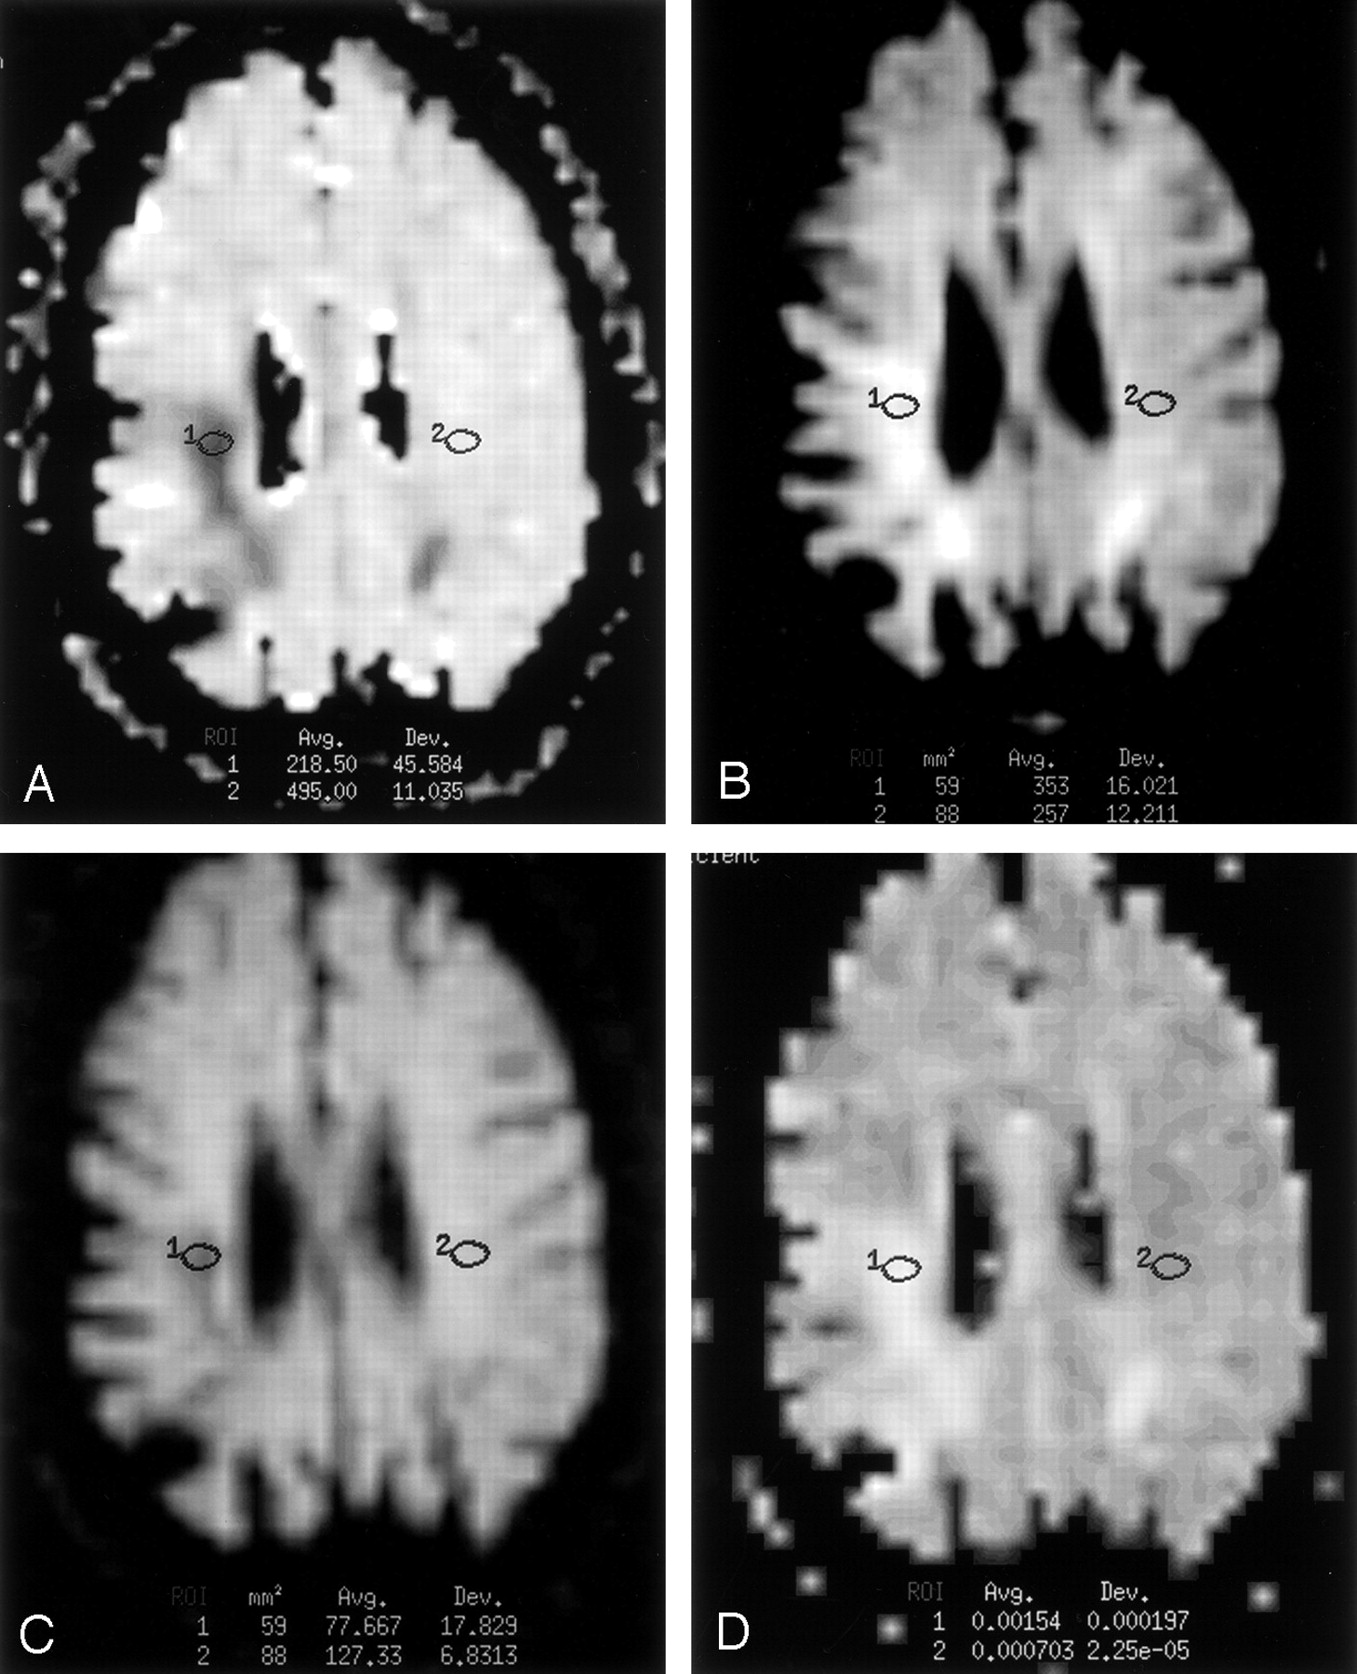
    Images in a 63-year-old woman with an onset of left-sided weakness 26 days before imaging. Regions 1 and 2 indicate the lesion ROI and control ROI, respectively.

    A, Ratio DW image was computed as the 1000 times the ratio of the image with b = 1000 s/mm2 image divided by the image with b = 0 s/mm2. Image shows an infarct in the right frontal lobe with signal intensity (−33%) lower than that of the contralateral control tissue. This finding indicates increased tissue water motion in the infarct.

    B, Fluid-suppressed image (b = 0 s/mm2, TEeff =101 milliseconds, TI = 2200 milliseconds) shows substantially increased signal intensity (+93%).

    C, Standard DW image (b = 1000 s/mm2, TEeff = 101 milliseconds, TI = 2200 milliseconds) with both ADC and T2 effects shows increased signal intensity within the infarct (+30%). This is an example of a patient in period 3 (10–57 days). For patients imaged during this time period, the small negative effect of ADC on infarct signal intensity on DW images more than made up for by larger contribution of the increase of T2 to infarct signal intensity.

    D, ADC map shows that infarct ADC is increased 55% over that of the control tissue.

  • Fig 6.
    • Download figure
    • Open in new tab
    • Download powerpoint
    Fig 6.

    Images in a 74-year-old man with an onset of left-sided weakness 90 days before imaging.

    A, Ratio DW image was computed as the 1000 times the ratio of the image with b = 1000 s/mm2 image divided by the image with b = 0 s/mm2. Image shows that the infarct has a signal intensity 56% less than that of the control tissue.

    B, Fluid-suppressed image (b = 0 s/mm2, TEeff = 101 milliseconds, TI = 2200 milliseconds) shows infarct signal intensity 37% greater than that of the control tissue.

    C, Standard DW image (b = 1000 s/mm2, TEeff = 101 milliseconds, TI = 2200 ms) with both ADC and T2 effects shows infarct signal intensity 39% less than that of the control tissue. This is an example of a patient in period 4 (later than 57 days). For patients imaged during this time period, the large negative effect of ADC on infarct signal intensity on DW images is greater than the smaller positive contribution of T2 effect.

    D, ADC map shows that infarct ADC value is increased 119% compared with that of the contralateral tissue.

PreviousNext
Back to top

In this issue

American Journal of Neuroradiology: 24 (4)
American Journal of Neuroradiology
Vol. 24, Issue 4
1 Apr 2003
  • Table of Contents
  • Index by author
Advertisement
Print
Download PDF
Email Article

Thank you for your interest in spreading the word on American Journal of Neuroradiology.

NOTE: We only request your email address so that the person you are recommending the page to knows that you wanted them to see it, and that it is not junk mail. We do not capture any email address.

Enter multiple addresses on separate lines or separate them with commas.
Quantitative Assessment of the Time Course of Infarct Signal Intensity on Diffusion-Weighted Images
(Your Name) has sent you a message from American Journal of Neuroradiology
(Your Name) thought you would like to see the American Journal of Neuroradiology web site.
CAPTCHA
This question is for testing whether or not you are a human visitor and to prevent automated spam submissions.
Cite this article
James D. Eastwood, Stefan T. Engelter, James F. MacFall, David M. Delong, James M. Provenzale
Quantitative Assessment of the Time Course of Infarct Signal Intensity on Diffusion-Weighted Images
American Journal of Neuroradiology Apr 2003, 24 (4) 680-687;

Citation Manager Formats

  • BibTeX
  • Bookends
  • EasyBib
  • EndNote (tagged)
  • EndNote 8 (xml)
  • Medlars
  • Mendeley
  • Papers
  • RefWorks Tagged
  • Ref Manager
  • RIS
  • Zotero
0 Responses
Respond to this article
Share
Bookmark this article
Quantitative Assessment of the Time Course of Infarct Signal Intensity on Diffusion-Weighted Images
James D. Eastwood, Stefan T. Engelter, James F. MacFall, David M. Delong, James M. Provenzale
American Journal of Neuroradiology Apr 2003, 24 (4) 680-687;
del.icio.us logo Twitter logo Facebook logo Mendeley logo
  • Tweet Widget
  • Facebook Like
  • Google Plus One

Jump to section

  • Article
    • Abstract
    • Methods
    • Results
    • Discussion
    • Conclusion
    • References
  • Figures & Data
  • Info & Metrics
  • Responses
  • References
  • PDF

Related Articles

  • No related articles found.
  • PubMed
  • Google Scholar

Cited By...

  • DWI-ADC Mismatch Predicts Infarct Growth and Endovascular Thrombectomy Outcomes in Anterior Circulation Stroke
  • Regional Distribution of Brain Injury After Cardiac Arrest: Clinical and Electrographic Correlates
  • Regional distribution of anoxic brain injury after cardiac arrest: clinical and electrographic correlates
  • Prevalence and clinical relevance of diffusion-weighted imaging lesions: The Rotterdam study
  • Serum neurofilament light: A biomarker of neuroaxonal injury after ischemic stroke
  • Emerging Spectra of Silent Brain Infarction
  • Time Course of Axial and Radial Diffusion Kurtosis of White Matter Infarctions: Period of Pseudonormalization
  • MRI in acute cerebral ischemia of the young: The Stroke in Young Fabry Patients (sifap1) Study
  • An Updated Definition of Stroke for the 21st Century: A Statement for Healthcare Professionals From the American Heart Association/American Stroke Association
  • Complete Early Reversal of Diffusion-Weighted Imaging Hyperintensities After Ischemic Stroke Is Mainly Limited to Small Embolic Lesions
  • Diffusion Tensor MRI Reveals Chronic Alterations in White Matter Despite the Absence of a Visible Ischemic Lesion on Conventional MRI: A Nonhuman Primate Study
  • Recurrent episodes of hemiparesis and aphasia
  • Glioblastoma: what's ischemia got to do with it?
  • Persistent Infarct Hyperintensity on Diffusion-Weighted Imaging Late After Stroke Indicates Heterogeneous, Delayed, Infarct Evolution
  • Diffusion-Weighted MRI in 300 Patients Presenting Late With Subacute Transient Ischemic Attack or Minor Stroke
  • Crossref
  • Google Scholar

This article has not yet been cited by articles in journals that are participating in Crossref Cited-by Linking.

More in this TOC Section

  • Optimal MRI Sequence for Identifying Occlusion Location in Acute Stroke: Which Value of Time-Resolved Contrast-Enhanced MRA?
  • Evaluating the Effects of White Matter Multiple Sclerosis Lesions on the Volume Estimation of 6 Brain Tissue Segmentation Methods
  • Quiet PROPELLER MRI Techniques Match the Quality of Conventional PROPELLER Brain Imaging Techniques
Show more BRAIN

Similar Articles

Advertisement

Indexed Content

  • Current Issue
  • Accepted Manuscripts
  • Article Preview
  • Past Issues
  • Editorials
  • Editor's Choice
  • Fellows' Journal Club
  • Letters to the Editor
  • Video Articles

Cases

  • Case Collection
  • Archive - Case of the Week
  • Archive - Case of the Month
  • Archive - Classic Case

Special Collections

  • AJNR Awards
  • ASNR Foundation Special Collection
  • Most Impactful AJNR Articles
  • Photon-Counting CT
  • Spinal CSF Leak Articles (Jan 2020-June 2024)

More from AJNR

  • Trainee Corner
  • Imaging Protocols
  • MRI Safety Corner

Multimedia

  • AJNR Podcasts
  • AJNR Scantastics

Resources

  • Turnaround Time
  • Submit a Manuscript
  • Submit a Video Article
  • Submit an eLetter to the Editor/Response
  • Manuscript Submission Guidelines
  • Statistical Tips
  • Fast Publishing of Accepted Manuscripts
  • Graphical Abstract Preparation
  • Imaging Protocol Submission
  • Evidence-Based Medicine Level Guide
  • Publishing Checklists
  • Author Policies
  • Become a Reviewer/Academy of Reviewers
  • News and Updates

About Us

  • About AJNR
  • Editorial Board
  • Editorial Board Alumni
  • Alerts
  • Permissions
  • Not an AJNR Subscriber? Join Now
  • Advertise with Us
  • Librarian Resources
  • Feedback
  • Terms and Conditions
  • AJNR Editorial Board Alumni

American Society of Neuroradiology

  • Not an ASNR Member? Join Now

© 2025 by the American Society of Neuroradiology All rights, including for text and data mining, AI training, and similar technologies, are reserved.
Print ISSN: 0195-6108 Online ISSN: 1936-959X

Powered by HighWire