
Abstract
BACKGROUND AND PURPOSE: Theoretically, proton (1H) MR spectroscopy at a higher field strength has the advantages of higher signal-to-noise ratio and improved spectral resolution. We therefore compared the ability of single-voxel 1H MR spectroscopy at 1.5 and 3 T to diagnostically discriminate among cognitively normal elderly subjects, patients with mild cognitive impairment (MCI), and patients with Alzheimer disease (AD).
METHODS: At both 1.5 and 3 T, we studied 41 cognitively normal elderly subjects, 20 patients with MCI, and 20 patients with AD. In each subject, 1H MR spectroscopy was performed at TEs of 30 and 135 ms and from voxels placed over the posterior cingulate gyri.
RESULTS: Average line widths and interexamination variability of metabolite ratios were higher at 3 T than at 1.5 T. Consistent quantification of glutamine (Gln) + glutamate/creatine (Cr) and Gln/Cr peak ratios occurred at 3 T but not at 1.5 T. Choline (Cho)/Cr (at TE = 135 ms) and myo-inositol (MI)/Cr were higher and N-acetylaspartate (NAA)/Cr (at TE = 135 ms) and NAA/MI were lower in patients with MCI than in cognitively normal subjects only at 1.5 T. MI/Cr and Cho/Cr were higher and NAA/Cr and NAA/MI were lower in patients with AD than in cognitively normal subjects at both 1.5 and 3 T. Differentiation of patients with AD from cognitively normal subjects by using the NAA/MI data was similar at both field strengths (P > .05).
CONCLUSION: With currently available technology, the diagnostic performance of 1H MR spectroscopy in patients with MCI and those with AD was not better at 3 T than at 1.5 T.
With the integration of 3-T imagers into clinical practice, there is growing interest in the diagnostic performance of proton (1H) MR spectroscopy at 3 T with respect to the established magnetic field strength of 1.5 T (1). 1H MR spectroscopy performed at a higher magnetic field strength has the advantages of higher signal-to-noise ratio (SNR) and improved spectral resolution. These gains are partially lost, however, with the decrease in transverse relaxation times and increase in magnetic susceptibility effects at higher magnetic field strengths (2–5). Although theoretic advantages and disadvantages of 1H MR spectroscopy at higher field strengths are well documented (2–5), the diagnostic utility of 1H MR spectroscopy at 1.5 and 3 T, to our knowledge, has not yet been compared clinically in the same subject group.
Single-voxel 1H MR spectroscopy from the posterior cingulate gyri at 1.5 T is sensitive to the biochemical changes in the brains of people with Alzheimer disease (AD) and those with amnestic mild cognitive impairment (MCI) (6, 7). The syndrome of MCI is recognized as a transitional clinical state between normal aging and AD (8, 9). Patients with MCI have reduced memory efficiency compared with normally aging elderly, and 80% of a cohort of MCI individuals will have converted to AD by 6 years (10). Because most patients with MCI ultimately develop dementia, it is reasonable to regard neuroimaging findings that are sensitive to the changes in the brains of people with MCI as markers of early or “prodromal” AD pathologic changes.
1H MR spectroscopy at 3 T theoretically should be more sensitive than that at 1.5 T to the biochemical changes in the brains of patients with MCI and AD for two reasons: 1) Higher SNR at 3 T may increase the test-retest reproducibility of metabolite ratios compared with that at 1.5 T, and 2) improved spectral resolution at 3 T may allow quantitation of the metabolites glutamine (Gln) and glutamate (Glu) thus providing additional metabolic information not available at 1.5 T (11). On the basis of the theoretic advantages of higher magnetic field strength, we hypothesized that the diagnostic accuracy of 1H MR spectroscopy for distinguishing among patients with AD, those with MCI, and cognitively normal elderly subjects would be better at 3 T than at 1.5 T.
Methods
Recruitment and Characterization
Twenty patients with probable AD, 20 with MCI, and 41 cognitively normal elderly subjects were recruited consecutively from the Alzheimer Disease Research Center (ADRC)/Alzheimer Disease Patient Registry (ADPR) at the Mayo Clinic (Rochester, MN) (12) between February 2000 and October 2001. These are institutional review board-approved prospective longitudinal databases of aging and dementia, and informed consent for participation is obtained from every subject and/or an appropriate surrogate. A behavioral neurologist and a neuropsychologist evaluated the individuals participating in the ADRC/ADPR. All subjects underwent structural brain MR imaging. Those with AD or MCI underwent laboratory testing, including chest radiography, electrocardiography, chemistry profile, complete blood cell count, thyroid function tests, vitamin B-12 level, folic acid level, and syphilis serology. At the completion of the evaluation, a consensus committee meeting was held involving the behavioral neurologists, neuropsychologists, nurses, and the geriatrician who evaluated the subjects. Subjects with structural abnormalities that could produce dementia, cortical infarction, tumor, or subdural hematoma and who had concurrent illnesses or treatments interfering with cognitive function other than AD were excluded. Subjects were not excluded for the presence of leukoaraiosis. Mini-Mental State Examination (MMSE) (13) and Dementia Rating Scale (DRS) (14) scores at the time of 1H MR spectroscopy examinations were recorded in every subject.
Subjects who were classified as probable AD fulfilled the Diagnostic and Statistical Manual of Mental Disorders, Revised Third Edition (DSM-III-R) (15) criteria for dementia, and the National Institute of Neurologic and Communicative Disorders and Stroke/Alzheimer Disease and Related Disorders Association (NINCDS/ADRDA) (16) criteria for AD.
The operational definition of MCI was clinical. Patients with MCI were defined by the following characteristics: 1) subjective memory complaint, 2) normal general cognitive function determined by tests of general intellectual function, 3) normal activities of daily living, 4) objective memory impairment, and 5) not demented (8). Cognitively normal subjects were defined as individuals who 1) were independently functioning community dwellers, 2) did not have active neurologic or psychiatric conditions, 3) had no cognitive complaints, 4) had a normal neurologic examination, and 5) were not taking any psychoactive medications in doses that would impact cognition.
1H MR Spectroscopy
All subjects underwent single-voxel 1H MR spectroscopy at both 1.5 and 3 T within a maximum period of 1 week. We also performed 1H MR spectroscopy on a standard phantom for quality control before each clinical study with both units. The 1H MR spectroscopy phantom contained the major brain metabolites: N-acetylaspartate (NAA), creatine (Cr), choline (Cho), myo-inositol (MI), lactate, and Glu. All 1H MR spectroscopy studies were performed by using the automated single-voxel MR spectroscopy package (17) Proton Brain Examination/Single Voxel (PROBE/SV; GE Medical Systems, Milwaukee, WI) with both 1.5- and 3-T units (Signa; GE Medical Systems) equipped with bird-cage head coils. T1-weighted images in sagittal and coronal planes were obtained for localizing the 1H MR spectroscopy voxels. The point-resolved spectroscopy (PRESS) pulse sequence with TR of 2000 ms, 2048 data points, and 128 excitations was used for the examinations. 1H MR spectroscopy voxels of 8 cm3 (2 × 2 × 2 cm) were placed over the posterior cingulate gyri on a midsagittal localizing image covering posterior cingulate gyri and inferior precunei bilaterally (Fig 1).

A, Midsagittal, B, axial, and C, coronal T1-weighted images (700/14) show the location of the 8-cm3 posterior cingulate 1H MR spectroscopy voxel.
We performed two 1H MR spectroscopy acquisitions by using TEs of 30 and 135 ms. A TE of 30 ms was chosen to quantify metabolites with short transverse relaxation times (MI, Glu, and Gln). A TE of 135 ms was chosen to decrease the contamination of metabolite peaks with relatively longer transverse relaxation times (NAA, Cr, and Cho) with underlying broad resonances. NAA/Cr and Cho/Cr ratios were obtained from acquisitions with TEs of 30 and 135 ms; MI/Cr and NAA/MI ratios were obtained only from the acquisitions with TE of 30 ms.
The preimaging algorithm of the PROBE software automatically adjusted the transmitter and receiver gains and center frequency. The local magnetic field homogeneity was optimized with the three-plane auto-shim procedure with linear gradient shimming, and the flip angle of the third water-suppression pulse was adjusted for chemical shift water suppression (CHESS) before PRESS acquisition. Metabolite intensity ratios of NAA, Cho, and MI were automatically calculated at the end of each PROBE/SV acquisition. Glu + Gln/Cr and Glu/Cr ratios were determined from the 1.5- and 3-T spectra with TE of 30 ms by using the LCModel analysis software (18). Separate model spectra were acquired for 1.5- and 3-T LCModel analyses. We did not include the data from Glu and Gln peak ratios at 1.5 T and Glu/Cr at 3 T in the final analyses because they could not be quantitated reliably nearly half the time (SD of the estimated metabolite concentration was > 20%) (Fig 2). Because of the differences in metabolite ratio coefficients of variation observed during interim analysis of the data, we also recorded full-width at half-maximum (FWHM) of the unsupressed water peak of the 1H MR spectra in the last 37 cases. We also recorded the Cr peak SNR in phantom experiments, which was calculated by the PROBE software.

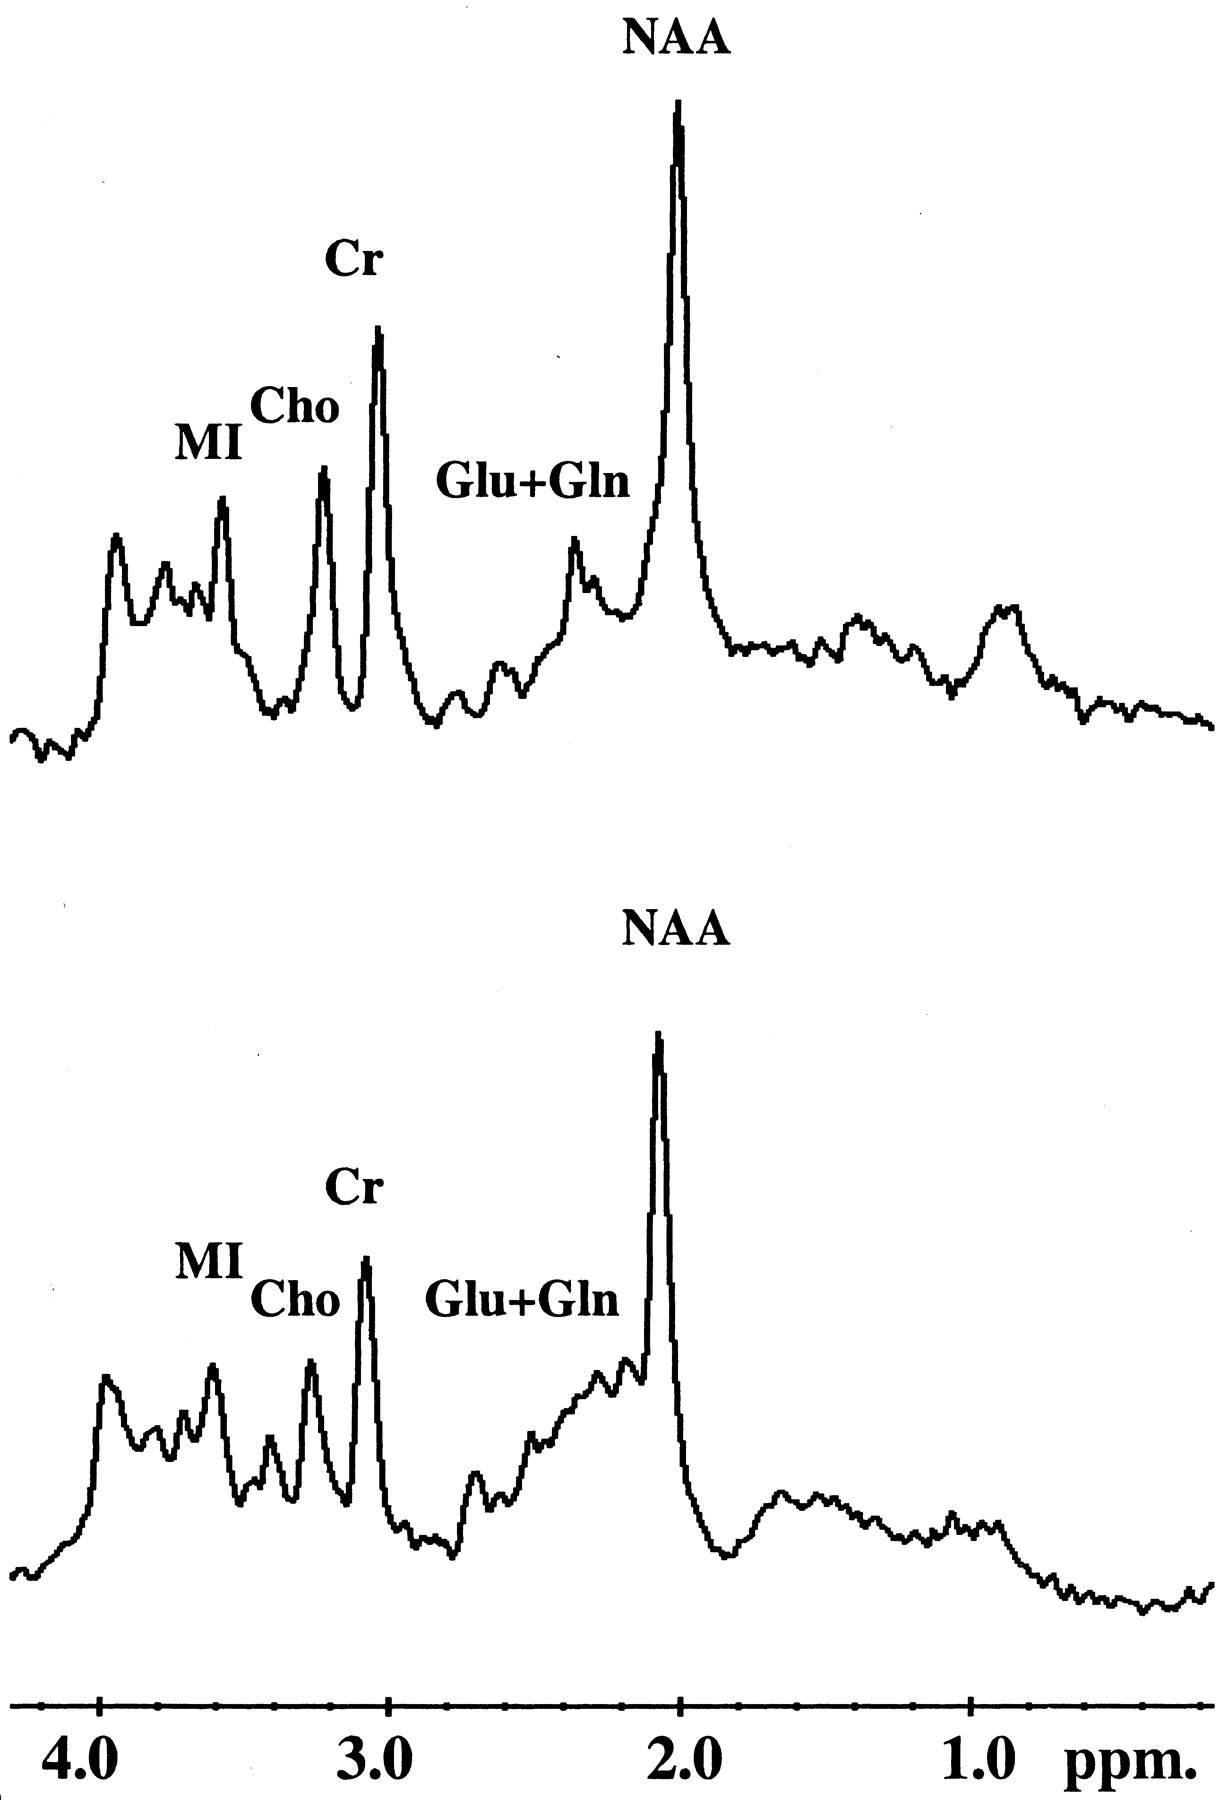
Examples of 1H MR spectra (2000/30) obtained at 3 T (top) and at 1.5 T (bottom) from the posterior cingulate voxel. Glu + Gln peak resonances are better resolved at 3 T than at 1.5 T. The resonance at 3.4 ppm that is more prominent in the 1.5- than in the 3-T spectra is scyllo-inositol and/or taurine (3).
Statistical Analysis
Nonparametric statistics were used for the data that were not normally distributed. Differences in age and education (in years) among the three clinical groups were tested by means of rank sum tests. Sex differences were tested by using χ2 tests. Coefficients of variation were calculated for each metabolite ratio from serial phantom studies and from the cognitively normal subjects at both magnetic field strengths, and the coefficients of variation were compared by using a two-sample t statistic approximation (19). Rank sum tests were performed for between-group comparisons of metabolite ratios. Receiver operating characteristic (ROC) analysis was used to compare the diagnostic accuracy of 1H MR spectroscopy at 1.5 and 3 T in patients with AD. The χ2 statistic was used to compare the area under the two ROC curves (20). A P value of .05 or less was considered to indicate a statistically significant difference.
Results
Demographic and clinical data of the study group are listed in Table 1. Median ages of the cognitively normal subjects, patients with MCI, and those with probable AD were not significantly different (P > .05). There was a statistically significant difference among male-to-female ratios in the cognitively normal group (17:24), patients with MCI (14:6), and those with AD (7:13) (P < .001, χ2 test). Years of education were not different among the three clinical groups (P > .05). As expected, median MMSE and DRS scores were higher in cognitively normal subjects than in patients with MCI or AD and higher in patients with MCI than in those with AD.
Demographic and clinical data for the 81 subjects
To assess interexamination variability, coefficients of variation of metabolite ratios were calculated from 81 phantom studies performed on each MR unit during the 20 months of the study period (Table 2). Except for Cho/Cr, the coefficients of variation of all metabolite ratios were lower at 1.5 T than at 3 T in phantom studies (P < .01). To assess intersubject variability, coefficients of variation of metabolite ratios were calculated in 41 elderly cognitively normal subjects at both magnetic field strengths. Although the coefficients of variation of metabolite ratios from the posterior cingulate voxel were always lower at 1.5 T than at 3 T, only the coefficients of variation of Cho/Cr ratios at 1.5 and 3 T were significantly different (P < .05). FWHM of the unsupressed water peaks from the posterior cingulate voxel with TEs of 135 and 30 ms and from the phantom studies with a TE of 30 ms are listed in Table 3. Although FWHM (in hertz) would be expected to double at 3 T compared with 1.5 T, FWHM values were consistently slightly more than two times higher at 3 T than at 1.5 T. The average Cr peak SNR in phantom studies with TE of 30 ms was 165 ± 24 at 1.5 T and 203 ± 34 at 3 T.
Coefficients of variation (%) of metabolite ratios obtained from the phantom and from the posterior cingulate voxel in the cognitively normal elderly subjects, at 1.5 and 3 T
Average FWHM of the unsuppressed water peak at 1.5 and 3 T
Table 4 lists the median and range of metabolite ratios obtained from each clinical group, at 1.5 and 3 T. Because male-to-female ratios were different in the three clinical groups, rank sum tests were performed to test for differences in metabolite ratios between men and women. We did not find any difference in the metabolite ratios of men versus those in women at either field strength (P > .05). Metabolite ratios of patients with MCI were nearly always in-between those of patients with AD and the cognitively normal subjects, which matches the clinical findings in MCI.
Metabolite ratios from the posterior cingulate voxel in the 81 subjects, at 1.5 and 3 T
At 1.5 T, MI/Cr (P = .019) and Cho/Cr ratios at TE of 30 ms (P = .04) were higher and NAA/Cr at TE of 135 ms (P = .003) and NAA/MI (P = .004) were lower in patients with MCI than in the cognitively normal elderly subjects. When cognitively normal subjects and patients with AD were compared at 1.5 T, MI/Cr (P < .001) and Cho/Cr ratios at TE of 30 and 135 ms (P = .041 and P = .025) were higher, NAA/Cr at TE of 30 and 135 ms and NAA/MI (P < .001 for all comparisons) were lower in patients with AD than in the cognitively normal elderly. Comparing patients with MCI and those with AD at 1.5 T revealed lower NAA/Cr (P = .023) and NAA/MI (P = .003) ratios in patients with AD.
At 3T, no difference was noted between the metabolite ratios of patients with MCI and the cognitively normal elderly, nor between patients with MCI and those with AD (P > .05). The MI/Cr ratio was higher (P = .041) and NAA/MI and NAA/Cr ratios at TE of 30 and 135 ms were lower (P = .01 for all comparisons) in patients with AD than in cognitively normal elderly subjects at 3 T. Although there was a trend toward decreased Glu + Gln/Cr ratios from normal to MCI to AD, there were no statistically significant differences (for AD vs normal, P = .10) among the three clinical groups. Furthermore, we did not find any between-group differences in Glu/Cr ratios.
ROC analysis was used to compare the diagnostic accuracy of NAA/MI ratios in distinguishing patients with AD from cognitively normal elderly at 1.5 and 3 T. NAA/MI was chosen because it combines NAA/Cr, which was lower in patients with AD than in cognitively normal subjects, and MI/Cr, which was higher in patients with AD than cognitively normal subjects at both 1.5 and 3 T. Areas under the two ROC curves were 0.81 for 1.5 T and 0.70 for 3T, and they were not significantly different (P = .1) (Fig 3). We did not compare the ability of 1H MR spectroscopy to distinguish patients with MCI from cognitively normal elderly subjects because none of the metabolite ratios at 3 T were different when the two clinical groups were compared.

ROC curves comparing the NAA/MI ratios to differentiate patients with AD from cognitively normal elderly subjects, at 1.5 T (dotted line) and at 3 T (straight line). There is no significant difference between the areas under the two ROC curves (P = .1)
Discussion
The incentive to perform 1H MR spectroscopy at higher field strengths comes from the expectation that the diagnostic sensitivity of 1H MR spectroscopy to biochemical alterations in AD would increase with improved SNR and spectral resolution at higher fields. In theory, there is a linear relationship between SNR and magnetic field strength. When Barker et al (3) compared 1H MR spectroscopy SNR at 1.5 and 3 T, improvement in SNR at short TE was only 28% at 3T, considerably less than the expected improvement of 100%. We measured a similar increase in Cr peak SNR of 23% at 3 T with respect to 1.5 T from phantom studies. Lower-than-expected SNR at 3 T may be attributed to shorter metabolite transverse relaxation times and higher magnetic field inhomogeneity at 3 T than at 1.5 T (3). Prolonged longitudinal relaxation at higher field strengths will cause some signal intensity losses at 3 T with respect to 1.5 T. Longitudinal relaxation of the 1H MR spectroscopy metabolites even at 4 T, however, is shorter than the TR we used (2). With a TR of 2 seconds, T1 weighting of the resonances and T1-related signal intensity losses would be minimal.
Magnetic susceptibility effects are enhanced with field strength, increasing the magnetic field inhomogeneity within the 1H MR spectroscopy voxel. This effect, coupled with shorter transverse relaxation times, translates to an increase in line width at 3T, decreasing both the SNR and the accuracy of quantitative analysis of the 1H MR spectra. These field strength-dependent differences in line width may in part explain our test-retest reproducibility data. Coefficients of variation of metabolite ratios calculated for interexamination variability from the phantom and for intersubject variability from the posterior cingulate voxel were nearly always higher at 3 T than at 1.5 T. Statistically significant greater interexamination variability was found at 3 T than at 1.5 T for NAA/Cr, MI/Cr, and NAA/MI ratios, and greater intersubject variability was observed only for Cho/Cr.
Another explanation for higher interexamination variability of the MI/Cr ratio at 3 T than at 1.5 T may be that the MI peak is a pseudosinglet at 1.5 T and multiplet at higher field strengths such as 4 T. A recent report described divergent results for intersubject variability at 4 versus 1.5 T: variability was less for NAA, Cr, and Cho peak measurements and more for MI at 4 T than at 1.5 T (21). It is possible that quantitation of the MI peak would be subject to more error at 3 T than at 1.5 T owing to peak splitting. However, our data showed the intersubject variability of MI/Cr and NAA/MI ratios was equivalent or nonsignificantly greater at 3 T than at 1.5 T. Therefore, we cannot attribute test-retest reproducibility differences at 1.5 versus 3 T solely to MI peak quantitation errors.
In patients with MCI, MI/Cr and Cho/Cr ratios were higher and the NAA/MI ratio was lower than those ratios in the cognitively normal subjects, with TE of 30 ms at 1.5 T. Although a similar trend was observed at 3 T, no statistically significant differences were noted in metabolite ratios between patients with MCI and the cognitively normal elderly subjects. This difference at two field strengths may be explained by the higher intersubject variability observed at 3 T than at 1.5 T, resulting in a higher degree of overlap in the metabolite ratios of patients with MCI and those of the cognitively normal subjects at 3 T than at 1.5 T. Statistically significant differences were noted in NAA/Cr, MI/Cr, Cho/Cr, and NAA/MI ratios of cognitively normal subjects and patients with AD at both 1.5 and 3 T, and ROC analysis with NAA/MI ratios revealed that the diagnostic accuracy of 1H MR spectroscopy to distinguish patients with AD from cognitively normal subjects was similar at 3 and at 1.5 T. Higher sensitivity to field inhomogeneity and shorter metabolite T2 relaxation times at 3 versus 1.5 T are the most logical explanations for the diagnostic accuracy of 1H MR spectroscopy in AD not being higher at 3 T than at 1.5 T (22).
A diagnostic advantage of 1H MR spectroscopy at 3 T in AD was superior spectral resolution. It was possible to consistently quantify Glu + Gln/Cr and Gln/Cr at 3 T, which was not possible at 1.5 T. The Glu + Gln/Cr ratio has been previously shown to be lower in patients with AD than in cognitively normal elderly subjects (11, 23). Although we did not find any statistically significant between-group differences in Glu + Gln/Cr ratios, there was a trend of a decrease in ratios from cognitively normal to MCI to AD. The reason for this difference between results of previous studies and our findings may be that the patients with AD in our study consisted of individuals with only mild to moderate AD. The downward trend of the Glu + Gln/Cr ratio from cognitively normal to MCI to AD in our data suggests that a statistically significant difference might be found if patients with more severe AD were studied (11).
We chose to place the 1H MR spectroscopy voxel over the posterior cingulate gyri and precunei because in a previous study diagnostic accuracy in MCI and AD from the posterior cingulate voxel was better than that in other regions in the brain, such as superior temporal lobe and medial occipital lobe (6). Posterior cingulate gyrus is a limbic cortical region that is affected relatively early in the pathologic progression of the disease (24). Furthermore, decreases in posterior cingulate gyrus glucose metabolism on positron emission tomographic images have been encountered both in patients with AD and also in cognitively normal subjects who are at genetic risk of developing AD (25, 26). The posterior cingulate voxel included the inferior precuneus, from which the highest rates of atrophy have been measured in patients with mild AD by using fluid-registered serial MR imaging (27). From a pathologic standpoint alone, another attractive region to study would have been the anteromedial temporal lobe, including hippocampus and entorhinal cortex, because these structures are the site of earliest pathologic changes in AD (24). However, we were unable to consistently obtain technically satisfactory quality spectra from this region owing to the proximity of magnetic susceptibility artifacts created by the tissue-air interface near the petrous bone (6). The location of the posterior cingulate voxel was relatively free of air-bone-brain interface susceptibility problems.
Conclusion
1H MR spectroscopy at 1.5 T is sensitive to the biochemical changes in people with MCI. This is a significant finding because most individuals with MCI develop AD in time, and we can safely conclude that 1H MR spectroscopy at 1.5 T is diagnostically sensitive during the prodromal phase of AD. 1H MR spectroscopy therefore is potentially valuable not only from the standpoint of early diagnosis of AD, but also as a potential marker of therapeutic efficacy for preventive drug trials in AD. The diagnostic accuracy of 1H MR spectroscopy to distinguish patients with AD from cognitively normal subjects is not higher at 3 T than at 1.5 T, using the commercially available technology currently provided by the manufacturer. The primary advantage of 3 over 1.5 T is consistent quantitation of Glu + Gln/Cr and Gln/Cr ratios. The advantages of 3 T are offset, however, by the sensitivity of 3 T to field inhomogeneity. Improving field homogeneity within the voxel may help to achieve optimum diagnostic performance from 1H MR spectroscopy at 3 T in patients with AD. One way of improving field homogeneity is regionally selective higher order shimming over the 1H MR spectroscopy voxel, which has been beneficial in other 3-T MR applications such as MR angiography (1) and was not available for our study. 1H MR spectroscopy with 1.5-T systems has matured over the time these systems have been used in clinical practice. It is reasonable to expect the diagnostic performance of 1H MR spectroscopy at 3 T to improve as the flexibility of the shimming software improves and as other engineering advances geared toward clinical imaging at field strengths higher than 3 T become commercially available.
Acknowledgments
The authors acknowledge Matthew A. Bernstein, PhD, and Joel P. Felmlee, PhD, for technical assistance.
Footnotes
Supported by National Institutes of Health-National Institute on Aging grants AG11378, AG06786, AG16574.
Presented in part at the 10th scientific meeting of the International Society for Magnetic Resonance in Medicine, Honolulu, HW, May 18–24, 2002.
References
- Received September 6, 2002.
- Accepted after revision November 22, 2002.
- Copyright © American Society of Neuroradiology
In this issue


Jump to section
Related Articles
Cited By...
- GABA decrease is associated with degraded neural specificity in the visual cortex of glaucoma patients
- Various MRS Application Tools for Alzheimer Disease and Mild Cognitive Impairment
- Magnetic resonance spectroscopy of the brain
- MRS in presymptomatic MAPT mutation carriers: A potential biomarker for tau-mediated pathology
- Monitoring disease progression in transgenic mouse models of Alzheimer's disease with proton magnetic resonance spectroscopy
- Reduced medial temporal lobe N-acetylaspartate in cognitively impaired but nondemented patients