
Abstract
BACKGROUND AND PURPOSE: Brain perfusion is disturbed by cerebral arteriovenous malformations (AVMs). Our study was conducted to determine the radiosurgical effects on this disturbed perfusion.
METHODS: MR perfusion imaging with independent component analysis was performed in five healthy subjects and 19 patients with AVM before and after radiosurgery (every 6 months up to 2 years). Perfusion map relative cerebral blood volume (rCBV), cerebral blood flow (rCBF), and mean transient time (rMTT) were assessed. Regions of interest (ROIs) on AVM target sections were defined as follows: N, AVM nidus; H, the rest of the ipsilateral hemisphere; P, immediately posterior to the nidus; A, immediately anterior to the nidus; Ar, anterior remote; Pr, posterior remote. Similar ROIs in the contralateral hemisphere (N1, H1, P1, A1, Pr1, and Ar1) served as internal references. Perfusion ratios of ROI–ROI1 were defined. Nonparameteric Mann-Whitney U tests and generalized linear models were used for statistical analysis.
RESULTS: Before radiosurgery, patients’ H/H1 rCBV and rCBF ratios were significantly higher than those of healthy subjects (P < .005), indicating AVM steal. Three types of perilesional perfusion disturbance were observed. From the first postradiosurgical follow-up at 6 months, N/N1 rCBV and rCBF ratios gradually decreased to 1.0 (both P < .001), whereas rMTT ratios gradually increased to 1.0 (P < .015); H/H1, A/A1, and P/P1 rCBV and rCBF ratios decreased after radiosurgery (P < .005), indicating reversal of steal toward normal perfusion.
CONCLUSION: Initial high transnidal flow and perinidal perfusion disturbances were demonstrated. They gradually changed toward normal perfusion after radiosurgery. This explains, in part, the pathophysiologic factors of AVM and therapeutic effects.
Cerebral arteriovenous malformations (AVMs) contain a cluster of vascular networks (the nidus), and this nidus contains low resistance and causes high-flow transnidal shunts between both sides of the nidus. The shunts cause arterial hypotension in the neighboring vasculature owing to the diversion of blood from the vicinity of the adjacent brain tissues to the AVM. This is known as the cerebral “steal phenomenon.” Clinically, the progressive or fluctuating neurologic deficits that occur in 4–12% of patients with AVMs are attributed partly to the steal phenomenon (1). Also, the steal phenomenon might cause neurologic deficits in the remote areas of an AVM (2). After radiosurgical elimination of AVMs, one group of authors observed that 67% of patients were seizure-free or had better seizure control and 94% of patients had stable or improved neurologic status (3). Some investigators ascribe the neuropsychologic improvement after AVM treatment as evidence of steal elimination (4). Nevertheless, debate remains concerning the association of AVM steal and clinical manifestations.
Independent component analysis (ICA) is a factor analysis technique that was initially proposed to separate observed signals into statistically independent source signals (5, 6). It was successfully applied to functional MR imaging data in order to identify spatially independent cortical activation areas and to remove arterial signals before calculating hemodynamic parameters of MR perfusion imaging (7, 8). The technique was applied to dynamic susceptibility-contrast brain perfusion MR imaging (DSC-MR imaging) to segment multiple, independent, hemodynamic components and their concentration-time curves (9, 10). We conducted the current study by applying ICA to DSC-MR imaging with the aim of quantitatively defining the reversible cerebral perfusion disturbance.
Methods
Patient Population and Treatments
Nineteen patients with AVMs who were referred for Gamma Knife radiosurgery were recruited between 2001 and 2003. Eligibility criteria were presence of a supratentorial convexity AVM and no history of previous treatments (radiosurgery, embolization, or microsurgery).
According to the Spetzler-Martin system (11), there were four grade II, 10 grade III, three grade IV, and two grade V AVMs. The patient population comprised 12 male and seven female patients whose ages ranged from 17 to 49 years (mean, 33 years). Clinically, at presentation, the AVM manifested with bleeding in two patients, bleeding and seizures in three, seizures alone in nine, headache in three, and proptosis in two. The time intervals between ictus and radiosurgery of the five hemorrhagic AVMs were 3, 4, 5, and 21 months and 15 years (Table 1). Written informed consent was obtained from all patients for all procedures and approved by the Quality Assurance Committee of the Hospital.
Summary of demographic data of patients with AVM, posttherapeutic follow-up period, and adverse effects
All patients underwent standard stereotactic MR imaging and x-ray digital subtraction angiography before radiosurgery (12, 13). The AVMs were treated with mean (range) maximum/minimum target doses of 30.0 (28.2–32.5)/17.9 (15.5–18.5) Gy. The AVM volumes defined from the dose plan ranged from 10 to 53 mL (mean, 25 mL) (Table 2).
AVM nidus volume and irradiation parameters and dosage of radiosurgery
MR Perfusion Study
DSC-MR imaging was undertaken with a 1.5-T system (Signa, CV/i, GE Medical Systems, Milwaukee, WI) by using gradient-echo echo-planar pulse sequences. The imaging parameters were as follows: transaxial imaging, TR/TE = 1000/40 ms, flip angle = 60°, field of view = 24 × 24 cm, matrix = 128 × 128, section thickness/gap = 7/7 mm for seven sections, one acquisition, and 70 images per section location (except eight sections and 60 images per section for the baseline study in case 2). Ten to 14 mL of gadodiamide (0.5 mmol/mL, 0.2 mL/kg body weight, Omniscan; Amersham Health, Oslo, Norway) followed by 20 mL of normal saline was administered through the antecubital vein at the rate of 3–4 mL/s with a power injector.
Postprocessing and ICA
From DSC-MR imaging, the section having the largest AVM nidus diameter was selected as the target section for perfusion mapping. Off-line postprocessing of the brain perfusion images by using Fast ICA was performed (6, 10). Five independent component images were blindly segmented. They were arteries, gray matter, white matter, vein and sinus, and choroid plexus components. The choroid plexus included components that contained mixtures of arteriole, capillary, and venule, and represented a group of multiphasic hemodynamics. For healthy subjects, the arteries component indicated in-plane major branches of cerebral arteries. For patients with AVMs, the arteries component indicated arteries and AVM nidus. It was extracted from the images by automatic threshold by using Otsu’s method (14). The arteries components were used as a mask to produce an averaged arterial signal intensity-time curve and arterial input function (i.e., an averaged concentration-time curve of arterial area). The in-plane arterial input function was used for perfusion mapping of the brain tissues from DSC-MR imaging on a voxel-by-voxel basis (9). Based on residue detection in indicator dilution theory, the relative cerebral blood volume (rCBV) in a voxel is proportional to the area under the concentration-time curve in a voxel (15, 16). The relative cerebral blood flow (rCBF) was computed by means of the singular value deconvolution method (17). The relative mean transient time (rMTT) of contrast agent particles was defined as the ratio between rCBV and rCBF according to the central volume principle (18, 19). All imaging analysis routines for the perfusion parameters—rCBV, rCBF, and rMTT—were implemented by using MATLAB (MathWorks, Inc., Natick, MA) code and performed on a 2-GHz Pentium-based personal computer. Regions of interest (ROIs) on the perfusion maps were defined as follows: AVM nidus, N; the rest of the ipsilateral hemisphere, H; areas with the same size of nidus and immediately posterior to the nidus, P; immediately anterior, A; anterior remote, Ar; and posterior remote, Pr. The similar ROIs of the contralateral hemisphere (N1, H1, P1, A1, Ar1, and Pr1) were used as an internal reference (Fig 1). The ROIs were repeatedly drawn (three times) by the same neuroradiologist (W-Y.G.) during the study period, retrospectively. Mean values of the ROIs’ perfusion parameters were used for the subsequent analysis.

Schematic shows the ROIs for perfusion measurement on the target section of a DSC-MR image. N indicates AVM nidus; H, the rest of the ipsilateral hemisphere; P, posterior immediate; Pr, posterior remote; A, anterior immediate; Ar, anterior remote. Similar ROIs of the contralateral hemisphere (N1, H1, P1, Pr1, A1, and Ar1) were used as controls.
Perfusion maps of 10 sections from five healthy subjects served as normal controls. Their right hemisphere-to-left hemisphere ratios (H/H1) of perfusion parameters were used as the normal reference for patients. Abnormally high N/N1 rCBV and rCBF ratios and low N/N1 rMTT ratios indicated high flow transnidal shunts in AVMs. Abnormal rCBV and rCBF ratios of P/P1, A/A1, Ar/Ar1, Pr/Pr1, and H/H1 indicated brain perfusion disturbance of the hemisphere with lesion. The disturbance was secondary to the steal phenomenon. They were subdivided into three types based on rCBV and rCBF ratios, as described in Fig 2.

Schematic shows three types of perfusion disturbance: type 1, high perfusion in both immediate and remote perinidal areas; type 2, high perfusion in immediate and low perfusion in perinidal remote areas; and type 3, low perfusion in both immediate and remote perinidal areas. N indicates AVM nidus.
Postradiosurgical Follow-up
Patients were instructed to have follow-up visits for clinical and imaging evaluation every 6 months after radiosurgery. Conventional angiography was arranged only when no evidence of a remaining nidus was seen on MR images. All follow-up imaging was undertaken by using the same MR imaging unit, with the same imaging protocol. By the end of the current study, the median follow-up of the cohort of patients was 14 months: 24 months or more (n = 4), 18 months or more (n = 7), 12 months or more (n = 15), and 6 months or more (n = 19) (Table 1). The postradiosurgical AVM nidal volumes were defined by using 3D time-of-flight MR angiography. After radiosurgery, abnormal high signal intensity on T2-weighted images in the vicinity of the AVM nidus was defined as an area with radiation-induced edema. The areas of radiation-induced edema were graded according to the extent of signal intensity abnormality as mild (minimal signal intensity abnormality around the nidus), moderate (between mild and severe), or severe (signal intensity abnormality occupied more than one-third of the hemisphere on the target section). Preradiosurgical ratios of perfusion were used as a baseline control to evaluate radiosurgical effects on brain perfusion. Reduction in postradiosurgical N/N1 rCBV and rCBF ratios to 1.0 and elevation of N/N1 rMTT ratio to 1.0 indicated declining transnidal shunts. The trend of changes in perinidal and H/H1 ratios to 1.0 after radiosurgery indicated reversal of the steal. It was interpreted as radiosurgical effects on perinidal perfusion. Reversal of rCBV and rCBF ratios to less than 1.0 was indicative of impaired local perfusion due to radiation-induced edema.
Statistical Analysis
The nonparametric Mann-Whitney U test was used to compare perfusion parameters between patients and healthy subjects. To take into account the within-subject dependency of longitudinal studies, we used generalized linear models to evaluate the effect of time on all perfusion ratios by the generalized estimating equations method. The analysis was conducted on SAS/STAT v8.2 package by the PROC GENMOD procedure (20, 21).
Results
Perfusion in Patients with AVM before Radiosurgery and in Healthy Subjects
The H/H1 rCBV and rCBF ratios of patients with AVM were significantly larger than those of healthy subjects (P < .001 and P = .001, respectively). The results indicated that the hemisphere with the lesion had higher rCBV and rCBF. For rMTT ratios, the difference was not statistically significant (P = .270; Fig 3). Type 1 and type 2 perfusion disturbances occurred in most AVMs; type 3 perfusion disturbance was seen in only three AVMs (Figs 4 and 5). Four AVMs contained more than one type of perinidal perfusion disturbance (Table 1, Fig 6).
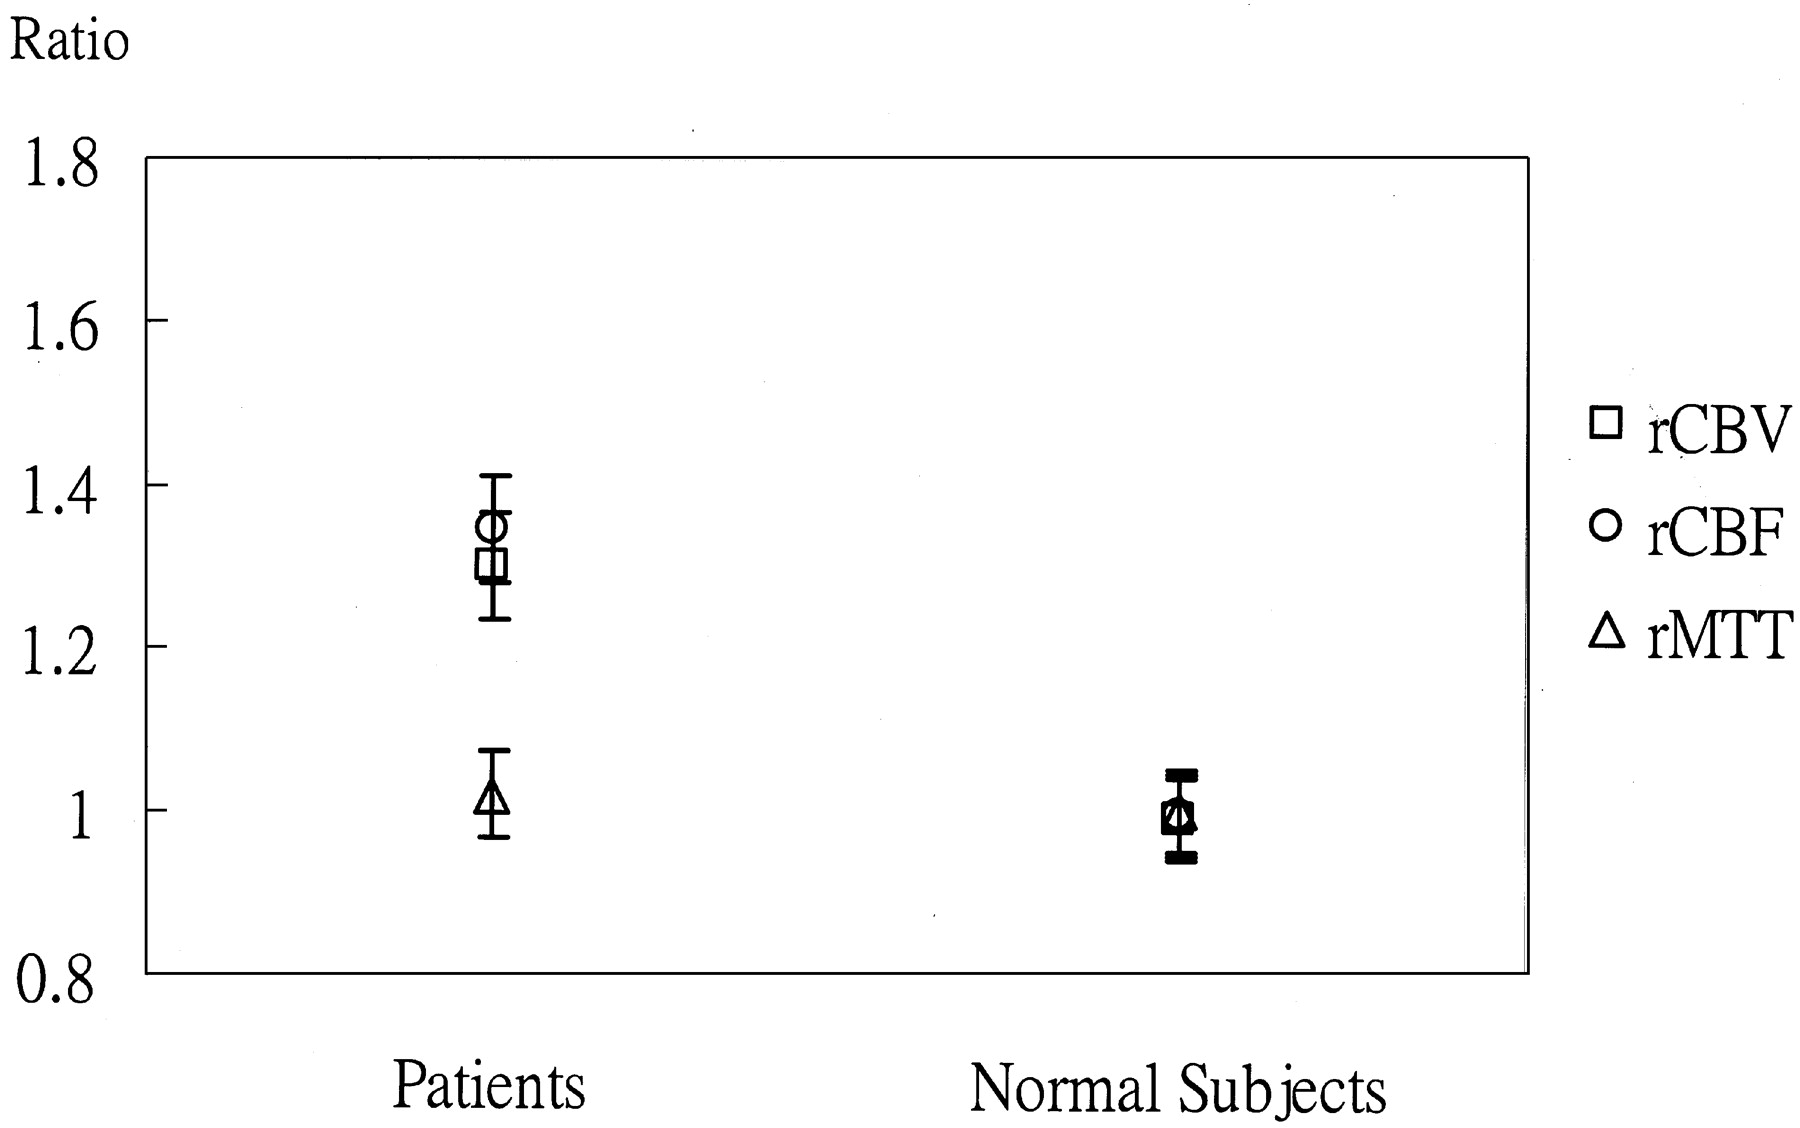
Plot shows comparison of H/H1 rCBV (□), rCBF (ˆ), rMTT (Δ) ratios between the composite data of five healthy subjects and 19 patients with AVM (data are the mean and 95% confidence interval). The H/H1 rCBV and rCBF ratios of the patients are significantly higher than those of the healthy subjects (P < .001 and P = .001, respectively). This indicates that the hemisphere with the lesion has higher flow and volume. For the H/H1 rMTT ratio, P = .270 (nonparametric Mann-Whitney U tests).
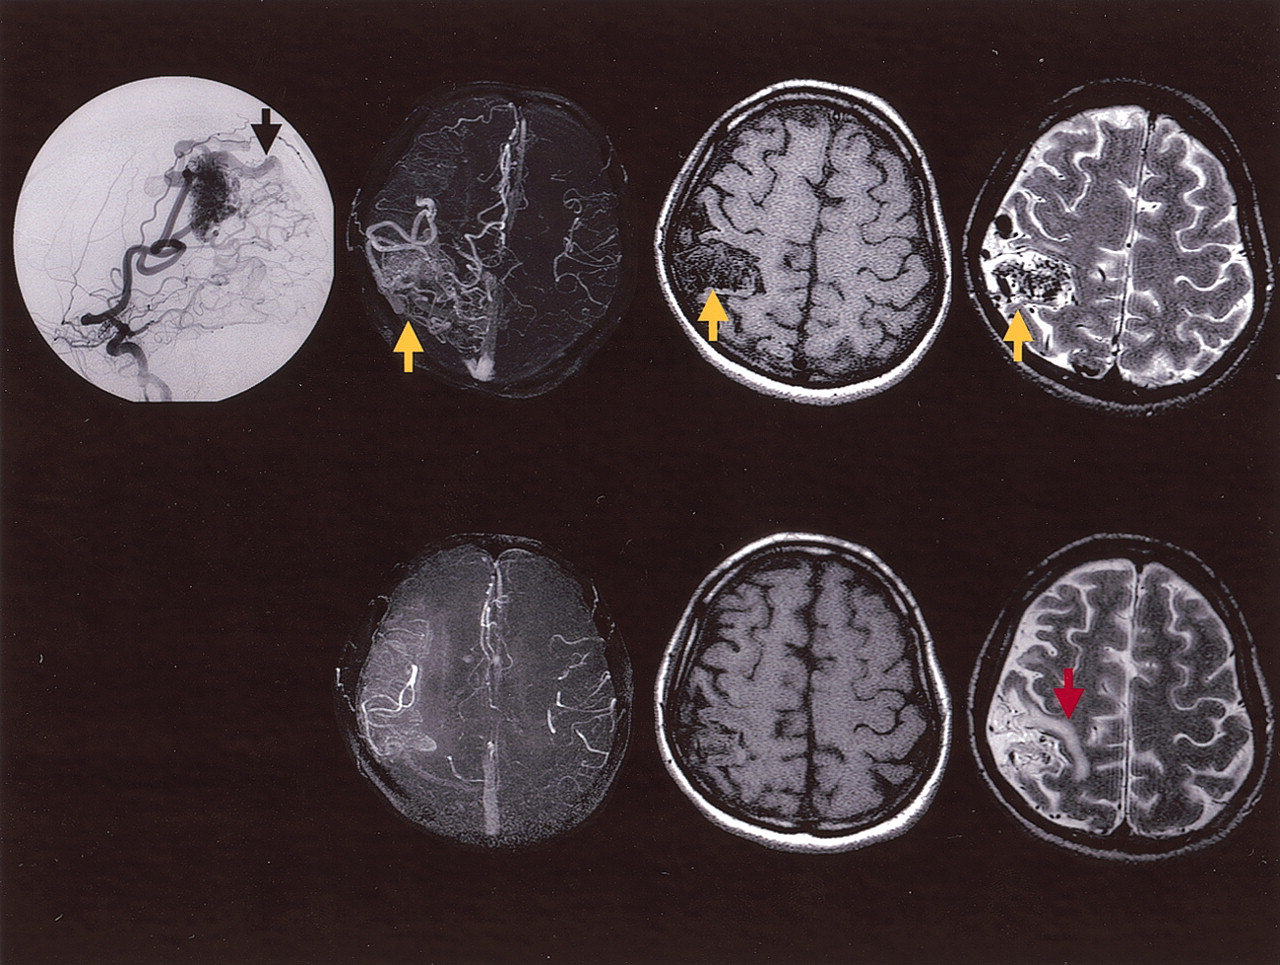
MR images in case 16.
Upper row (before radiosurgery), Lateral right carotid digital subtraction angiogram shows a parietal AVM with arteriovenous shunts and early venous drainage (black arrow); collapsed-view 3D time-of-flight MR angiogram and T1- and T2-wighted transaxial MR images show the AVM (yellow arrows).
Lower row (13 months after radiosurgery), MR images show the partially regressed AVM nidus and mild radiation-induced edema (red arrow).
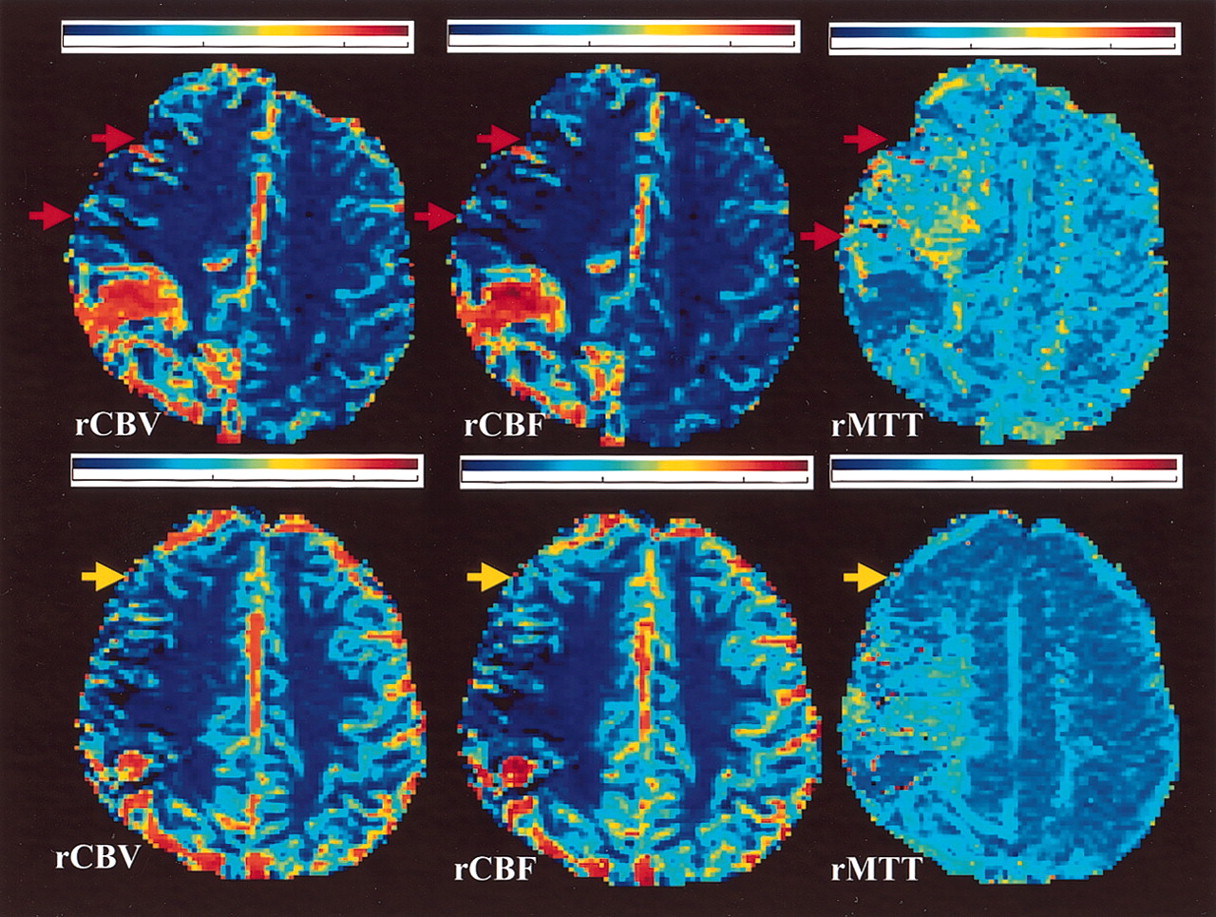
Perfusion maps in case 16.
Upper row (before radiosurgery), Perfusion maps show decrease in rCBV and rCBF in the immediate anterior and anterior remote areas and prolonged rMTT (red arrows), indicating type 3 perfusion disturbance.
Lower row (13 months after radiosurgery), Perfusion maps show improvement of perfusion toward normal, particularly in the anterior remote region (yellow arrow).
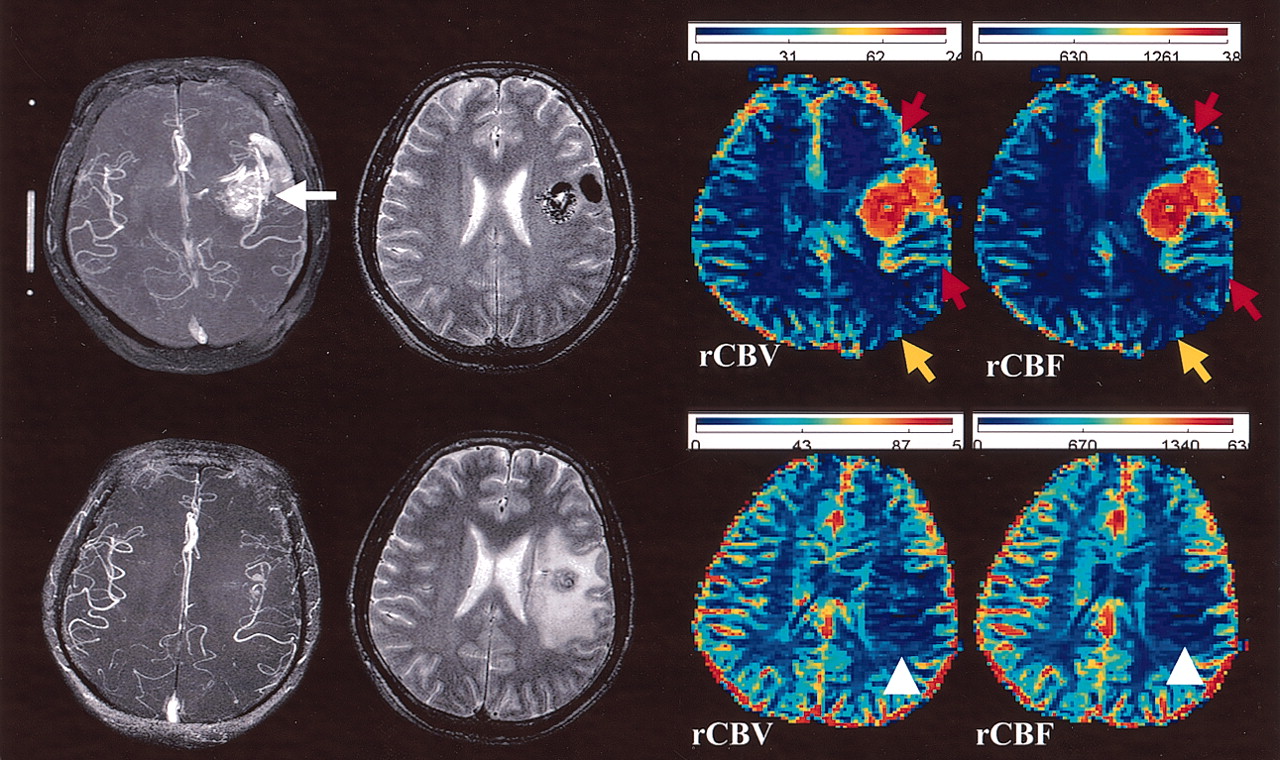
Composite images in case 3.
Upper row (before radiosurgery), Collapsed-view 3D time-of-flight MR angiogram shows a left temporal lobe AVM (white arrow). T2-weighted transaxial image shows the AVM. Perfusion maps show increased rCBV and rCBF in the immediate anterior and posterior areas (red arrows), and decreased rCBV and rCBF in the posterior remote area (yellow arrow), indicating type 2 perfusion disturbance.
Lower row (24 months after radiosurgery), Collapsed-view 3D time-of-flight MR angiogram shows a small remnant of the AVM. T2-weighted transaxial image shows a moderate degree of radiation-induced edema. Perfusion maps show decreased rCBV and rCBF in the perinidal regions (arrowheads). They correspond to the regions with radiation-induced edema.
Radiosurgical Effects on Morphology and Hemodynamics of AVM
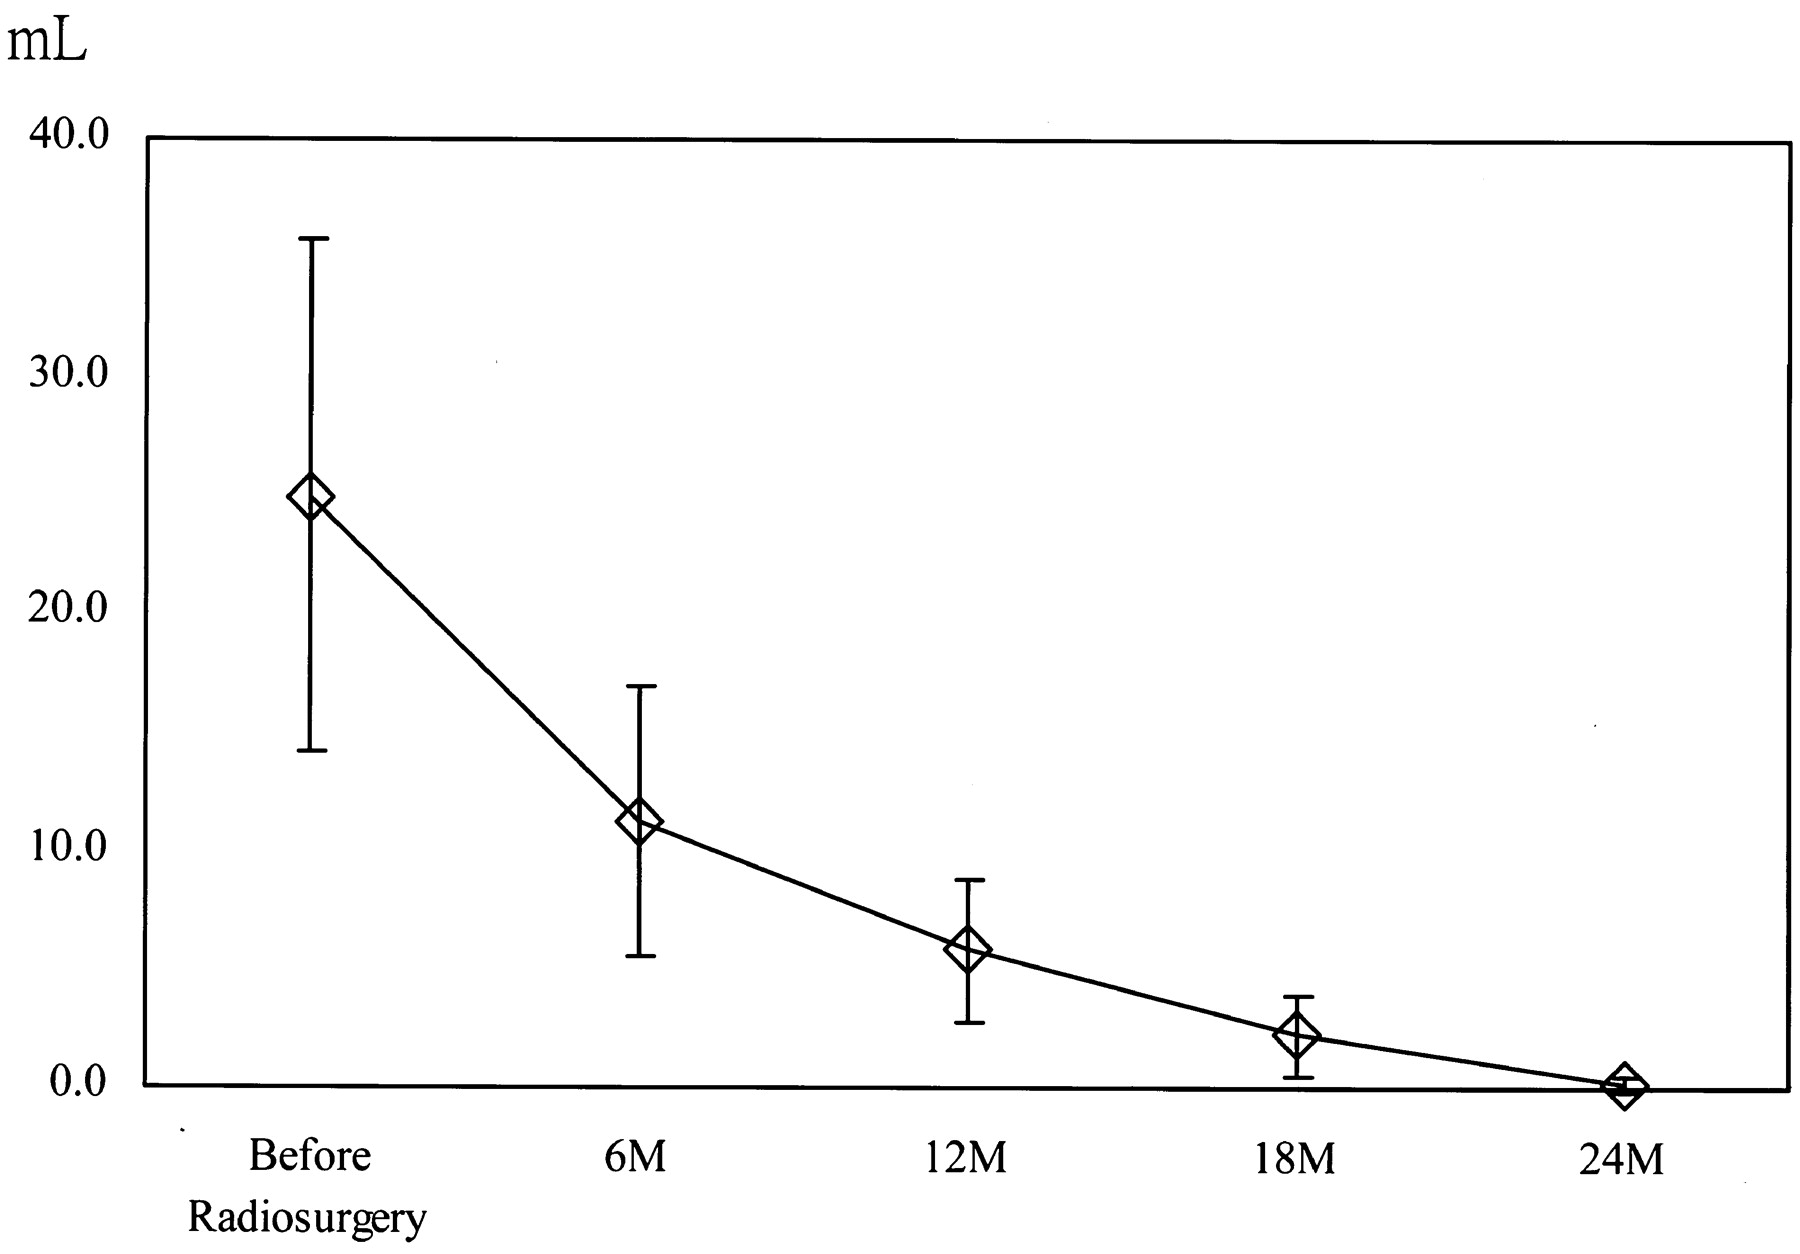
Morphologically, AVM nidal volumes were observed to be decreasing after radiosurgery (Fig 7). By the end of current study, no evidence of a remaining nidus was seen on MR images in two patients, a small remnant of the nidus with prominent draining veins was seen in four, and partial regression was seen in 13. Final conventional angiography had not yet been performed in the patients. Radiation-induced edema was noted in 15 patients (two severe, five moderate, and eight mild) at 12–24 months after radiosurgery (Table 1).

Plot shows composite AVM nidus volumes in the 19 patients before and every 6 months after radiosurgery. The volumes gradually regress after radiosurgery. Vertical axis indicates volume in mL defined on 3D time-of-flight MR angiograms (data are the mean and 1 SD).
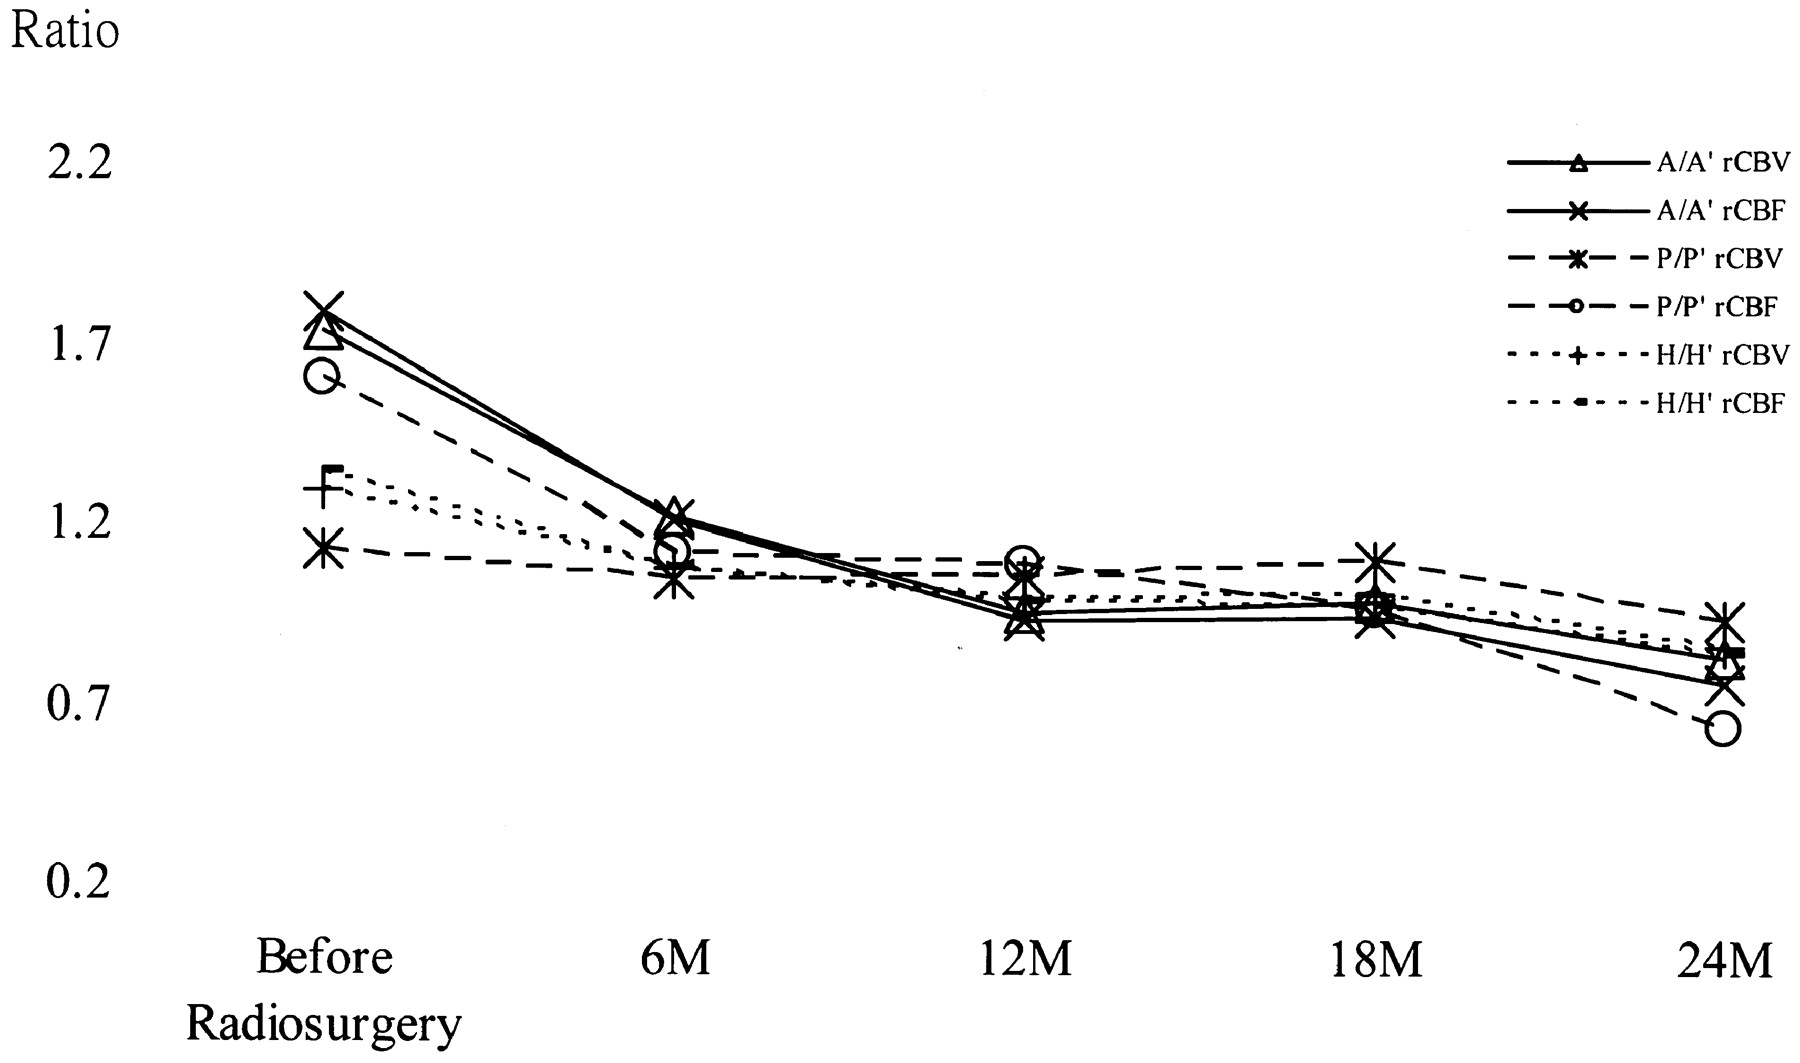
Hemodynamically, radiosurgical effects on AVM were manifested as follows: significant reduction in N/N1 rCBV and rCBF ratios (both P < .001) and elevation of N/N1 rMTT ratios (P < .015, Fig 8); gradual reduction of rCBV and rCBF ratios and elevation of rMTT ratios in the perinidal regions to 1.0 from the first 6 months after radiosurgery. The postradiosurgical A/A1, H/H1, and P/P1 rCBV and rCBF ratios were significantly deviated from baseline values (all P < .005, Fig 9). They all indicated that the hemodynamics profile was toward a normal status after radiosurgery. All postradiosurgical parameter ratios at remote perinidal regions and all rMTT ratios in the AVM vicinity were not significantly deviated from the baseline values. Local deterioration of perinidal perfusion was observed in patients with moderate (n = 5) or severe (n = 2) radiation-induced edema (Fig 10).

Plot shows composite N/N1 parameter ratios (data are the mean and 1 SD) in the 19 patients with AVM before and every 6 months after radiosurgery. N/N1 rCBV and rCBF ratios significantly decrease (both P < .001) and N/N1 rMTT ratios significantly increase (P < .015) after radiosurgery (generalized linear models with the generalized estimating equations method).

Plot shows composite A/A1, P/P1 and H/H1 parameter ratios in the 19 patients with AVM before and every 6 months after radiosugery. Postradiosurgical A/A1, H/H1 and P/P1 rCBV and rCBF ratios are significantly deviated from baseline values (all P < .005, generalized linear models with the generalized estimating equations method).

Composite images in case 2.
Upper images (before radiosurgery), Collapsed-view 3D time-of-flight MR angiogram shows a left frontoparietal AVM (white arrow). A five-independent-component image shows the arteries component (AVM) and the other components. rCBV and rCBF maps show the abnormal transnidal flow and three steal types (1, 2, 3) in the same patient.
Lower images (24 months after radiosurgery), T2-weighted transaxial image shows no evidence of a remaining nidus; severe radiation-induced edema (yellow arrow) is present. The five-independent-component image shows regression of the arteries component. On rCBV and rCBF maps, no abnormal transnidal flow is seen. The perinidal regions show a decrease in rCBV and rCBF. The perfusion impairments are secondary to radiation-induced edema (red arrows).
Discussion
The effects of AVM radiosurgery in protecting patients from repeat bleeding, as the primary goal, and in the improvement of the patient’s neurologic condition form the clinical basis for this effective therapeutic strategy (22). The gain in neurologic function is believed to be multifactorial in nature, and it is plausible that elimination of vascular steal plays a role in the improvement, presuming that therapy does not add more destruction. In our prospective study, by using healthy subjects as the control, we quantitatively and significantly demonstrated the aberrant baseline brain perfusion of AVM and their improvement longitudinally toward a normal condition after radiosurgery. Clinically, the model of investigation of brain perfusion is applicable to other therapeutic strategies (e.g., embolization and microsurgery). The perfusion data obtained may also be used to identify areas for primary and prioritized irradiation or embolization if the AVM nidus is too large and needs multiple-session or multidisciplinary treatments (e.g., a combination of embolization and radiosurgery).
We used the least invasive therapeutic intervention (radiosurgery) and imaging technique (DSC-MR imaging) with ICA postprocessing to study AVM-relevant perfusion in vivo. Instead of measuring the perfusion in 3D, we chose the largest nidal section for measurement. The measurement was based on the assumption that the image section having the largest nidal diameter represented the most significant section for AVM hemodynamic alterations.
We defined the areas in the vicinity of the AVM nidus as the ROIs for perfusion measurement and their homologous ROIs in the contralateral hemisphere as the intrasubject control. To avoid data inconsistency, defining the ROIs and measuring perfusion were conducted retrospectively by the same neuroradiologist in a study period repeated within a short period of time.
Obviously, the ROIs contained mixtures of arteries, capillaries, veins, and intervening brain tissues and were inherited with partial volume effects. The measurements were the sum of all included tissue components instead of respective tissue types. Selection of arterial input function is another potential bias to the flow estimates in DSC-MR imaging (23). We used an in-plane arteries component as the arterial input function to best fit the perfusion mapping. We used group perfusion data of five healthy subjects as the normal reference, contralateral hemisphere as the internal reference, and preradiosurgical baseline perfusion as the longitudinal control. This was a reasonable alternative because DSC-MR imaging and ICA postprocessing provided merely semiquantitative data. The current report is based on the data we collected by the end of 2003, and we intend to follow this cohort of patients to the end point of treatment results and will include conventional angiographic documentation of the treatment results (24, 25). Although the sample of 19 patients is not enough to directly validate the clinical impact of steal, the therapeutic effects on the hemodynamics may be eventually correlated with the improvement of neurologic status after elimination of AVM. Toward that end, MR perfusion mapping can feasibly be added to routine MR protocols for pre- and posttreatment evaluation. We did not stereotactically relocate the target section in follow-up DSC-MR imaging. Yet, the prospective study design allowed us to select sections that were most alike for longitudinal comparison. We used five components of ICA imaging for perfusion analysis. The selection of five components was based mainly on the physiologic aspects of cerebral hemodynamics and previous results (9). In the current study, it was observed that the rMTT ratios were least sensitive compared with rCBV and rCBF ratios in demonstrating AVM perfusion. This is explained by the fact that rMTT is derived from rCBV and rCBF.
An AVM nidus contains low resistance and causes high-flow transnidal shunts and diversion of blood from surrounding brain tissues to the AVM. The diversion causes increased blood volume and blood flow in the vessels of the surrounding brain parenchyma, namely, the steal phenomenon. To overcome the hemodynamic changes, the perinidal vessels adapt themselves to the AVM-related regional hypotension by resetting the radii of feeding arteries and the arterial pressure (26). This is reflected on diagnostic angiograms on which we usually see engorged feeding and draining vessels of AVMs. The arteriolar dilatation is seemingly not to the extent of a maximum cerebrovascular resistance reduction (27). Nevertheless, there are different viewpoints concerning the clinical impact of this steal. Using transcranial Doppler ultrasonography of brain AVM, Mast et al (28) found no evidence of correlation between steal and focal neurologic deficits. Young et al (29) observed that the distributions of oxygen supply and nutritive capillary flow to the cortex surrounding brain AVMs were almost identical to that in normal cortex (i.e., no evidence of cerebral hypoperfusion was found in brain AVMs). Using a microspectrophotometer to study AVM relevant cortical oxygen saturation, Meyer et al (30) found that the reduction of cerebral perfusion pressure in brain-nutrifying branches of arterial feeding arteries did not cause lowered tissue oxygenation in most patients. Compensating mechanisms, therefore, counteract the reduced perfusion pressure. Arteriolar dilatation might be one of the mechanisms but seemingly not to the extent of a maximum cerebrovascular resistance reduction (27). An increased capillary density as a structural adaptation might be another plausible compensation (31). Reduced glucose and oxygen metabolism to minimize oxygen extraction in the perilesional brain tissue was found in studies with positron emission tomography (32, 33). It was hypothesized that erythrocytic capillary recruitment, as defined by Kuschinksy and Paulson (34), might also play an independent role for the adaptation. The clinically claimed steal phenomenon such as progressive focal neurologic deficits or impairment of higher cognitive functions might, also, be a consequence of neuronal deafferentation and diaschitic phenomena in distant or even contralateral regions of the brain.
In our current study, we found patients’ H/H1 rCBV and rCBF ratios were significantly higher than those of healthy subjects (i.e., the hemisphere with AVM contains higher flow and volume). The results supported the prevailing hypotheses that perinidal arteries become dilated to adapt to the low-resistance and high-flow transnidal shunts that occur in AVMs. These steal and adaptation mechanisms may result in different patterns of perfusion disturbance. We observed three types of perfusion disturbance (Fig 2). In type 1, flow and volume increase in both immediate and remote perinidal regions. In type 2, the immediate perinidal rCBV and rCBF ratios increased and the remote perinidal regions decreased. In type 3, rCBV and rCBF ratios of both immediate and remote perinidal regions decreased. These types of perfusion disturbance suggest that an AVM may steal blood from immediate surrounding and remote areas, from the contralateral hemisphere via communicating arteries, or even from the other branches of the carotid artery extracranially (35). Four AVMs involved more than one type of perfusion disturbance. This was similar to the so-called patchy hypoperfusion in brain tissue surrounding AVMs that was previously reported (36–38). Our study provided a noninvasive and in vivo model with high spatial and temporal contrast by employing DSC-MR imaging and ICA to demonstrate the increased focal rCBV and rCBF in AVMs. The results quantitatively support the prevailing hypotheses of reversible vascular adaptation to the low-resistance and high-flow transnidal shunts in AVMs. Radiation-induced edema after radiosurgery was found in 15 patients; it was severe in two, moderate in five, and mild in eight at 12–24 months after radiosurgery. After radiosurgery, abnormal high signal intensity in the adjacent areas on T2-weighted images is not uncommon in brain AVMs (39). They may contain gliotic or fibrotic scar and vasogenic edema (secondary to blood-brain barrier damage). Depending on severity, the signal intensity abnormality may confine locally around the AVM or extend to remote areas, which are outside the effective dose range. For patients with severe radiation-induced edema, the area of signal intensity abnormality at its peak is larger than the original prescribed irradiation target. The edema is usually reversible and regresses after the blood-brain barrier damage is repaired. The gliotic or fibrotic scar, however, remains unchanged even after the AVM is cured. Deterioration of perinidal perfusion was found in patients with moderate to severe radiation-induced edema (Figs 6 and 10). The edema might cause increased interstitial pressure and cause deterioration of local perfusion.
Conclusion
Initial high transnidal flow and perinidal steal were noninvasively and objectively demonstrated in brain AVM. Gradual reduction of transnidal flow toward normal perfusion was manifested beyond the first 6 months after radiosurgery. Clinically, the information may explain partly the pathophysiology of AVMs and the therapeutic effects on brain perfusion.
Footnotes
Supported by grants of the National Science Council (NSC-92–2314-B-075–060, NSC-91–2213-E-010–014), Ministry of Education (89BFA221401), and Taipei Veterans General Hospital (92–386), Taiwan.
Presented in part at the annual meeting of the Radiological Society of North America, Chicago, IL, 2003.
References
- Received February 27, 2004.
- Accepted after revision April 7, 2004.
- Copyright © American Society of Neuroradiology
In this issue


Jump to section
Related Articles
Cited By...
- Feasibility of Flat Panel Detector CT in Perfusion Assessment of Brain Arteriovenous Malformations: Initial Clinical Experience
- Evaluation of 4D Vascular Flow and Tissue Perfusion in Cerebral Arteriovenous Malformations: Influence of Spetzler-Martin Grade, Clinical Presentation, and AVM Risk Factors
- Angioarchitecture of Brain AVM Determines the Presentation with Seizures: Proposed Scoring System
- Territorial and Microvascular Perfusion Impairment in Brain Arteriovenous Malformations