
Abstract
BACKGROUND AND PURPOSE: Diffusion-weighted (DW) imaging is more sensitive for early ischemia than CT, and apparent diffusion coefficient (ADC) mapping permits quantification of the severity of cytotoxic edema. We examined the relationship between early CT findings, ischemic lesion volume on DW images, and edema subtype.
METHODS: Patients in whom early signs of ischemia were detected on baseline CT scans were scored CT positive. Baseline DW lesion volumes were compared between the CT-positive and CT-negative patients. In CT-positive patients, we outlined the CT-positive part of the DW lesion and transferred these regions of interest to the corresponding DW sections. The ADC values of the outlined CT-positive areas were then compared with the ADC values of the CT-negative areas within patients. Lesions with significantly increased T2 hyperintensity were excluded to correct for the effect of early vasogenic edema on ADC measurements.
RESULTS: Twenty-four patients with cerebral ischemia in whom both CT and DW imaging were performed within 8 hours of symptom onset were entered into the study. Patients with early CT signs of infarction (n = 12) had significantly larger DW lesion volumes than did patients without early CT abnormalities (mean volume, 62.8 versus 14.6 mL; P = . 002). In patients displaying early CT abnormalities, CT-positive regions of the DW lesion had lower relative ADC (rADC) values than did the CT-negative regions, when lesions with significant T2 hyperintensity were excluded (mean rADC, 0.65 versus 0.75; P = .037).
CONCLUSION: These findings support the hypothesis that early CT signs of infarction indicate more extensive and severe cerebral ischemia, as reflected by lower ADC.
CT findings of early abnormalities that represent the entire ischemic lesion or part of it can be observed in patients with acute stroke (1–5). CT findings of hypoattenuation are thought to represent an increase in the net water content of the involved brain parenchyma (6). This increase in water content could be related to cytotoxic edema, vasogenic edema, or both. In patients with stroke, extended early signs of infarction at CT are known to be associated with a more severe neurologic deficit on admission (7) and a worse prognosis (2, 3, 8). Furthermore, it has been reported that early CT signs of infarction are associated with larger subsequent infarct volumes (3), symptomatic and nonsymptomatic hemorrhagic transformation (9, 10), neurologic deterioration during the first hours of stroke (11), and fatal brain swelling (12). In the European Cooperative Acute Stroke Study (ECASS) I trial, patients displaying early CT hypoattenuation involving more than 33% of the middle cerebral artery (MCA) territory were observed to be at increased risk of hemorrhagic transformation when treated with recombinant tissue plasminogen activator (rt-PA) compared with those treated with placebo (1, 13).
Diffusion-weighted (DW) imaging assesses the mobility of water. Severe cerebral hypoperfusion causes a restriction in the diffusion capacity of water due to cytotoxic edema and leads to an increased signal intensity on DW images (14–18). Increased signal intensity is also observed when the blood-brain barrier is disrupted. These two situations can be differentiated by calculating the apparent diffusion coefficient (ADC), a quantitative assessment of the diffusion capacity of water. When predominant cytotoxic edema is present, ADC levels are lower; by contrast, when the blood-brain barrier is disrupted, vasogenic edema develops, raising the ADC. DW imaging is more sensitive in the detection of early ischemic changes than is CT or conventional T2-weighted MR imaging (17–20).
The purpose of our study was to determine the relationship between the presence of early CT hypoattenuation and changes on DW images and ADC parameters in acute stroke. We hypothesized that patients with early findings of CT hypoattenuation would have larger lesion volumes on DW images than would patients without early CT abnormalities. We also assessed whether areas of early CT hypoattenuation corresponded to areas with more severe cytotoxic edema.
Methods
Patients
Patients with acute ischemic stroke who were entered into the Stanford Stroke Center database between July 1996 and October 2000, and who initially presented with anterior circulation stroke symptoms, were eligible. Patients fulfilling the following criteria were eligible: 1) initial CT performed within 6 hours of symptom onset and 2) DW imaging performed within 8 hours of symptom onset. Patients were excluded if the interval between CT and DW imaging exceeded 4 hours or if findings on neurologic examination returned to normal before completion of all imaging procedures. Patients with evidence of hemorrhagic transformation on baseline CT scans were also excluded. Neurologic deficits on admission were assessed in all patients by using the National Institutes of Health Stroke Scale (NIHSS) (21).
Imaging
CT scans were obtained on a HiSpeed CT scanner (General Electric, Milwaukee, WI). Contiguous axial sections of 5 mm were acquired, producing between 25 and 30 images for each series.
MR imaging was performed with a 1.5-T GE Signa Magnet (acquisitions, 16 sections; section thickness, 2.5 mm; intersection gap, 5 mm). For each section, two diffusion weightings (b = 0; b = 849 mm2/s) were applied along the x, y, and z axes. Three DW images were averaged to yield an average isotropic DW image. Three ADC maps were calculated and subsequently averaged to yield a conventional trace ADC map. The b = 0 images were used as T2-weighted images. Data analysis was performed on a Sun Sparc workstation (Sun, Palo Alto, CA) by using MRVision software (MRVision, Menlo Park, CA).
Processing
Measurement of Initial DW Lesion Volume.—
The area of DW abnormality was outlined on the MR series by two observers (D.S. and V.T.). To calculate the total DW lesion volume for each patient, the areas of DW abnormality were summed and multiplied by section thickness (2.5 mm) and intersection gap (5 mm). The average of the two volume measurements was used as the volume of the ischemic lesion on baseline DW images.
Measurement of Region of Interest on DW Images.—
A semiautomated method was used to determine the extent of the ischemic lesion on DW images obtained in patients with early CT signs of ischemia on two representative sections of interest; one at the level of the basal ganglia and one just rostral to the basal ganglia (Figs 1 and 2). We first measured in arbitrary units the mean signal intensity of a rectangular reference region placed within contralateral nonischemic brain tissue opposite to the center of the ischemic lesion, carefully excluding volumes of CSF or basal ganglia tissue. All pixels within the affected hemisphere with increased signal intensity of more than 3 SD above mean signal intensity of this rectangular area were considered to represent ischemic brain tissue.
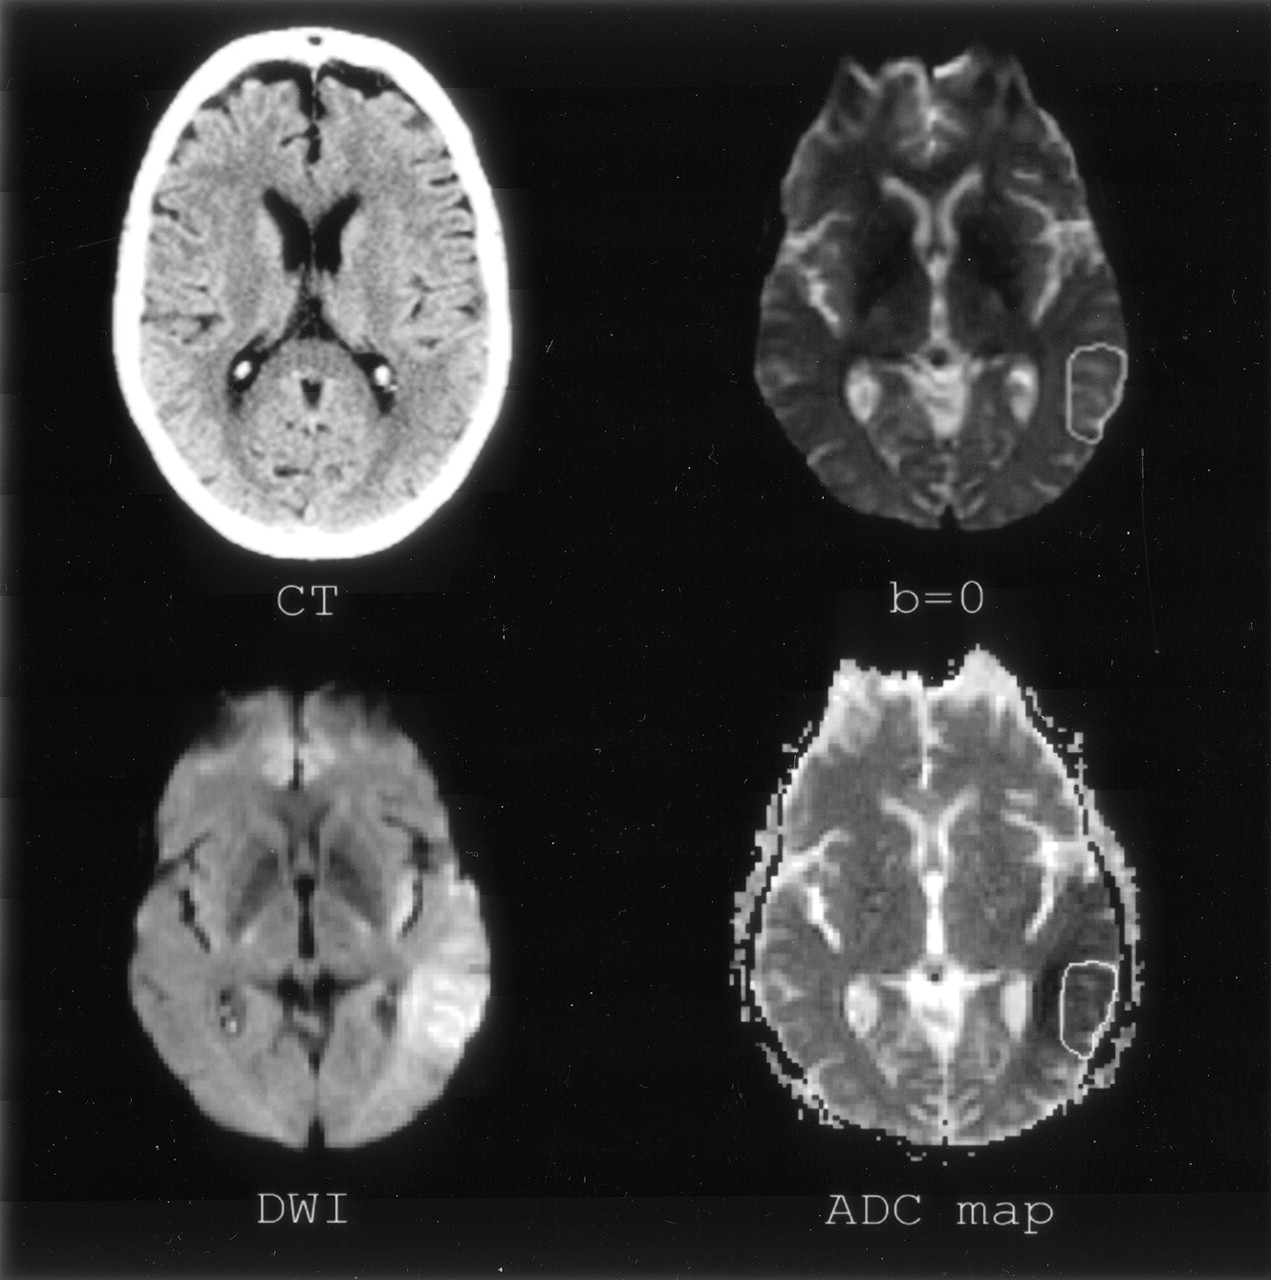
Section of interest 1, level of basal ganglia. Imaging of patient 4. Clockwise: CT, b = 0, DW images and ADC map. Tissue involved on CT scan has been outlined on the b = 0 image and transferred to the ADC map.

Section of interest 2, rostral to basal banglia. Imaging of clockwise: CT, b = 0, DW images, and ADC map.
Transfer of CT Abnormality to the DW Lesion.—
Two investigators, a stroke neurologist (D.T.) and a neuroradiologist (M.M.), evaluated the baseline CT scans obtained in all patients for the presence of early abnormalities indicating ischemia. During this CT evaluation, the observers were provided with a short clinical history, consisting of the age and sex of the patient, known remote ischemic events (transient ischemic attack and stroke), as well as the side of stroke symptoms. Consequently, the observers were asked to outline the area of early hypoattenuation at CT in a joint session. This area of early CT abnormality was then transferred from the CT scan to the corresponding brain region at MR imaging. To correct for the different planes through which the two imaging techniques were obtained, we asked the observers to outline which part of the ischemic DW lesion on the two sections of interest was involved at CT. To avoid the identification of areas with more severe hyperintensity on DW images as primarily involved at CT, we presented the observers with b = 0 images on which only the contour of the ischemic DW lesion was present. In this way, a region of interest was obtained, reflecting the ischemic area as abnormal on CT and DW images (DWCT+) as well as the part of the ischemic lesion that was normal on CT but abnormal on DW images (DWCT−).
ADC Measurements.—
The mean ADC was measured for the entire DW lesion, within the DWCT+ region and within the DWCT− region for each section and consequently divided by the mean ADC of a reference region within the nonischemic hemisphere to obtain relative ADC (rADC) values.
Measurement of T2-Weighted Ratio.—
We measured the mean signal intensity in arbitrary units of the ischemic DW lesion on images obtained without diffusion weighting (b = 0) and divided this signal intensity by the mean signal intensity obtained in the unaffected mirror region to obtain a T2 signal intensity ratio, thus assessing the lesion’s T2-weighted effect for the two sections of interest in every patient.
Statistics
We used the Student t test to detect imbalances in distribution of baseline characteristics between patient groups. rADC values of the CT-positive part of the DW lesion were compared with the CT-negative part in patients who displayed early signs of infarction on CT scans.
The Wilcoxon signed rank test for nonparametric analysis of data were used for this analysis. Statistics were performed at a 95% level of confidence.
Results
Thirty patients fulfilled the inclusion criteria. Four patients were excluded, because the interval between CT and MR imaging exceeded 4 hours. Two additional patients who had normal findings on neurologic examination before the end of imaging were also excluded, leaving 24 patients for analysis.
The mean age of these patients was 70.2 years. Fifty-four percent were female. The mean baseline NIHSS score was 14.0 (range, 4–40). Ten patients were treated with thrombolytics between the performance of CT and MR imaging.
DW hyperintensities were identified in 19/24 (79%) patients at the level of the basal ganglia and the thalamus and in 16/24 (67%) patients at the section level immediately rostral to the basal ganglia. The mean baseline DW lesion volume was 38.6 mL. Twelve of 24 patients had early abnormalities on their baseline CT scan as judged by both observers. Patients with early CT abnormalities (CT-positive group) did not differ significantly with respect to age or sex from the patients without early CT signs (CT-negative group). The baseline NIHSS scores were not significantly different between groups (mean NIHSS score of 12.5 in CT-positive patients versus 15.6 in CT-negative patients; P = .34).
In contrast, the baseline DW lesion volume was significantly larger in CT-positive patients than in CT-negative patients (mean 62.8 mL ± 46.2 vs 14.6 mL ± 14.9; P = .002). On average, CT-positive patients underwent CT 188.1 minutes after symptom onset, whereas CT-negative patients underwent CT 109.0 minutes after symptom onset (P = .009). The delay between initial CT and the first DW imaging session was significantly shorter in the CT-positive group (mean delay of 130.4 ± 50.9 minutes vs 182.4 ± 41.5 minutes; P = .012). All 12 CT-positive patients had a DW abnormality within one of the two sections of interest. Eight of twelve (75%) CT-negative patients had DW hyperintensity on either of the sections of interest. The mean rADC value of the ischemic area in these 20 patients on the two sections of interest was 0.75 ± 0.09.
Although the mean time between CT and MR imaging was significantly longer between the rt-PA (rt-PA+) versus non-rt-PA (rt-PA−) treated patients (190 ± 33 versus 132 ± 51 minutes; P = .005), there was no significant difference in rADC values between the two groups (rt-PA+ of 0.81 ± 0.08 versus rt-PA− of 0.73 ± 0.11; P = .10).
In the 12 patients with early CT hypoattenuation, the DW abnormality comprised both DWCT+ and DWCT− regions. The rADC values were not significantly different between DWCT+ areas and DWCT− areas (mean rADC 0.71 ± 0.18 in DWCT+ vs 0.74 ± 0.10 in DWCT−; P = .530) in these patients. The b = 0 intensity was slightly increased in regions of DW hyperintensity compared with the unaffected site (mean b = 0 ratio 1.08 ± 0.14). Four lesions had a significantly increased b = 0 ratio (>2 SD above the mean of the entire group). When we excluded the sections that exhibited lesions with a severely increased b = 0 ratio in the patients displaying early abnormalities at CT, a significant difference in rADC values was found in the remaining 10 patients between DWCT+ areas and DWCT− areas (mean rADC 0.65 ± 0.12 in DWCT+ versus 0.75 ± 0.10 in DWCT−; P = .037) within patients (Table). In these 10 patients, the delay from symptom onset to CT was on average 174.5 ± 67.4 minutes compared with 196.0 ± 97.0 minutes in patients with a significant increase of the b = 0 ratio (P = .705), and the mean interval from CT to MR was 138.7 ± 50.2 minutes versus 115.8 ± 59.7 minutes (P = .529). None of the four patients who displayed early T2 shine-through were treated with thrombolysis between performance of CT and MR imaging.
Patient characteristics, NIHSS on admission, imaging data, excluding lesions with significant T2 shine-through
Discussion
Using positron-emission tomography, Grond et al (22) reported larger volumes of critically hypoperfused tissue in the cerebral cortex of patients with early CT hypoattenuation compared with patients without early CT signs. Few studies have examined the correlation of early infarct signs on CT scans and findings on DW images and ADC maps. Kucinski et al (23) compared the mean ADC values on DW images and HU on CT scans between the affected and nonaffected hemisphere and reported a correlation between reduced ADC values and CT attenuation decrease in patients with acute stroke. In this study, we expanded on these observations by separately analyzing the CT-positive and CT-negative parts of the ischemic DW lesion to further investigate the underlying mechanism of significant CT hypoattenuation as measured by DW imaging and ADC values.
Hypoattenuation on CT scans in patients with stroke is believed to be caused by increased water content of the ischemic tissue (6), and it has been hypothesized that this hypoattenuation represents extended early cytotoxic edema in the first hours after the onset of stroke symptoms (24). Reversibility of early CT signs is rare (25, 26), although a false resolution of CT signs may result in transient isoattenuation of an infarct to surrounding brain tissue during evolution from the acute to the chronic state (27, 28). It is doubtful, however, that this had a significant effect on our results, because this usually occurs many hours to days after stroke onset.
The evolution of ADC and DW abnormalities in acute stroke has been extensively studied in animal models as well as in humans (29–32). Although the DW signal intensity remains hyperintense in the first few weeks after symptom onset, the ADC values change from low signal intensity (hypointensity) in the first few days to high signal intensity (hyperintensity) usually after 7–10 days. This has been hypothesized to reflect a gradual shift from extensive cytotoxic edema due to acute cellular energy failure or to vasogenic edema due to blood brain-barrier disruption resulting in a net fluid shift from the intracellular to the extracellular space. Accelerated blood brain- barrier disruption due to severe ischemia or thrombolytics could theoretically cause a more rapid transition from very low ADC values to pseudonormal or high ADC values (33).
In our final analysis, we excluded lesions with a predominant T2-weighted effect. T2-weighted MR hyperintensity in ischemic infarction is thought to represent vasogenic edema and may appear within hours after symptom onset in specific cases (34). Early vasogenic edema in stroke patients has been postulated to be due to early reperfusion of the ischemic area in tissue with a disrupted blood-brain barrier. Jaillard et al (35) describe a potential duality in the evolution of early CT lesions. They reported DW lesions significantly smaller than early CT abnormalities in 7/16 (43%) patients. They concluded that in these cases early CT hypoattenuation could identify reversible brain injury. We believe that this finding might be attributed to early fluid entrance into tissue at risk, consequently resulting in vasogenic edema, which would appear as hypoattenuation on CT but might have disappeared on follow-up DW images several hours later. The mean interval between CT and MR imaging of more than 5 hours in these seven patients could have enhanced this effect of vasogenic edema. In our study, we might be correcting for this confounding effect by excluding patients with marked T2-weighted effects.
We hypothesized that ischemic infarction visible on early CT scans represents regions of impaired diffusion and therefore displays lower ADC values than do regions of infarction not represented by early hypoattenuation or mass effect on CT scans. Because DW lesions have been reported to be reversible in specific cases (36), whereas CT lesions have been found to be irreversible in most cases (2), ischemic tissue not visible on early CT scans is more likely to be rescued by acute aggressive treatment. Indeed, we found early CT abnormalities to represent areas of significantly lower ADC values on DW images compared with DW abnormalities not visible on CT scans in specific patients. In addition, we found that positive CT scans are correlated with larger lesion size on DW images. These findings support the hypothesis that early CT signs of infarction indicate more severe cerebral ischemia, which is less likely to respond to therapy. Furthermore, ischemic regions with lower ADC values have been reported to be at greater risk of hemorrhagic transformation, one of the most feared complications of thrombolytic treatment (37).
The main limitations of our study were its small sample size and the absence of coregistration of CT and MR imaging. There was also a relatively long delay between performance of CT and MR imaging. Therefore, the pathophysiologic state of the tissue imaged might have been different at the two time points. In addition, several patients were treated with thrombolytics between the CT and MR imaging, thus increasing chances that early reperfusion might have taken place during this period. This could explain our inability to detect a relationship between low ADC values and CT hypoattenuation in the entire cohort.
Further research will need to focus on the correlation between the specific values of DW imaging and perfusion-weighted imaging associated with early CT findings. Ideally, a voxel-by-voxel analysis after spatial coregistration of the imaging modalities should be performed. This could potentially generate data on the thresholds of ADC reduction associated with CT-detected hypoattenuation. The current data, however, suggest that CT-detected hypoattenuation identifies only a portion of the most severely affected brain tissue in acute infarction and implies that DW imaging will be necessary to best appreciate the extent and severity of cerebral ischemia in patients with acute stroke. Whether newer CT techniques such as CT perfusion will further aid in the differentiation of reversibly versus irreversibly affected tissue remains to be seen and will require further careful investigation.
Conclusion
Consistent with our hypothesis, we found that patients with acute ischemic stroke who display early CT abnormalities have larger initial DW lesion volumes than do patients without early ischemic signs on CT; however, contrary to our expectations, areas of the ischemic DW lesion volumes seen on CT scans did not possess lower ADC values than areas of ischemic tissue on DW images that were not abnormal on CT scans. Nevertheless, after excluding lesions that exhibited significant vasogenic edema as detected by increased signal intensity on T2-weighted MR images, significantly lower ADC values were identified.
Acknowledgments
We thank Stephanie Kemp, for her help in retrieving essential patient data, and Dr. Michael Moseley, for his advice on the methods used in our study.
Footnotes
Data from this report presented at the 27th International Stroke Conference, San Antonio, Texas, February 7–9, 2002.
References
- Received October 9, 2003.
- Accepted after revision November 24, 2003.
- Copyright © American Society of Neuroradiology
In this issue


Jump to section
Related Articles
Cited By...
- Diffusion-Weighted Magnetic Resonance Imaging May Underestimate Acute Ischemic Lesions: Cautions on Neglecting a Computed Tomography-Diffusion-Weighted Imaging Discrepancy
- Persistent Diffusion-Restricted Lesions in Bevacizumab-Treated Malignant Gliomas Are Associated with Improved Survival Compared with Matched Controls