
Abstract
BACKGROUND AND PURPOSE: Our purpose was to evaluate the effect of fixative on apparent diffusion coefficient (ADC) values and anisotropy within spinal cord white matter. As glutaraldehyde (GL) better preserves axonal ultrastructure as compared with paraformaldehyde (PF), we hypothesize that spinal cord white matter fixed with GL will have increased anisotropic water diffusion as compared with specimens fixed with PF.
METHODS: Eleven rats were perfusion-fixed with either 4% PF or a combination of 2.5% GL and 4% PF. Diffusion-weighted imaging of the ex vivo spinal cord was performed using a 9.4T magnet with b values up to 3100 s/mm2. In-plane resolution was 39 μm × 39 μm, and section thickness was 500 μm.
RESULTS: Overall, animals fixed with a combination of GL and PF (GL-PF) showed a greater increase in longitudinal ADC (lADC) as compared to those fixed with PF only, without differences in transverse ADC (tADC). As a consequence of the increased lADC, overall anisotropic diffusion increased in those animals fixed with GL-PF, as measured with an anisotropy index (AI = tADC/lADC). Evaluation of specific tracts demonstrated that lADC for animals fixed with GL-PF were significantly elevated in the rubrospinal, vestibulospinal, and reticulospinal tracts as compared with animals fixed with PF only.
CONCLUSION: Using a fixative of GL-PL results in increased anisotropy (decreased AI values) in spinal cord white matter tracts, as compared with PF fixation only, largely owing to increases in the lADC values. This finding may be due to better fixation of intra-axonal cytoskeletal proteins that results when GL is combined with PF and sheds further light on underlying sources of anisotropic water diffusion in CNS white matter.
MR imaging of excised, fixed tissue allows for higher spatial resolution than that of in vivo imaging, as there are no time constraints and the small size of specimens allows for the use of higher-field-strength magnets. Since studies of fixed tissue have been found to be valuable in elucidating the source of diffusion changes in the spinal cord following trauma and repair (1–5), we were interested in whether the choice of fixative influences diffusion coefficients. Paraformaldehyde (PF) and glutaraldehyde (GL) have traditionally been used in CNS tissue fixation. The choice of one aldehyde over the other is largely based upon subsequent histologic evaluation, as the chemical properties of the two fixatives interact differently with the tissue. Fixatives with GL are often employed for electron microscopic studies because of superior preservation of cellular ultrastructure as compared with PF. GL, however, may mask antigens, limiting usefulness for immunohistochemistry, in which case PF is chosen as the optimal fixative (6). At physiological pH, a fixative containing GL and PF is considered the best method of preserving cellular ultrastructure (6–11), including the myelin sheath and axonal cytoskeletal structures such as neurofilaments (12,13). Perfusion fixation with PF only at physiological pH results in significant splitting of the myelin sheath and poor preservation of neurofilaments and other cellular structures (14). By comparing ADC values in the white matter of normal spinal cord specimens perfusion-fixed at physiological pH with either GL combined with PF or PF only, we could correlate the fixative effects with directional diffusivity and anisotropic water diffusion. We hypothesize that better preservation of the myelin sheath and axonal cytoskeleton seen with GL and PF fixation will result in increased diffusional anisotropy as compared with specimens fixed with PF only.
Methods
Subjects
Eleven normal female Sprague-Dawley rats (Taconic, Germantown, NY) were studied. All animals were anesthetized with an intraperitoneal injection of sodium pentobarbital (100 mg/kg; Abbott Laboratories, North Chicago, IL) and perfused through the heart with 200 mL of normal saline followed by either 500 mL of ice-cold 4% PF (n = 5) or 2.5% GL and 4.0% PF (n = 6) in 0.1 mol/L phosphate buffer, at pH 7.4, which is the physiological pH for most animal tissues (8). Following fixation, the entire spinal cord was excised and post-fixed for at least 2 weeks in an identical solution to that in which it was originally fixed. The spinal cord was then cut at the cervico-medullary junction and cervico-thoracic junction to isolate the cervical spinal cord.
Diffusion-Weighted Imaging
Excised cervical spinal cord specimens were placed in a 5-mm coil, centered at C3-C4, and immersed in 0.1 mol/L phosphate buffer. Coils were then placed on a 9.4T magnet (AM-400; Bruker Medical, Ettlingen, Germany) and a spin-echo diffusion-weighted (DW) sequence (15) was applied with five separate b values in both the phase (transverse) and section (longitudinal) axes. The following parameters were used for the GL-PF and PF-only groups: number of sections, 20; section thickness, 0.5 mm; total coverage, 10 mm; FOV, 5 mm; matrix, 128 × 128; in-plane pixel size, 39 μm; imaging time, 85 minutes per diffusion direction. For the PF-only group, the following parameters were used: TR = 2000 ms; TE = 32 ms; Δ = 20ms; δ = 6ms; NEX = 4; longitudinal b values (s/mm2) = 217, 356, 733, 1341, 2180; and transverse b values (s/mm2) = 240, 587, 1193, 2031, 3100. For the GL-PF group, the following parameters were used: TR = 2000 ms; TE = 23ms; Δ = 15ms; δ = 3ms; NEX = 4; longitudinal b values (s/mm2) = 156, 273, 572, 1050, 1710; and transverse b values (s/mm2) = 165, 438, 903, 1547, 2372.
Transverse and longitudinal ADC maps were created in IDL (Research Systems Inc., Boulder, CO) by using the absolute value of the slope of the line defined by ln(ROI/ROIb = 0) plotted against the b values (ROI signifies region of interest).
Region-of-Interest Selection
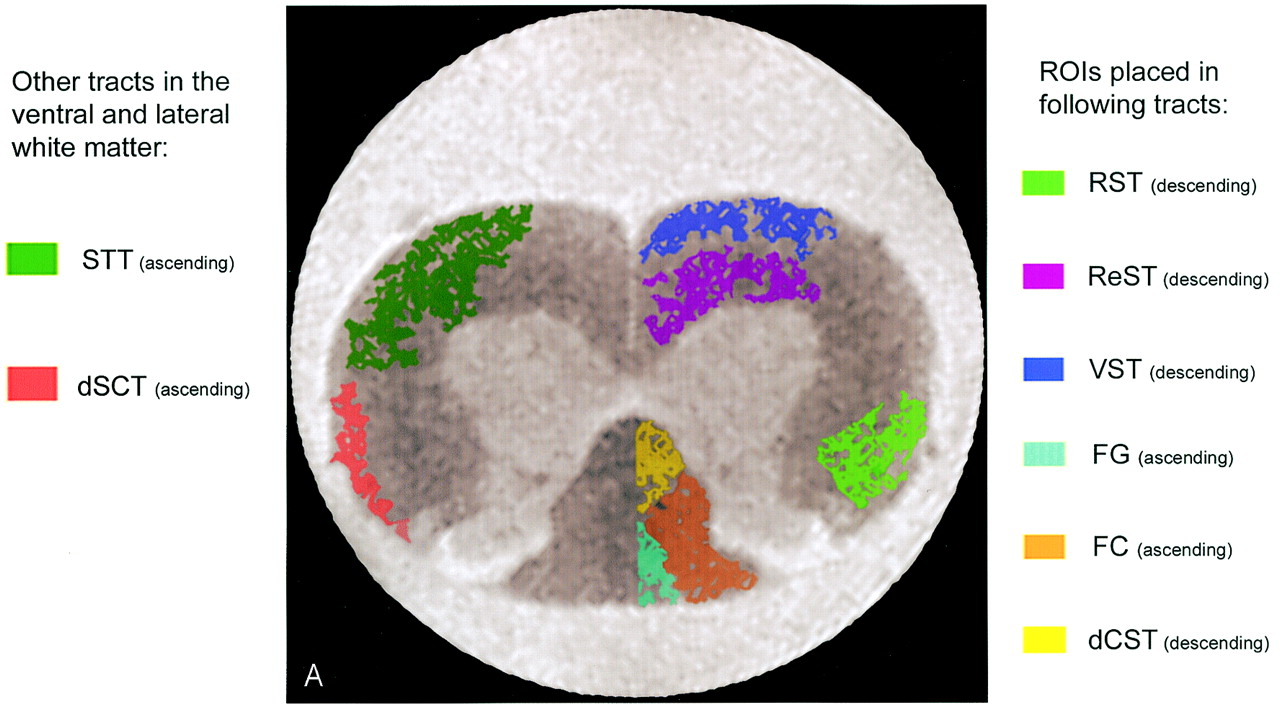
For each of the normal animals, two consecutive T2-weighted images (b = 0 images) were selected for region-of-interest analysis according to the morphology of the cervical cord. A specific degree of protuberance of lamina IV at the midcervical level was used as a landmark so that the selected images appeared as similar as possible, ensuring a consistent location for analysis between animals. Regions of interest were then drawn on the T2-weighted images corresponding to the dorsal cortical spinal tract (dCST), fasciculus gracilis (FG), fasciculus cuneatus (FC), rubrospinal tract (RST), vestibulospinal tract (VST), and reticulospinal tract (ReST) (Fig 1A) on the basis of current knowledge of rat cervical spinal cytoarchitecture (16–19). On the selected images, regions of interest for each of the six tracts were drawn bilaterally for a total of 12 regions per image. For each animal, the values for two consecutive sections were then averaged. Care was taken not to include any pixels from surrounding buffer. In addition to calculating tADC and lADC values for each tract, the anisotropy index (AI), which is defined as tADC/lADC, was computed. These values from all the tracts were averaged to obtain an overall tADC, lADC, and AI in the white matter for each fixative (Table 1).

MR image and corresponding histologic sections from normal rat spinal cord. A, Schematic diagram of major ascending and descending tracts in the rat spinal cord overlaid on a b = 0 (T2-weighted) image of a rat spinal cord. Regions of interest were drawn in the following tracts: rubrospinal tract (RST), reticulospinal tract (ReST), vestibulospinal (VST), fasciculus gracilis (FG), fascisulus cuneatus (FC), and dorsal corticospinal tract (dCST). While the dorsal white matter tracts are homogeneous, the ventral and lateral tracts are mixed with other fibers from the STT-spinothalamic tract and dSCT-dorsal spinocerebellar tract. A significant difference between the human and rat spinal cord is the location of the corticospinal tract. In the human, the corticospinal tract is located in the lateral white matter, while in the rat it is located in the dorsal white matter.

B–G, 1-μm-thick histologic sections at 40×, stained with toluidine blue of the RST (B), ReST (C), VST (D), FG (E), FC (F), and dCST (G), respectively (black bar = 50 μ). Note that the largest axons appear to be within the VST.
Overall transverse ADC, longitudinal ADC and anisotropy indices for PF and GL-PF specimens
To correct for temperature differences, an additional region of interest was placed in the surrounding buffer; the ADC values of the regions of interest from each section were then multiplied by the ratio of the known ADC of water at 20°C (2.04 × 10⁻³ mm2/s) to ADC(buffer). Additionally, by using histogram analysis, pixels with ADC values less than zero were excluded as noise.
Histologic Preparation
After DW imaging was performed, the spinal cords from GL-PF fixation (n = 6) underwent preparation for 1-μm sectioning. A slit was first cut in the ventral left white matter for orientation and a 15-mm segment of the cervical spinal cord was then sectioned on a vibratome into 300-μm transverse sections. The 300-μm sections were washed in 0.1 mol/L Phosphate buffer followed by post-fixation with 2% osmium tetroxide. The tissue then underwent five rounds of 5-minute washes in cold maleate buffer after which tissue specimens were stained en bloc in 1% Uranyl acetate (aqueous) for 30 minutes at 4°C. The tissue was then dehydrated through a series of cold graded washes in ethyl alcohol from 50–100%, during which time the specimens were brought to room temperature. After dehydration, the infiltration process began with two 20-minute washes in 100% propylene oxide followed by infiltrations in a 50:50 mixture of propylene oxide–epon. The tissue was then immersed in 100% epon for 20 minutes at which time the epon was refreshed and the tissue was placed in a 60°C oven for 20 minutes. The sections were then embedded between two lubricated slides (release agent Dry Lubricant MS-122 manufactured by Miller-Stephenson Co., Danbury, CT) and placed in the oven at 60°C for 72 hours. After 72 hours, the embedded sections were mounted on epon plugs and cut on a microtome into 1-μm sections. The 1-μm sections were stained with toluidine blue and cover-slipped for histologic evaluation.
Testing of Mono-Exponential Fit
Because larger b values were used for PF specimens than for GL-PF specimens, we tested the mono-exponential fit of the diffusion data. This testing is performed as bi-exponential diffusion that comprises a slow and fast diffusing component and has been demonstrated in neural tissue, although generally by using b values greater than those in this study (range, 4000–10,000 s/mm2) (20–23). Elshafiey et al (24), however, reported bi-exponential diffusion in the rat spinal cord in vivo and suggested that bi-exponential diffusion may be seen with b values as low as 1600 s/mm2. In our study, this property could result in artifactually low ADC values that are worse in PF-only specimens imaged with larger b values. Regions of interest were drawn in the white matter, as described above, and we obtained signal intensities from each DW image (OSIRIS Medical Imaging Software; OSIRIS, Geneva, Switzerland), and then performed linear regression (JMPIN; SAS Institute Inc., Cary, NC), fitting ln (ROI/ROIb = 0) versus b values. We saw evidence for a robust linear fit in measurements of tADC and lADC, in both PF-only and GL-PF fixed specimens, with R2>0.99. Since under these conditions we find no evidence of a slow diffusing component, we conclude that our comparison between PF-only and GL-PF fixed specimens by using a mono-exponential fit is valid despite differences in b values, as our DW imaging data appear to primarily arise from the fast diffusion component. While a slow diffusing component may be identified with much larger b values, it has no effect on our ADC measurements.
Statistical Analysis
A Student t test was run for each animal to determine if there were left-right differences with P < .05 as the level of significance. ANOVA was used to evaluate 1) overall differences between the tADC, lADC, and AI between fixative types, and 2) differences between tracts for each fixative type. For evaluation of differences between tracts, if ANOVA was significant (P < .05), post hoc analysis was performed with t tests by using significance level adjusted with Bonferroni correction for multiple comparisons. Statistical analysis was performed with JMPIN (SAS Institute Inc).
Results
Analysis of Left-Right Differences
No differences in tADC, lADC, or AI were seen in any animal between the left and right sides of the spinal cord. This finding indicates that we can average the left and right ADC values, thus resulting in six measurements (one per spinal cord tract) per animal. This finding also suggests that there are no significant distortions in the images across the specimen that would adversely affect our ADC values.
Overall ADC Values
lADC values in GL-PF spinal cords were greater than those in spinal cords fixed with PF only, indicating increased water diffusion along the long axis of the spinal cord white matter. No difference was seen in tADC values. The spinal cords fixed with GL-PF also showed decreased AI values, indicating increased anisotropic water diffusion, as compared with spinal cords fixed with PF only. These findings are summarized in Table 1 and suggest that differences in anisotropic water diffusion are primarily owing to differences in longitudinal water diffusion as opposed to differences in transverse water diffusion.
Post hoc testing for each individual tract, with the significance level adjusted for multiple comparisons (findings significant if P < .0083, which is derived by dividing .05 by the six comparisons performed), showed significant elevation of lADC values in the VST, RST, and ReST of GL-PF specimens as compared with PF specimens, but no significant differences for AI values (Table 2). As the ANOVA was not significant for tADC values, post hoc testing was not performed; however, tADC values for each tract are listed in Table 2.
Comparison of longitudinal and transverse ADCs and anisotropy indices among spinal cord tracts in PF and GL-PF specimens
Analysis of Tract Differences
Additionally, we evaluated differences in ADC values between specific spinal cord tracts within each fixative group. As many of these tracts are homogeneous, this comparison provides an opportunity to evaluate differences in ADC values that occur with changes in axonal size and density (refer to Table 2 for the ADC and AI values for each tract). For both the PF and GL-PF groups, ANOVA demonstrated significant differences (P < .05) among tracts for tADC and lADC. For AI, ANOVA showed significant differences between tracts in the PF group but not in the GL-PF group. Post hoc testing was then performed with significance level adjusted for multiple comparisons (P < [.05/15] = .0033). Significant results are summarized as follows. For the GL-PF group: tADC, VST > RST and dCST; lADC, VST > ReST and dCST; AI, ANOVA, not significant (no post hoc testing was performed). For the PF group: tADC, VST > all other tracts (FG, FC, dCST, ReST and RST); lADC, VST and FG > ReST; AI, VST > FG and dCST.
These results show that the VST, which contains the largest-diameter axons (Figs 1B–G), has greater ADC values in both the transverse and longitudinal directions as compared with other tracts. As there is also decreased anisotropic water diffusion (elevated AI) in the VST, it appears that the elevation in tADC is proportionally greater than the elevation in lADC as compared with other tracts.
Discussion
CNS white matter demonstrates anisotropic water diffusion when evaluated with DW imaging (2, 3, 25). It has been proposed that anisotropic water diffusion in white matter tracts results from myelin sheaths and axonal cellular membranes functioning as barriers to water diffusion in the transverse direction (perpendicular to the long axis of the axon), while allowing relatively unrestricted diffusion in the longitudinal direction (parallel to the long axis of the axon). Alterations in axonal membrane and myelin integrity would therefore be expected to decrease anisotropic water diffusion. Reduced anisotropic water diffusion within white matter following trauma (1, 4, 5, 26–28) or demyelination (29, 30) has been demonstrated both clinically and experimentally, and it has been proposed that measures of anisotropy may be helpful in evaluating the severity (or extent) of white matter injury. However, measurements of anisotropic water diffusion are based on individual directional diffusivities and may be affected by changes in either or both of the directional diffusivities that are measured. There is evidence that each directional diffusivity may reflect a distinct pathologic process, and thus, it may be more helpful to evaluate the individual water diffusivities, as opposed to a general measure of anisotropic water diffusion.
Myelin Sheath Preservation and Transverse Water Diffusion
Evaluations of water diffusivity in the spinal cords of mice with genetic myelin deficiencies have shown that the absence of a myelin sheath increases transverse water diffusion in white matter tracts as compared with transverse diffusion in the axons of normally myelinated mice, but not to such an extent as to eliminate anisotropic water diffusion (31, 32). The preservation of anisotropic diffusion confirms that myelination is not necessary for anisotropic water diffusion in white matter (33). On the basis of these findings, one may expect lower tADC values in animals fixed with GL-PF, assuming that stronger fixation of the myelin sheath results in a more restrictive barrier to transverse water diffusion. Our findings, however, indicate that better preservation of myelin with GL-PF fixation does not affect tADC values. One explanation for our findings is provided by Takahashi et al (34), who noted that increasing myelination in developing nerves did not result in increased tADC values and suggested that increasing myelination past a certain point did not increase restricted diffusion with the MR imaging parameters they used. Although fixation with PF at physiological pH results in greater splitting of the myelin sheath than that of fixation with GL-PF (14), tADC values may not change significantly without actual loss of myelin.
In our comparison of individual spinal cord tracts, we found that the VST had greater tADC values than that of the other tracts. Although the etiology of this difference is unknown, Takahashi et al (33) reported increased tADC values in spinal cord tracts with larger axons, and they suggest that increased axonal diameter and decreased axonal density may play a role in increasing tADC.
Longitudinal Water Diffusion in Axons
The superior preservation of intra-axonal cytoskeletal structures in specimens fixed with GL-PF, as compared with PF only, may explain the differences in ADC values seen in our study, as intra-axonal water diffusion could be dependent on structural integrity of neurofilaments and microtubules. Beaulieu and Allen (35) evaluated intra-axonal ADC values in the giant axon of the squid and demonstrated isotropic water diffusion, a finding confirmed by Takahashi et al (33) in the larval lamprey. Therefore, the longitudinal orientation of the neurofilaments and microtubules does not appear to be responsible for anisotropic water diffusion (35). Beaulieu and Allen (36) also studied anisotropic water diffusion in garfish nerves following the application of vinblastine, which acts to depolymerize microtubules. The administration of vinblastine for 48 hours decreased longitudinal water diffusion within the nerves, but anisotropic water diffusion was preserved. In addition, these authors observed a reduction in longitudinal ADC values in degenerated nerves in vitro. These findings suggest that the breakdown of axoplasmic structures results in decreased water diffusivity. Our findings support this hypothesis, because the PF specimens, with greater breakdown of axoplasmic structures, had lower lADC values than those of GL-PF specimens. Beaulieu and Allen also noted a decrease in transverse water diffusivity in those nerves treated with vinblastine. We also noted a decrease in tADC values in those spinal cords fixed with PF only, perhaps suggesting that the integrity of cytoskeletal proteins may play a role in transverse water diffusion; however, the difference was minimal and not statistically significant.
The density, as well as the integrity, of cytoskeletal proteins may affect longitudinal water diffusion. Kinoshita et al (37) evaluated anisotropic water diffusion in the optic nerve of rats following methylmercury administration, which decreases the overall density of microtubules and neurofilaments within axons, without affecting the myelin sheath. They demonstrated increased longitudinal water diffusion in the injured optic nerves and inferred that the presence of neurofilaments and microtubules restricts longitudinal water diffusion. Their findings may partially explain our results that show increased lADC values in the VST, which contains larger axons as compared with the dCST and ReST. Larger axons have more neurofilaments; however, the interfilament spacing increases and a lower density of neurofilaments results (38, 39). Additionally, microtubules have been shown to decrease in density in larger axons (40, 41). Thus, it may be the decreased density of cytoskeletal proteins seen in larger axons that explains the increased lADC values within the VST.
Studies in rodents with genetic myelin deficiencies have produced somewhat discordant results concerning longitudinal water diffusion. Decreased longitudinal water diffusion was seen in nerves of the twitcher mouse, which is a model of Krabbe disease where demyelination and degeneration of axons are observed (42). The authors suggest that waviness of the demyelinated axons may result in decreased longitudinal water diffusion; however, axonal degeneration and subsequent disorganization of cytoskeletal proteins may also contribute to decreased water diffusion. Song et al (32) noted that diffusion tensor (DT) imaging of the shiverer mouse spinal cord showed no decrease in longitudinal water diffusion despite decreased axonal caliber and increased axonal microtubule and neurofilament density (43, 44). Gulani et al (31) showed increased longitudinal water diffusivity in DT imaging findings of myelin-deficient rats as compared with diffusivity in normal controls. Therefore, axonal diameter and cytoskeletal protein status may not be the only factors influencing longitudinal water diffusion, especially in the presence of other pathologic processes such as demyelination.
Calculations of Anisotropy
In this study of normal spinal cord white matter, we have shown that differences in fixation result in changes in longitudinal water diffusion, although transverse water diffusion is not affected. It is, therefore, not surprising that there is a subsequent increase in anisotropic water diffusion. Such a change in anisotropy could be produced either by an increase in longitudinal, or a decrease in transverse, diffusion coefficients. Thus, it may be more important to evaluate specific directional diffusivities, as each may reflect distinct pathologic processes.
Our findings suggest that the organization and density of axoplasmic cytoskeletal proteins, such as neurofilaments and microtubules, are important, although not the sole determinants, in influencing longitudinal water diffusion. Therefore, it may be possible to detect disease that disrupts axoplasmic structures without disrupting the myelin sheath or cellular membrane integrity. Conversely, it may be possible to detect disruption of the myelin sheath that does not alter axoplasmic proteins.
The importance of evaluating individual directional diffusivities is supported in a study of water diffusivity in a model of optic nerve ischemia in which Song et al (45) observed that decreased longitudinal water diffusion occurred earlier than increases in transverse water diffusion, reflecting axonal degeneration, whereas increases in transverse diffusion occurred later with loss of myelin. Interestingly, relative anisotropy did not appear to significantly change when only increased longitudinal diffusion was seen, again supporting the greater utility of evaluating individual directional diffusivities rather than a calculated measure of anisotropy.
Research in animal models of spinal cord injury also demonstrates the utility of evaluating individual directional diffusivities. In a rodent model of syringomyelia, DW imaging depicted cyst formation earlier than did conventional MR imaging owing to increases in both longitudinal and transverse ADC values, and the data indicate no changes in the ratio of transverse to longitudinal ADC values (46). Also, in an evaluation of spinal cord transplant function, decreasing transverse and longitudinal ADC values within fibroblast transplants reflect increased axonal in-growth, without demonstrating anisotropic water diffusion (1).
Methodological Issues
A possible confound to our comparisons of fixatives could be differences in the degree of tissue shrinkage, which are observed on histologic sections. Shrinkage of fixed tissue, however, occurs mostly in the processing required for sectioning following perfusion fixation. The perfusion fixation with either PF or GL-PF does not result in CNS tissue shrinkage of the gross specimen before histologic evaluation (47). Because our imaging is performed before histologic preparation and sectioning, there should be no differences in tissue volume between the GL-PF and PF fixed specimens.
We imaged the differently fixed specimens with slightly different imaging parameters owing to our observation (unpublished data) that the T2 relaxation time of GL-PF specimens is shorter than the T2 relaxation time of PF specimens. Shorter TE and shorter diffusion times for GL-PF specimens were required to increase signal-to-noise ratio and allowed differentiation between gray matter and white matter. The difference in diffusion times should not adversely affect our comparison of tADC values, because the diffusion times employed indicate that the values should be on the asymptotic curve for restricted water diffusion with both sets of parameters (48). Our lADC values also should not be affected, because both sets of parameters have diffusion times short enough to permit essentially unrestricted water diffusion with minimal water exchange (49).
A comparison between live and formalin-fixed brains showed no differences in anisotropy ratios, supporting the usefulness of optimizing data analysis on fixed tissue before imaging live subjects (50). We have shown, however, that there are significant differences in lADC and AI between specimens fixed with PF or GL-PF, without changes in tADC. Therefore, care must be used in directly extrapolating specimen data to live tissue without taking into account fixative type. Additionally, separate controls are required in ex vivo experiments if different fixation methods are used.
To better characterize the histologic correlates of each directional diffusivity, we are developing an automated method of segmenting high-resolution histologic images, and obtaining data for parameters such as axonal diameter, axonal density, myelin sheath thickness, axonal spacing, and volume fractions of myelin, intracellular space and extracellular space. These variables can then be correlated with ADC values (51). A noninvasive method can then be developed to determine functionally important pathohistologic parameters in the injured CNS white matter.
Conclusion
Our study with differently fixed normal spinal cord specimens indicates that better preservation of cytoskeletal structures, such as the longitudinally oriented neurofilaments, results in increased lADC values. Despite the expected splitting of the myelin sheath in PF fixed specimens, the tADC values were the same as those in GL-PF specimens, suggesting that actual myelin loss may be necessary to decrease tADC values.
Footnotes
Supported by NIH grants NS02230, NS41380 NS24707, ASNR/Berlex Basic Science Fellowship, and Research Services of the Department of Veterans Affairs.
Presented in part at the 39th Annual Meeting of the ASNR, April 23–27, 2001, Boston, MA.
References
- Received March 3, 2004.
- Accepted after revision July 2, 2004.
- Copyright © American Society of Neuroradiology
In this issue


Jump to section
Related Articles
Cited By...
- No citing articles found.