
Abstract
BACKGROUND AND PURPOSE: Visual defect due to optic radiation injury is a complication of temporal lobectomy for temporal epilepsy. To investigate whether diffusion tensor imaging can delineate the changes in optic radiations after lobectomy, we evaluated parameters on tensor images for optic radiations and correlated them with visual defect.
METHODS: We examined 14 cases after temporal lobectomy. Durations after surgeries ranged from 3 weeks to 9 years. The cases were classified into three groups on the basis of the severity of visual field defect (A–C, with group C the most severe). We evaluated signals on T2-weighted images and parameters of tensor images, including fractional anisotropy (FA) and apparent diffusion coefficient (ADC), for the optic radiation in both the operated and intact side.
RESULTS: On T2-weighted images, high signals in optic radiations were seen in four cases, occurring more than 4 weeks after surgery. The mean operated-to–intact side FA ratio in the optic radiation decreased according to severity of visual defect (group A, 0.88; group B, 0.89; group C, 0.73). The mean operated-to-intact side ADC ratio showed no significant difference in the overall cases. The ratio for ADC, however, tended to increase according to visual defect in cases after 10 weeks postsurgery.
CONCLUSION: Optic radiation showed a decreased FA value in cases after temporal lobectomy. In later stages, ADC values tended to increase and high signal intensities on T2-weighted images were observed. The FA value can be used for evaluating Wallerian degeneration of optic radiation even in the early stages after surgery.
Visual field defect due to optic radiation injury is a well-known complication after anterior temporal lobectomy for temporal lobe epilepsy (1–5). “Pie in the sky”-shaped visual field defects can develop after surgery, because of injury in the temporal lobe due to optic radiation.
The purpose of this study was to investigate whether diffusion tensor imaging can delineate the changes due to Wallerian degeneration in the optic radiation in the sagittal strata after temporal lobectomy. We calculated fractional anisotropy (FA) and apparent diffusion coefficient (ADC) values on diffusion tensor images of the sagittal strata, which included the optic radiation, inferior longitudinal fascicles, and splenium fibers, and we correlated the FA and ADC values with the degrees of visual field defect. We also reviewed T2-weighted images for high signals in optic radiations, which have been reported to be a sign of Wallerian degeneration after temporal lobectomy (6).
Methods
Subjects
We retrospectively examined 14 cases after temporal lobectomy for temporal lobe epilepsy. The duration between surgeries and imaging varied from 3 weeks to 9 years (Table 1).
Cases consists of three groups and their duration after surgery
The cases were classified as follows into three groups on the basis of the visual field defect in the medial and lateral sector of the upper quadrant visual field (Fig 1): group A, incomplete defect in the medial sector of the upper quadrant visual field; group B, complete defect in the medial sector and incomplete defect within the lateral sector; and group C, complete defect in both medial and lateral sectors.

Schematic drawing of the classification by visual field defect. Anterior fibers of Meyer’s loop correspond to the medial sector and posterior fibers correspond to lateral sectors of the upper quadrant visual field of the contralateral side.
Group A, incomplete defect in the medial sector of the upper quadrant visual field.
Group B, complete defect in the medial sector and incomplete defect within the lateral sector.
Group C, complete defect in both the medial and lateral sectors.
Imaging
A 1.5T clinical MR unit (Magnetom Sonata, Siemens, Erlangen, Germany) was used for acquisition of T2-weighted images and diffusion tensor images. T2-weighted images were obtained by using a turbo spin-echo sequence (TR, 8,000 ms; TE, 100 ms; FOV, 230 mm; matrix, 256 × 256; section thickness, 5 mm; averaging, 2). Diffusion-weighted images were obtained by using an echo-planar imaging sequence (TR, 2,300 ms; TE, 122 ms; b, 1000 s/mm2; six axes encoding; FOV, 230 mm; matrix, 128 × 128; section spacing, 5 mm; section thickness, 4 mm; averaging, 6).
Data Analysis
We examined T2-weighted images for abnormal signals in the optic radiation within the temporal to occipital lobe and correlated the data with the severity of the visual field defect and duration after surgery. Duration after surgery was classified into three groups: <4 weeks, 4–10 weeks, and >10 weeks. Two neuroradiologists (TT, MS), who were blinded to each other’s interpretation and the extent of visual field defect, interpreted the T2-weighted images.
For the processing of tensor images, medical image processing software (Dr. View/Linux, Asahi-Kasei Information Systems, Tokyo, Japan) on a Linux workstation was used. We generated color-displayed tensor images, FA images, and ADC images from the set of diffusion tensor images (Figs 2–4). For the color-displayed tensor images, anterior-to-posterior tracts are displayed in green, left-to-right tracts are displayed in red, and head-to-feet tracts are displayed in blue (Fig 2). For the FA and ADC images, FA and ADC values are recorded in dark red (lower value) to bright red (higher value).

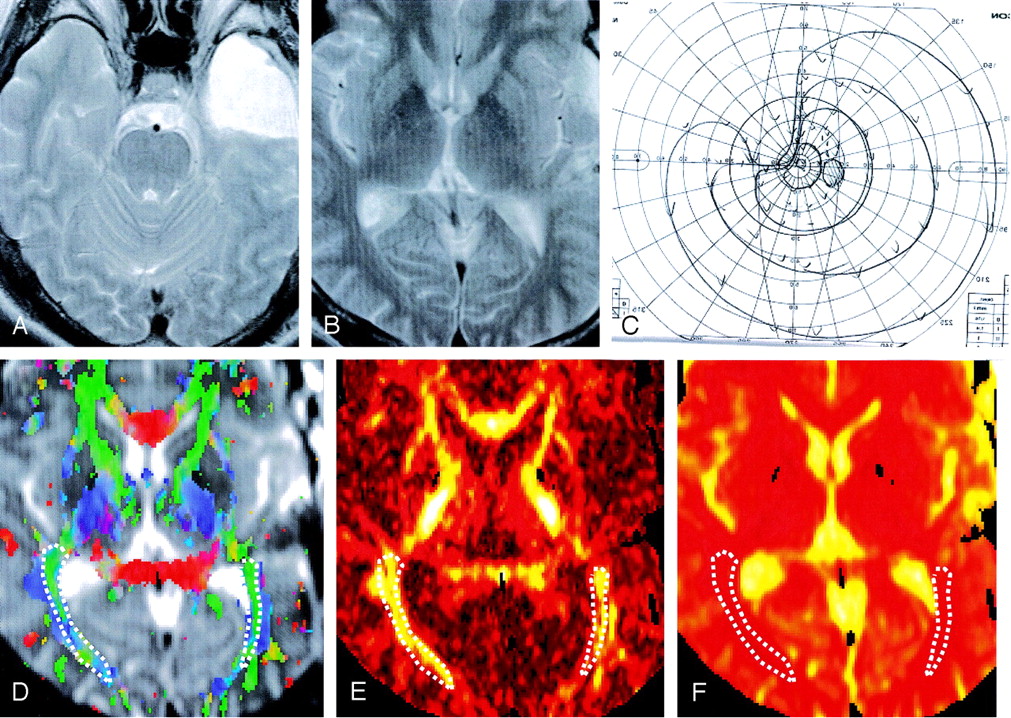
Case 1, a 23-year-old man.
A and B, T2-weighted images. The patient had a left temporal lobectomy (A). No abnormal signal intensity is seen within the sagittal stratum, which includes optic radiation (B). C, Visual field: Partial visual field defect in the medial sector is seen (group A). D, Color-displayed tensor image: Sagittal strata including the optic radiation are recognized as a green area indicating an anterior to posterior directed tract. Regions of interest for measurement are shown as dotted lines. E, FA image 255 . FA of the left optic radiation shows a slightly lower value as compared with the opposite side (right, 0.499; left, 0.425). F, ADC image 255 . There is no apparent difference between the optic radiations of both sides (right, 5.90 × 10 −4 mm2/s; left, 5.70 × 10⁻⁴ mm2/s).

Case 9, a 44-year-old man.
A and B, T2-weighted image. The patient had a left temporal lobectomy (A). No abnormal signal intensity can be seen along the sagittal stratum (B). C, Visual field. The medial sector of the upper quadrant visual field is completely impaired, and partial impairment in the lateral sector area can be seen. D, Color-displayed tensor image. Sagittal strata are recognized as a green area, which indicates an anterior to posterior directed tract. Regions of interest for measurement of ADC and FA values are shown as dotted lines. E, FA image. The FA value of the left optic radiation shows a lower value as compared with the opposite side (right, 0.526; left, 0.488). F, ADC image. There is no apparent difference between the optic radiations of both sides (right, 6.20 × 10⁻⁴ mm2/s; left, 6.10 × 10⁻⁴ mm2/s).

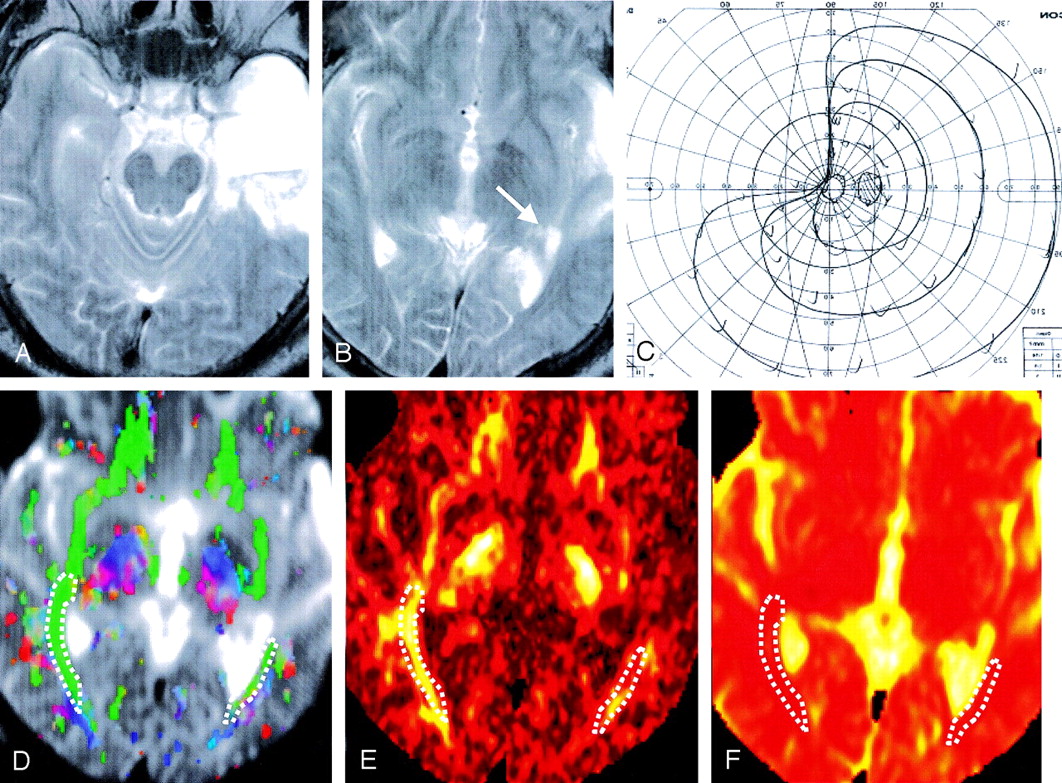
Case 8, a 49-year-old man.
A and B, T2-weighted image. The patient had left anterior temporal lobectomy (A), and there is a high signal intensity area in the anterior part of left sagittal stratum (B, arrow). C, Visual field. The upper quadrant visual field is completely impaired. D, Color-displayed tensor image. Sagittal strata including the optic radiation were recognized as a green area even in operated side. Regions of interest for measurement are shown as dotted lines. E, FA image. The FA value of the left sagittal strata shows a noticeably lower value as compared with the opposite side (right, 0.506; left, 0. 394). F, ADC image. No apparent difference between the optic radiations of both sides is observed (right, 6.10 × 10⁻⁴ mm2/s; left, 7.00 × 10⁻⁴ mm2/s).
We used color-displayed tensor images to recognize the sagittal strata, which included the optic radiation, inferior longitudinal fascicles, and splenium fibers. On color-displayed tensor images, tracts of sagittal strata, which run in the anterior to posterior direction, are shown in green and can be distinguished from the U-fibers in the occipital lobe, which are shown in blue or red. For the FA and ADC images, regions of interest, which were determined from the green area on the color-displayed tensor images, were set up on the sagittal strata on both sides, and we measured the mean value of FA and ADC for these areas.
FA and ADC values for the operated and intact sides were compared within groups A, B, and C. To eliminate the FA value baseline variation, we calculated the operated side-to-intact side ratios for the FA values. Similarly, we calculated ratios for the operated side to intact side for ADC. We used a student t test to examine these ratios between the three groups (A, B, and C). In addition, we analyzed the operated to intact side ratios of FA and ADC for the degree of visual defect and duration after surgery by dividing the patients into three groups: <4 weeks, 4–10 weeks, and >10 weeks.
Results
There were four cases where the T2-weighted images had high signals in the optic radiations (Table 2). Durations after surgery were more than 4 weeks in all four cases. The kappa value of two observers was 0.65 (disagree in one case). The table indicates the cases that both observers interpreted as positive.
Number of cases that show a high signal along the optic radiation after temporal lobectomy. (There were no cases that were examined within 4–10 weeks for groups A and B.)
The FA and ADC values for the operated and intact sides for the three groups are shown in Figure 5 (A, B). The mean FA value for the lobectomy side was 0.447 in group A, 0.429 in group B, and 0.364 in group C. The mean ADC value for the lobectomy side was 6.07 × 10⁻⁴ mm2/s in group A, 5.93 × 10⁻⁴ mm2/s in group B, and 6.03 × 10⁻⁴ mm2/s in group C. For the FA value, there were statistically significant differences between the operated sides and intact sides within each group (group A, P < .05; group B, P < .01; group C, P < .01). There were no significant differences between the three groups for the ADC values.

A, FA values for the lobectomy and intact side in groups A, B, and C. The FA value of the lobectomy side shows a lower value compared with the intact side in each group. There are statistically significant differences between the operated and intact side in group A (P < .05), group B (P < .01) and C (P < .01). B, ADC values for the lobectomy and intact side in groups A, B, and C. There is no statistical difference between the ADC value of the operative side and intact side when evaluated overall.
The mean operated-to-intact side FA ratios in the sagittal strata were 0.88 in group A (n=3), 0.89 in group B (n=6), and 0.73 in group C (n=5) (Fig 6A). There were statistically significant differences between groups A and C (P < .05) and between groups B and C (P < .01). The mean operative-to-intact side ADC ratios were 1.01 in group A, 1.00 in group B, and 1.05 in group C, for which there were no statistically significant differences (Fig 6B).

A, Mean operated-to-intact side FA ratio. The mean operated-to-intact side FA ratio in the sagittal strata is shown. The more severe groups show a smaller FA in the operated side. Groups A and C, and groups B and C showed statistically significant differences. B, Mean operated-to-intact side ADC ratio. The mean operated-to-intact side ADC ratio in the sagittal strata is shown. There is no statistically significant difference between the three groups when evaluated overall.
Figure 7 shows mean operated-to-intact side FA and ADC ratios for each group (A, B, and C) and the duration after surgery (<4 weeks, 4–10 weeks, and >10 weeks). We did not perform a statistical analysis, because the sample numbers for each group were too small. Although there were no statistical significances in the overall analysis for mean operated-to-intact side ADC ratios listed above, Fig 7B suggests that ADC increases in more severe groups when the comparison is limited to the cases more than 10 weeks after surgery. Figure 7A suggests that even within 4 weeks after surgery, a decrease of FA values can be observed.
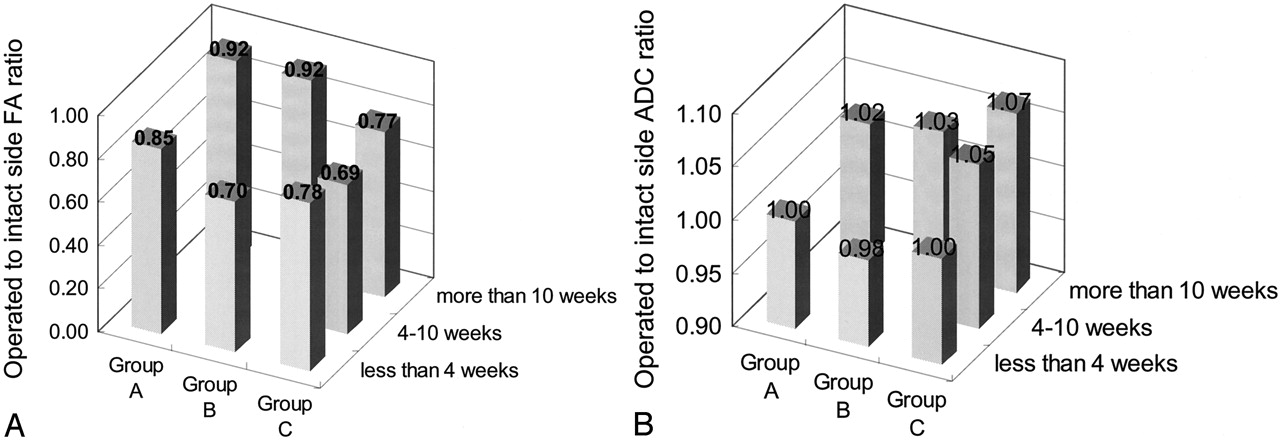
A, The mean operative to intact side FA ratio as classified by the severity of visual defect and duration after surgery. The mean operated-to-intact side FA ratio as classified by visual field and duration after surgery is shown. Even in early cases after surgery, the FA value is found to decrease, and for the groups examined long after surgery, there is also an obvious decrease. There were no cases that were examined within 4–10 weeks in groups A or B. B, Mean operated-to-intact side ADC ratio as classified by the severity of visual defect and duration after surgery. Although a statistically significant difference is not detected when evaluated overall, there is a trend for the ADC value to decrease in the early period after surgery and increase during the late period after surgery. In the groups with time periods of >10 weeks after surgery, the increase of ADC is larger in group C. There were no cases that were examined within 4–10 weeks for groups A or B.
Discussion
Temporal lobe epilepsy is one of the surgically treatable epilepsies, and operative methods for temporal lobe epilepsy include standard anterior temporal lobectomy, tailored temporal lobectomy, anteromedial temporal lobectomy, and selective amygdalohippocampectomy. The operative method for each of the particular patients was decided on the basis of information for the epileptic foci as evaluated by various modalities. When anterior temporal lobectomy is selected for temporal epilepsy due to hippocampal sclerosis, a part of the visual pathway within the temporal lobe is included within the area of resection. As a result, visual field defect is a common side effect of this operation.
Fibers of the optic radiation divide into two bundles after leaving the lateral geniculate body. One is a ventral temporal loop, and the other is a dorsal optic radiation. The former corresponds to the upper-quadrant visual field, and the latter corresponds to the lower-quadrant visual field. Fibers of the ventral temporal loop originate from the ventrolateral part of the lateral geniculate body and run forward and laterally to the temporal pole. The fiber forms a steep curve around the tip of the inferior horn of the lateral ventricle (Meyer’s loop) and runs backward through the sagittal stratum to terminate in the lower calcarine lip. The anterior part of Meyer’s loop contains fibers corresponding to the medial part of the upper quadrant visual field (medial sector). Although there are fibers that correspond to the lateral part of the upper-quadrant visual field (lateral sector) in the posterior part of Meyer’s loop, the anterior part of Meyer’s loop is more likely to be injured by anterior temporal lobectomy as compared with the posterior part. Thus, visual defects due to anterior temporal lobectomy begin at the medial sector in slight cases and spread into the lateral sector in severe cases. When the injury to Meyer’s loop becomes total, the patients develop complete upper-quadrant visual field defect (5).
Injury to the proximal part of the axon or cell body results in antegrade degeneration of the distal axon and its myelin sheath (Wallerian degeneration). In the early stage of Wallerian degeneration, a high signal intensity on diffusion-weighted images and a decreased ADC value is reported (7). An edematous change in the axon or myelin tissue, which appears later than neuronal or glial edema, is speculated to be responsible for the changes (8).
With conventional T2-weighted images, no abnormal signal intensity is detected within 4 weeks of axonal injury. From 4 to 10 weeks after injury, a slight low signal intensity on T2-weighted images is reported and is speculated to be the result of an increased lipid-protein ratio. At 10 weeks after injury, a high signal intensity on T2-weighted images and a low signal intensity on T1-weighted images are reported (9–11). Wallerian degeneration of the optic radiation on conventional MR imaging is reported as a bandlike hyperintensity along the optic radiation on T2-weighted images (6).
Diffusion tensor images have recently been applied to cases with Wallerian degeneration, and there are some reports on chronological changes on diffusion images or diffusion tensor images. Kang et al (12) has reported there is a high signal intensity on diffusion-weighted images one day after axonal injury and Castillo and Mukherji have shown high signals on diffusion-weighted images 72 hours after ictus in 20% of the cases (2/11) (7). Yamada et al (13) have reported changes in anisotropy by Wallerian degeneration. These Wallerian degeneration lesions in the cerebellar peduncle showed decreased diffusivity and decreased fractional anisotropy 12 days after ictus. There is also a report on tensor imaging in subacute stroke cases (2–3 weeks after ictus), in which decreased anisotropy has been found (14), and one other study that reported that tensor imaging can delineate Wallerian degeneration in chronic infarction cases (15).
In the current study, we evaluated signal intensity changes on a T2-weighted image, and the FA and ADC values of the ipsilateral sagittal strata after temporal lobectomy. There were no cases with abnormal signals of the sagittal strata on T2-weighted images within 4 weeks of surgery. Hyperintensity in the sagittal strata was observed in four of seven cases in which the duration after surgery was >4 weeks. This finding agrees with previously reported cases (10, 11) and shows that T2-weighted images cannot detect early Wallerian degeneration changes.
We were, however, able to observe decreased FA values in the sagittal strata even in cases that occurred within 4 weeks of surgery. The degree of the FA decrease has a positive relationship to the degree of visual field defect, which seems to suggest that severity of optic radiation injury affects both visual defect and anisotropic diffusion. The decrease of the FA value tended to be greater in cases where the time after surgery was longer, which suggests impairment of anisotropic diffusion tends to develop over time.
We could not observe any changes in the ADC value during the overall evaluation, a finding similar to what has been reported in several previous studies (7, 13). On the other hand, although the number of samples was not large enough for statistical evaluation, there was a trend for ADC to increase in proportion to the visual field defects when we limited the evaluation to the cases in which the duration after surgery was >10 weeks. In contrast, the ADC of the sagittal strata within 4 weeks after surgery showed a decreased value as compared with the intact side. In other words, diffusivity in the optic radiation seemed to decrease in the early phase after surgery followed by an increase that occurred in the remote phase after surgery.
There has been one case report on tensor imaging of Wallerian degeneration after temporal lobectomy (3). In that study, Wieshmann et al report that the FA and ADC of the optic radiation were evaluated in three cases after temporal lobectomy. One case showed an elevated ADC and a decreased FA compared with the normal population, one case showed a decreased FA, and one case showed no changes. Our findings are in agreement with their study in that we found a diminished anisotropy in the optic radiation after optic radiation injury. We could provide additional findings that there is positive correlation between degree of FA decrease and degree of visual defect, and that ADC values seemed to decrease in early phase after surgery and increase late after surgery.
In our study, we measured the ADC and FA value in the sagittal stratum, which contains not only the optic radiation, but also the inferior longitudinal fascicles or callosal fibers. Although our target was the optic radiation, we were unable to isolate optic radiation from other tracts. Whereas we could exclude U-fibers from evaluation by recognizing direction on the color-displayed tensor images, the optic radiation and other tracts in the sagittal stratum followed the same direction. Thus, it was impossible to isolate the optic radiation from other tracts during the conditions that occurred after temporal lobectomy in which the connection of the optic radiation was damaged. We could, however, delineate changes in the FA in the sagittal stratum after temporal lobectomy despite contamination of intact fibers. This suggests that changes in the FA or ADC within the optic radiation alone may be larger than any other values we might be able to obtain. Our study has another limitation. Although the duration between surgery and MR examination varies widely, there were no cases with more than one postoperative examination, which could have been helpful in following the time course of signal intensity changes in a single subject.
The clinical significance of this study is that objective evaluation of injury including Wallerian degeneration in optic radiation can be obtained by using MR tensor imaging, although ophthalmologic visual field examination can be influenced by subjection. Also, time course of FA and ADC value shown in our study will be helpful in follow-up evaluation after surgery. In addition, when we apply tractography by MR tensor imaging before surgery, spatial information of optic radiation will be potentially useful in planning of operation and reduce visual field defect after surgery by providing information about localization of optic radiation in the temporal lobe of particular patient.
Conclusion
The optic radiation after temporal lobectomy showed a decreased FA value as compared with the intact side. In addition, FA values showed a larger decrease in more severe visual field defect cases. ADC values, however, showed no statistical difference between the temporal lobectomy side and intact side. The drop in the FA value seems to be because of Wallerian degeneration of the optic radiation due to the resection of Meyer’s loop. FA values can be used for evaluating Wallerian degeneration in the optic radiation after temporal lobectomy.
References
- Received April 1, 2004.
- Accepted after revision August 30, 2004.
- American Society of Neuroradiology


