
Abstract
BACKGROUND AND PURPOSE: Selective neuronal death is a well-recognized histopathologic sequel to moderate ischemic brain damage. However, radiologic visualization of these changes has not been established, even with diffusion tensor imaging (DTI). We sought to determine whether DTI with b values ≥1900 s/mm2 reveals occult diffusion abnormalities in patients with cerebral arterial occlusive disease.
METHODS: Six patients (five men, one woman; mean age ± standard deviation, 66 ± 8 years) with unilateral internal carotid or middle cerebral arterial occlusive disease but not parenchymal T2 hyperintensity underwent 3T fast DTI with b ≤ 1300 s/mm2 and slow DTI with b ≥ 1900 s/mm2. We postprocessed mean diffusibility and fractional anisotropy (FA) images from the fast and slow DTI datasets. Standardized asymmetry indices (AIs) were used to identify regional asymmetries. Diagnostic accuracy among the DTI modalities was assessed by means of receiver operating characteristic analysis.
RESULTS: In hemispheres ipsilateral to occluded vessel, AIs were significantly elevated on fast mean-diffusibility images of white matter at the levels of the internal capsule (95% confidence interval [CI]: 1.00, 1.09; P = .045) and corona radiata (95% CI: 1.01, 1.12; P = .034). AIs were significantly decreased on slow FA images at the internal capsule (95% CI: 0.84, 0.98; P = .018) and white matter at the internal capsule level (95% CI: 0.92, 1.00, P = .043). The slow FA map had the highest accuracy (89.8%) for detecting the hemisphere ipsilateral to arterial occlusion.
CONCLUSION: Slow FA maps acquired by using DTI with high b values are useful for visualizing ischemic brain damage in apparently normal WM.
Selective neuronal death is well recognized as a histopathologic sequel of ischemic brain damage less severe than infarction (1–5). Selective neuronal death reveals regional loss of limited number of neurons without coagulation necrosis or cavitation of the neural tissue. Several histopathologic studies have demonstrated selective neuronal death in experimental animals (1–4) and human autopsy cases (5) with ischemic insults.
By using conventional MR imaging, brain infarction was widely accepted as depression of the apparent diffusion coefficient (ADC) with acute brain ischemia and T2 hyperintensities; however, radiologic visualization of selective neuronal death remains limited. Only studies of in vivo benzodiazepine receptor mapping (6, 7) or magnetization transfer imaging (8) in patients with acute (6) or chronic nonfatal ischemia (7, 8) have supported this concept for selective neuronal death.
Progress in diffusion MR imaging has advanced the immediate diagnosis of hyperacute ischemic stroke. Furthermore, applications of diffusion MR imaging continue to expand from the estimation of diffusion amplitudes, which enables the diagnosis of stroke on diffusion-weighted imaging (DWI), to the estimation of complete diffusion tensor, which may improved resolution of white matter (WM) microstructures in both healthy and diseased conditions on diffusion tensor imaging (DTI). DTI depicts tissue diffusion characteristics as 3D ellipsoids (9). Postprocessed from these ellipsoids, DTI maps can reveal both amplitudes and anisotropy indexes of tissue diffusion properties on a voxel-by-voxel basis.
DTI with conventional b values of ≤1000 s/mm2 is already accepted as a tool with sufficient sensitivity to depict brain pathologies hidden in normal-appearing WM (10–20). However, in the evaluation of chronic brain ischemia, the sensitivity of DTI is limited because it shows only diffusion abnormalities that coexist with diffuse T2 hyperintensity (12, 18, 21) or secondary neuronal degeneration after stroke (15).
We hypothesized that increased diffusion weighting can reveal the slow-diffusing water component of neural tissue (22–24), which might clarify the subtle WM structural changes that accompanies selective neuronal death. We therefore used DTI with low and high b values to evaluate patients with cerebral arterial occlusive disease and minimal T2 changes.
Methods
Patients
The study was approved by the institutional review boards of our institution. To assess the subtle structural changes in the WM independent of apparent lesions, we included only patients with occlusive lesions (≥75% stenosis) of the internal carotid artery (ICA) or middle cerebral artery (MCA). Patients with neurologic deficits were excluded, as were those with any other brain disease, and patients whose most recent neurologic episode occurred <3 months before the study.
We excluded patients with the following findings on fluid-attenuating inversion recovery images (1.5 T, fast spin-echo, TR/TE/TI = 10,000/100/2500, echo train length = 8): apparent symptomatic brain lesions, grade 2 or 3 hyperintensities in the deep WM or periventricular hyperintensities according to the Fazekas scale (25), asymptomatic cortical lesions, or lacunae larger than 3 mm in diameter.
Because of concerns about the safety of high-field-strength MR imaging, patients with implanted metals or medical devices, tattoos, or claustrophobia were excluded. Six patients hospitalized at National Cardiovascular Center, Osaka, Japan, between November 2001 and November 2003 met the study criteria (Table 1). These patients underwent imaging after informed consent was obtained. We also examined six nonage-matched healthy volunteers (three men, three women; mean age ± standard deviation, 29 ± 4 years) after obtaining informed consent and verifying the absence of safety concerns related to MR imaging.
Patient demographics
Physiologic Basis of DTI with High b Values
The strength of diffusion weighting is quantified by the b value (26). For typical b values of ≤1000 s/mm2, diffusional signal-intensity decays can be simply approximated by using the single exponential model (27, 28). However, diffusion MR imaging studies with increased b values have revealed that this model is no longer best for describing diffusional signal-intensity decay in the human brain. The decay (Sb/S0) is better described by the double exponential model, as follows (22–24): Sb/S0 = Ffast exp(−Dfast × b) + Fslow exp(−Dslow × b), where Sb is the signal intensity with diffusion weighting of the specified b value, S0 is the signal intensity without diffusion weighting, Ffast and Fslow are the volume fractions of the respective fast and slow components, and Dfast and Dslow are the ADCs of the respective fast and slow components.
Fast components consist of loosely diffusion-restricted water components, which, with differences in D, show increased decay with b-value increments. Similarly, slow components are tightly diffusion-restricted water components and, as D changes, show decreased decay with change in the b value. Diffusion MR imaging with low b values represents both the fast and slow components; in contrast, imaging with high b values dominantly represents the slow diffusion components in eliminating signals from the fast components. To optimize the appropriate use of high b values for the slow components, we examined the diffusional signal-intensity decay of six healthy volunteers before beginning the study (Fig 1); these data indicated that we should use b values of ≥1900 s/mm2 to estimate the slow components.

Double-exponential diffusional signal-intensity decays. Plot shows 1) the mean ± 1 SD (error bars) of Sb/S0 at b = 100–3300 s/mm2 in the centrum semiovale in six healthy volunteers and 2) the approximation to the double-exponential model according to the nonlinear least-squares Marquardt–Levenberg algorithm (line) plotted on a logarithmic scale. Also shown are b-value ranges for fast (A) and slow (B) DTI in patients 3–6.
DTI Parameters
Spin-echo echo-planar imaging that was diffusion-sensitized with six non-colinear motion-probing gradients (9) was implemented on 3.0-T MR imaging systems equipped with gradients of ≤40 mTm−1 (Signa Horizon 3.0LX; GE Medical Systems, Milwaukee, WI). We performed the following sequences same section orientation: spin-echo echo-planar T2-weighted imaging, fast DTI with a subset of low b values (100, 700, and 1300 s/mm2 for patients 1 and 2 and 100, 400, 700, and 1000 s/mm2 for patients 3–6 and control subjects), and slow DTI with a subset of high b values (1900, 2500, and 3100 s/mm2 for patients 1 and 2 and 1900, 2200, 2500, and 2800 s/mm2 for patients 3–6 and control subjects).
To achieve similar signal intensity-to-noise ratios, we averaged two images for fast DTI and eight images for slow DTI. Total examination times were 41 minutes for patients 1 and 2 and 56 minutes for patients 3–6 and control subjects. Other parameters consisted were a TR/TE of 11500/93.3 ms, a FOV of 220 mm × 220 mm, a matrix of 256 × 256, 16 near-axial sections with 7-mm thickness for patients 1 and 2 or 18 sections with 6-mm thickness for patients 3–6 and control subjects, 100 phase encoding steps, and 256 frequency-encoding steps.
Postprocessing
DTI datasets were automatically corrected for imaging distortions and coregistered in reference to echo-planar T2-weighted image by using software (Statistical Parametric Mapping 2; Functional Imaging Laboratory, Department of Imaging Neuroscience, Institute of Neurology, University College London, UK). These were postprocessed by using image-analysis software (MRVison 1.6.5; MRVision Co., Winchester, MA). Fast and slow tensors were constituted from the respective ADC datasets. Mean diffusibility (MD) and fractional anisotropy (FA) DTI maps (27, 28) were estimated from the fast (for fast MD and FA) and slow (for slow MD and FA) tensor datasets.
Region-of-Interest Analysis
One author (A.S.) semiautomatically defined the polygonal regions of interest (ROIs) to dissect the target WM by using the region-growing method (automatic function) with local thresholding (manual function) on image-analysis software (Osiris 4.1.8; Unite d’Imagerie Numerique, University Hospital of Geneva, Switzerland). ROIs for the internal capsule and those for all of the unilateral WM at sections including the internal capsule (WM-IC), corona radiata (WM-CR), and centrum semiovale (WM-CS) were dissected in reference to fast FA and slow MD images. Each ROI value was quantified simultaneously on all DTIs.
Statistical Analysis
Absolute ROI values of the hemisphere ipsilateral to the arterial occlusion (affected hemisphere) were compared with those of the contralateral (unaffected) hemisphere by using paired t tests (Table 2). An asymmetry index (AI) was used for the numerical evaluation of relative changes in ROIs in the affected hemisphere. The AI was calculated by obtaining the ipsilateral-to-contralateral ratio of values in ROI symmetrically placed on axial images. Diffusion characteristics in the normal brain are somewhat asymmetrical (29). Therefore, when the affected hemisphere was on the left, the AI was standardized by being divided by the mean value of the left-to-right ratios of similar ROIs obtained from control subjects. The 95% confidence intervals (CIs) of the standardized AIs were calculated and statistically analyzed (Table 2).
ROI statistics
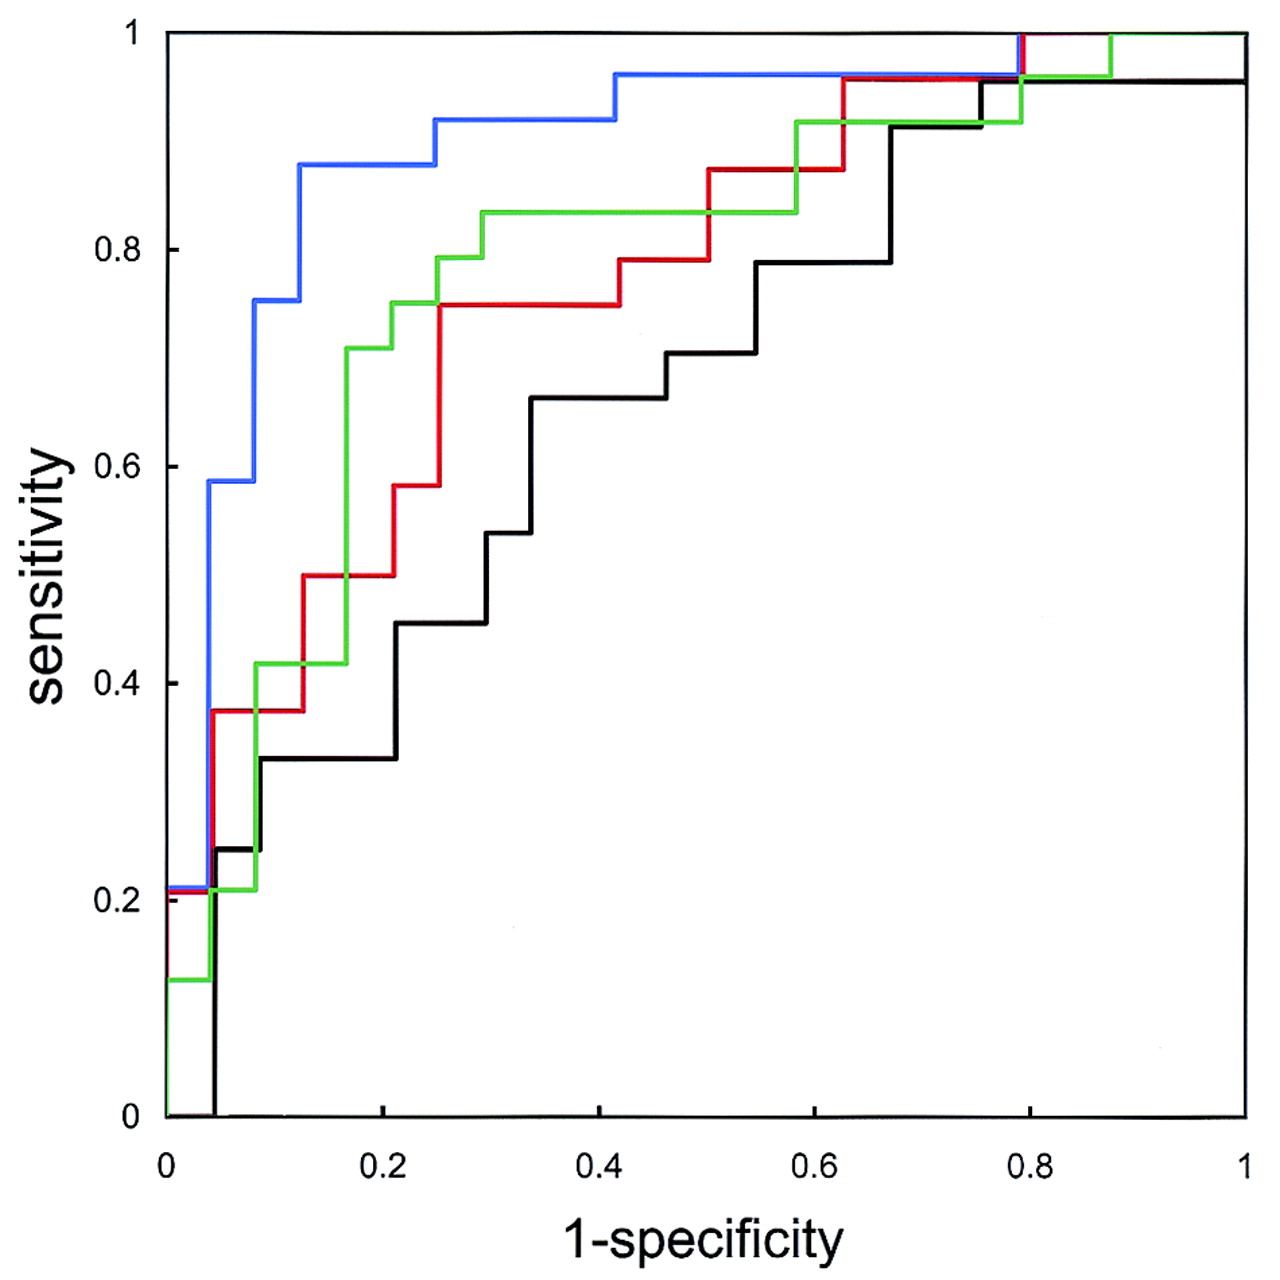
We assessed the diagnostic accuracy of the different DTI modalities in depicting the affected hemisphere by means of receiver operating characteristic (ROC) analysis (Fig 2). A true-positive finding was defined when the individual AI for the affected hemisphere exceeded the threshold for MD or when it was less than the threshold for FA. False-positive findings were similar results in the unaffected hemisphere.

ROC curves for fast MD (green), slow MD (black), fast FA (red), and slow FA (blue) indicate estimated accuracies of 78.1%, 69.3%, 77.4%, and 89.8%, respectively. Accuracy of predicting the affected hemisphere was superior for MD on fast DTI and for FA on slow DTI.
Results
Comparison of absolute ROI values demonstrated significant declines in slow FA at the internal capsule of the affected hemisphere (0.74 ± 0.10 vs 0.67 ± 0.08, P = .045). We found no significant differences in other ROI values on the slow FA map or in any ROI value on the fast MD, slow MD, or fast FA maps (Table 2). Standardized AIs of the slow FA map showed significant decreases in the internal capsule (95% CI: 0.84, 0.98; P = .018) and WM-IC (95% CI: 0.92,1.00; P = .043). Standardized AIs on the fast MD maps also showed slight but significant elevations in the WM-IC (95% CI: 1.00, 1.09; P = .045) and WM-CR (95% CI: 1.01, 1.12; P = .034). ROC analysis showed that the accuracy of detecting the affected hemisphere was 78.1% for fast MD, 69.3% for slow MD, 77.4% for fast FA, and 89.8% for slow FA (Fig 2). Figure 3 shows three sections from the DTI maps in patient 3, who had occlusion of the right internal capsule, and Figure 4 shows sections in patient 4, who had severe stenosis of the left MCA.

DTIs of patient 3 with right ICA occlusion: fast MD (3A), slow MD (3B), fast FA (3C), slow FA (3D), and color-scaled slow FA maps (3E) of MD (10−3 s/mm2) and FA. Arrows indicate affected hemispheres. In the absence of apparent T2 hyperintensities, the slow FA map of patient 3 demonstrated slight anisotropy declines at right internal capsule.

DTIs of patient 4 with left MCA stenosis: fast MD (4A), slow MD (4B), fast FA (4C), slow FA (4D). Slow FA map shows broad anisotropy declines in the left hemisphere at all levels shown.
Discussion
Tissue diffusion properties can be assessed by means of two postprocessed indices: MD (or ADC) and FA (27, 28). MD represents the magnitude of the diffusion tensor (27, 28), whereas FA represents the shape of the diffusion tensor (28), where an FA of 0 indicates a globular tensor and an FA of 1 indicates a linear tensor. Elevated FA values are probably related to tight diffusion barriers orthogonal to directions of the neural fibers, such as increased attenuation, decreased diameter, and tighter myelination, among others. Declines in FA may indicate neuronal loss, gliosis, and demyelination found in association with various neurologic disorders in normal-appearing WM (10, 11, 13–19).
The proved sensitivity of DTI with conventional b values for the evaluation of various brain pathologies (10, 11, 13, 14, 16, 17, 19, 20) cannot simply be applied to brain ischemia. Previous DTI studies (b ≤ 1000 s/mm2) of obstructive cerebrovascular disease (12, 15, 18, 21) have demonstrated MD elevation and anisotropy decline in areas with T2 hyperintensity (12, 15, 18, 21), MD elevation in the normal-appearing WM adjacent to T2 hyperintensity (12, 18), and MD elevation and FA declines in the pyramidal tracts with ipsilateral hemiplegia (15).
Increased diffusion weighting may improve this insensitivity. Clark et al advocated a theoretical framework for the assignment of fast and slow components to extracellular and intracellular fluid (30). Yoshiura et al demonstrated the usefulness of DWI with high b values for the detection of WM degeneration associated with Alzheimer disease (31). In light of these findings, DTI with a high b value might directly reveal the cellular structure, primarily with the slow component, and thereby enable resolution of subtle ischemic changes associated with unilateral cerebral arterial occlusive disease.
We observed changes in the diffusion characteristics of affected hemispheres with minimal abnormalities on fluid-attenuating inversion recovery images. These changes were characterized as elevations in fast rather than slow MD and declines in slow rather than fast FA. ROC analysis indicated that the slow FA map had the best diagnostic accuracy in the affected hemisphere. To our knowledge, ours is the first study to demonstrate changes in properties of the slow component during disease conditions.
Regarding the equation for the double exponential model—Sb/S0 = Ffast exp(−Dfast × b) + Fslow exp(−Dslow × b)—the overall diffusion components represented in the first and second term on the right reflect the fast MD and FA, and the second term represented slow MD and FA that predominantly reflects the slow diffusion component. A possible interpretation of the elevation in fast MD without changes in slow MD is water displacement from the slow to fast component. The changes in MD imply increased loss of the cellular component and its displacement to extracellular fluid, in light of the framework for assignment of fast and slow tensors to extracellular and intracellular fluid (30).
Fast FA can be regarded as a marker of anisotropy for overall diffusion components, including the isotropic and loosely diffusion-restricted extracellular fluid components. In contrast, slow FA is theoretically a marker of anisotropy that predominantly represents the more tightly diffusion-restricted water component. In our study, the slow FA decline independent of changes in fast FA might explain the decreases in the highly anisotropic and tightly diffusion-restricted components.
The histopathologic concept of selective neuronal death is defined as the loss of a limited number of neurons without coagulation necrosis or cavitation after ischemic insult (1–5); selective neuronal death has been observed in humans (5) and experimental animals (1–4). As in vivo radiologic evidence of selective neuronal loss, hypofixation of iodine-123 iomazenil, a surrogate marker of benzodiazepine receptor or neuronal attenuation, was observed in the reperfused gray matter lacking T2 hyperintensity in patients with acute ischemic stroke (6). Data from radiologic studies suggest that chronic but nonfatal brain ischemia may cause selective neuronal death. Yamauchi et al described similar hypofixation of 123I iomazenil in the apparently normal gray matter of chronic brain ischemia (7). As for the WM, Kado et al used magnetization transfer imaging to examine patients with ipsilateral brain ischemia but without apparent T2 hyperintensity; the results suggested changes in the amount and constitution of the myelin present and demonstrated declines in the magnetization transfer ratio and strong linear correlations between the ratio and the cerebral metabolic rate of oxygen2 measured in PET studies (8). Results of these two studies suggest the existence of subtle changes that are broader than the extent of T2 hyperintensity in patients with chronic brain ischemia. Additional changes were inferred from the biophysiologic principles of the radiologic examinations, such as the loss of neurons or myelin content without an increase in the tissue free-water content. Our results indicate decreases in the highly anisotropic slow diffusing component and increases in the fast component. These findings can be interpreted as a loss of axons and myelin content, which contribute to tight diffusion barriers orthogonal to the direction of neural fibers. In light of these results, loss of neurons (axons) and myelination may occur in the WM ipsilateral to an arterial occlusion that is less severe than infarction. Studies in animal models of chronic brain ischemia (32, 33) indicated the WM pathologies, such as disruption of blood-brain barriers (32), axonal loss (33), and demyelination (33). However, similar pathologic changes in human WM are largely unknown.
A limitation of our study was the lack in histopathologic–radiologic correlation. Future pathologic verification in human studies larger than ours is required.
Conclusion
Slow component DTI with high b values may detect occult parenchymal changes in the WM ipsilateral to cerebral arterial occlusive disease.
Acknowledgments
The authors thank Yoshiaki Someya, Seishi Itoi, and Noriko Inoue for their technical support.
Footnotes
Supported in part by a Research Grant for Cardiovascular Diseases (15C-1) from the Ministry of Health, Labor, and Welfare of Japan.
References
- Received August 13, 2004.
- Accepted after revision November 24, 2004.
- Copyright © American Society of Neuroradiology


