
Abstract
BACKGROUND AND PURPOSE: MR examination of infants with kernicterus shows abnormal changes in signal intensity in various parts of the brain, including the globus pallidus and subthalamic regions. The purpose of this study was to retrospectively analyze proton (1H) MR spectroscopic data to see if the MR spectroscopic profiles of infants with hyperbilirubinemia and symptoms of kernicterus provide new insights into the pathophysiology of bilirubin neurotoxicity.
METHODS: Six patients aged 3 days to 3 weeks, with hyperbilirubinemia and symptoms of kernicterus underwent MR imaging and MR spectroscopy with a single-voxel point-resolved spectroscopic sequence. The voxel of interest was centered in the basal ganglia with CSF excluded. Quantitative analysis was done by using LCModel. Between-subject comparisons were based on metabolite ratios relative to creatine.
RESULTS: Ratios of taurine, glutamate and glutamine, and myoinositol relative to creatine were significantly elevated (P < .001), whereas the ratio of choline to creatine was significantly decreased (P < .001) compared with normal values published for this age group. Lactate levels were not significantly elevated.
CONCLUSION: Kernicterus has a characteristic signature that is detectable on 1H-MR spectroscopy. Our results are generally in agreement with what is known about bilirubin pathology, and the finding of increased glutamate and glutamine and decreased choline ratios indicates a possible link between hepatic encephalopathy and kernicterus. This observation may help in elucidating the pathophysiology of bilirubin neurotoxicity.
Kernicterus, or bilirubin encephalopathy, is a relatively rare disease, but it has become more prevalent in recent years as a result of early hospital discharge, increased practice of breastfeeding (1,2), and occurrence of glucose-6-phosphate dehydrogenase deficiency (3,4). Improved understanding of the chemical mechanisms of the brain damage caused by bilirubin could help in suggesting new treatments, which, in conjunction with the treatment of hyperbilirubinemia, may help prevent or reverse bilirubin neurotoxicity.
Bilirubin is one of the end products of hemoglobin metabolism. Neonates, whose bilirubin metabolism and excretion mechanisms are immature, often develop jaundice as a result of excess serum bilirubin (5,6). When serum bilirubin exceeds the binding capacity of albumin, or when the blood-brain barrier is immature or injured, bilirubin can enter the brain (5,7), resulting in encephalopathy called kernicterus (8). Bilirubin neurotoxicity damages specific areas of the brain, including the brain stem, basal ganglia, cerebellar gray matter, and hippocampus. However, the pathogenesis is only partially understood (9).
Neonatal jaundice is easily treatable with phototherapy, albumin infusion, or exchange transfusion (10,11). However, the damage inflicted on the brain by bilirubin is not always reversible. Long-term survivors of kernicterus can have athetoid cerebral palsy, deafness or hearing loss, impairment of upward gaze, and enamel dysplasia of the primary teeth (9).
Abnormally increased signal intensity on T2-weighted MR images of the globus pallidus, subthalamic nuclei, and hippocampus in the subacute and chronic phases of kernicterus are well described (12, 13), and these findings are correlated with gliosis in those regions. MR imaging during the acute phase of kernicterus has also been described (14), with abnormally increased signal intensity on T1-weighted images in the globus pallidus and subthalamic nuclei in neonates with kernicterus. Loss of this T1 marker and conversion to the more permanent change in T2 signal intensity in these regions is reported to occur during the late neonatal period (14).
Some of the neurotoxic effects of bilirubin are gliosis, demyelination (9), and inhibition of glutamate (Glu) uptake by astrocytes (15) in the basal ganglia. 1H-MR spectroscopy should be able to depict these metabolic changes. The objective of this study was to determine whether 1H-MR spectroscopic profiles in infants with hyperbilirubinemia and symptoms of kernicterus provide new insights into the pathophysiology of bilirubin neurotoxicity.
Methods
We enrolled six full-term infants with abnormally elevated serum bilirubin levels (>340 μmol/L) in the first 10 days of life and with MR findings indicative of kernicterus (Fig 1) in this retrospective study. Patients with additional diagnoses, such as hypoxic ischemia, were excluded to reduce variability and to aid in clarifying the role, if any, of lactate in kernicterus. Patient records were reviewed to determine maximum serum bilirubin values and clinical outcomes. The patients were three boys and three girls aged 13 ± 1.6 days (mean ± standard deviation), with a mean maximal bilirubin concentration of 652 ± 127 μmol/L. Follow-up was done at 1 year of age. Our research ethics board approved the study. Informed consent was obtained from the patients’ parents.
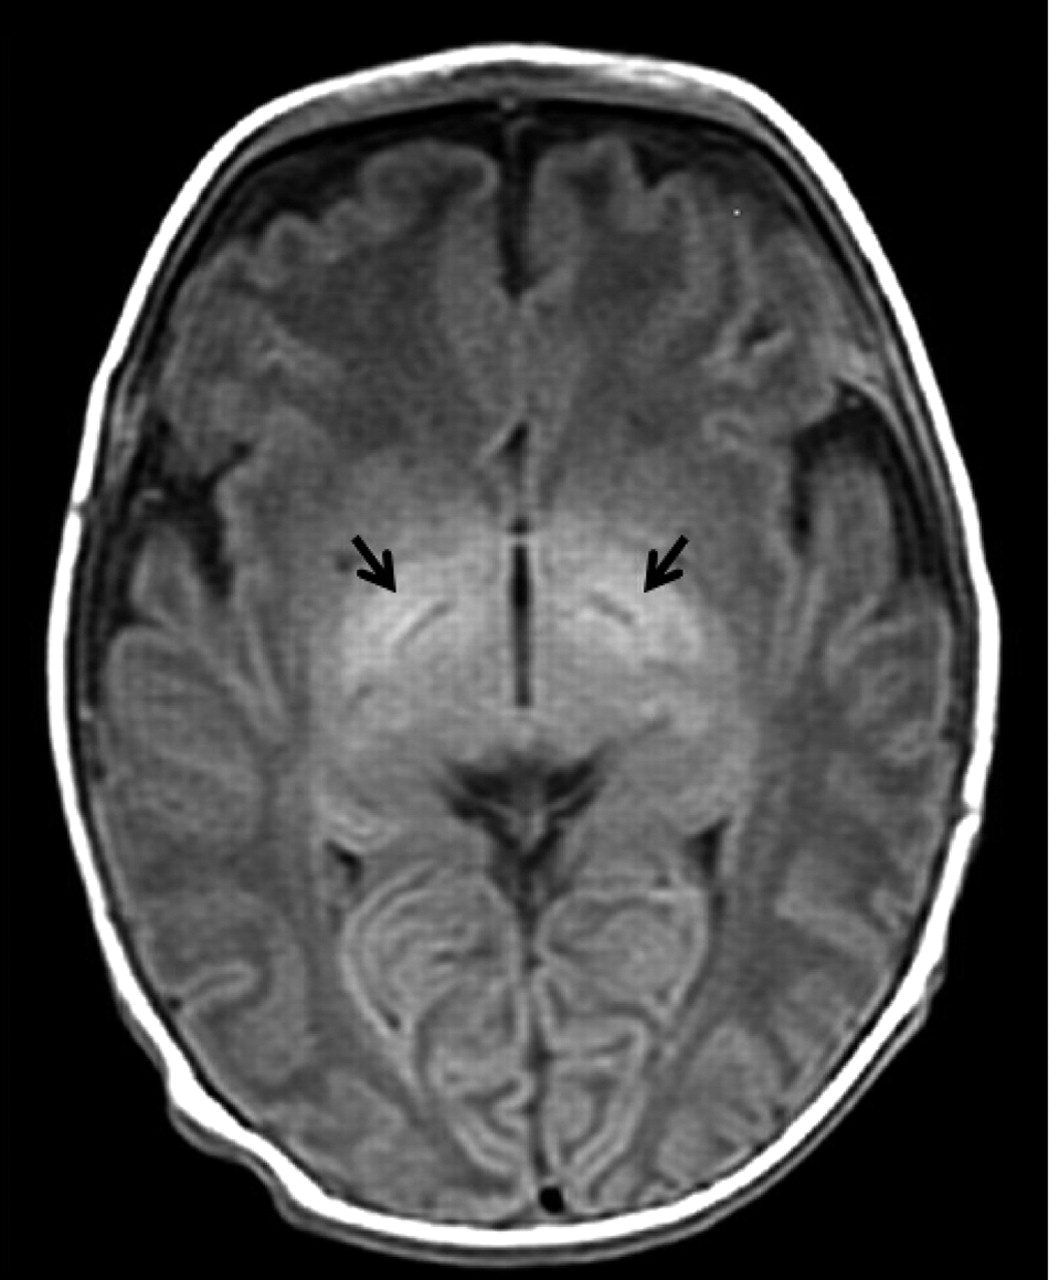
Axial T1-weighted (TR/TE = 516/9) MR image shows abnormal hyperintensity in the globus pallidus (arrows) in an infant with kernicterus.
Imaging Details
Imaging was done with a 1.5-T MR imaging unit (Signa LX; GE Medical Systems, Milwaukee, WI). A standard quadrature head coil was used, and images were acquired by using routine T1-weighted spin-echo and fast spin-echo T2-weighted axial imaging sequences.
1H-MR spectroscopy was done by using a single-voxel point-resolved spectroscopic (PRESS) sequence with a TR/TE of 2000/30 or 144, depending on the clinical protocol at the time of the examination averaged over 256 scans, with voxels of 3–16 cm3 placed in the basal ganglia (Table 1). Saturation bands were not applied in any patient, and regions of interest were placed such that CSF was always avoided. Spectral acquisition was done with 2500 spectral data points. Data were not zero-padded or filtered before analysis. Spectral quality was assessed by using the signal-to-noise ratio and full width at half maximum of the unsuppressed water peak, which were 20 ± 8.5 and 2.84 ± 1.1 Hz, respectively.
Metabolite ratios
Quantitation
Quantitative analysis of the 1H-MR spectroscopy data was done by using a linear combination model, LCModel (16) and basis spectra provided with the software (Fig 2). During the study period, our institution changed the TE of the MR spectroscopic protocol from 30 to 144 msec. This affected our LCModel results because metabolite T2 values differed in vivo and in vitro (the condition under which the LCModel basis sets are collected). Therefore, to perform this retrospective analysis, we calculated a set of correction factors for each metabolite by using seven scans obtained in infants younger than 1 month at both TEs (Table 2). Metabolites were expressed as a ratio relative to total Cr for comparison with published brain metabolite values in healthy infants (17) and for cross-institutional comparison. We used the mean metabolite concentrations reported for term infants measured in the thalamus. Because Glu and Gln are virtually indistinguishable at 1.5 T, we used the combined signal intensity, or Glx, of these metabolites.
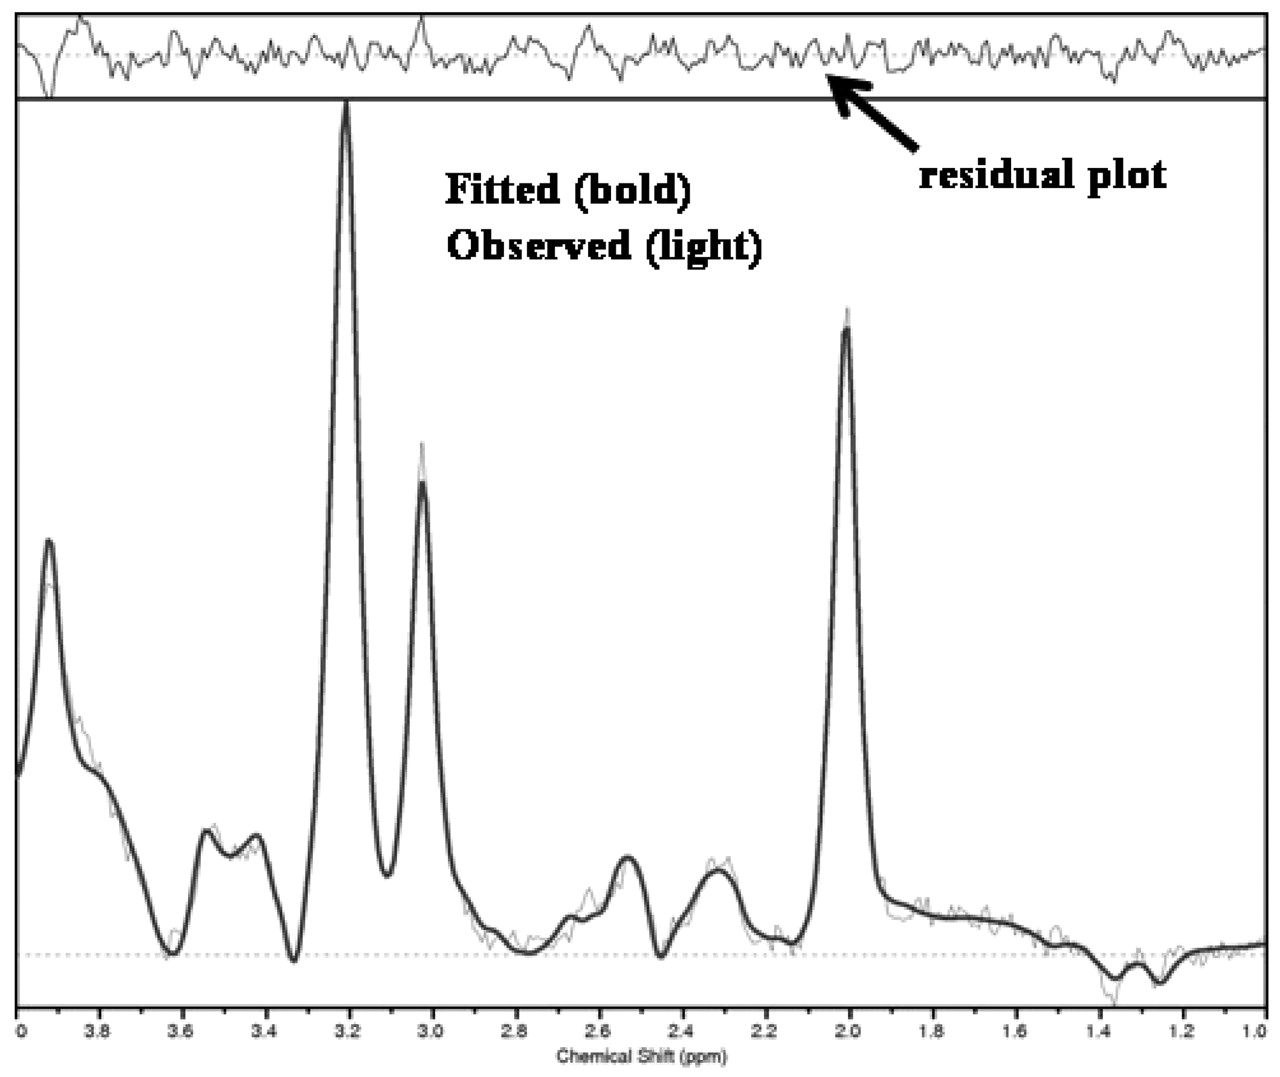
Patient 4. LCModel analysis from a spectrum obtained at TE = 144 msec. Obtained (light) spectrum is overlaid on the fitted (bold) plot. Residual plot (fitted minus observed) is normally distributed about a mean of 0, indicating an excellent global-model fit.
Correction factors
Statistical Analysis
To compare our results to the published brain metabolite concentrations in healthy infants (17), we first tested for equality of variances (homoscedasticity) between our patient data and normal values by using an F test (18). This was done to choose the appropriate formula for the Student t testing of differences in the means. Subsequently, a two-tailed t test, adjusted (if appropriate) for the failure of equality of variances, was performed to determine whether infants in our study differed from healthy populations. All statistical analysis was considered significant if P < .05 (ie, 95% level of confidence).
Results
Overall, the maximal unconjugated plasma bilirubin level was 652 ± 11.3 μmol/L (Table 3). Four infants developed symptoms of kernicterus, including cerebral palsy and impaired hearing. The remaining two were considered to be developing normally when they were examined a year later, although cerebral palsy is not always evident at this stage of development (Table 3).
Summary of patient data
T1-weighted MR images from patients with kernicterus demonstrated areas of abnormal signal intensity in the globus pallidus (Fig 1). LCModel was able to clearly resolve the Tau and Glx peaks from spectra obtained from this area of the basal ganglia at TEs of 30 and 144 ms (Fig 2).
Homoscedasticity testing revealed that our data variance differed from published normal values for both Tau/Cr (P < .001) and Glx/Cr (P < .001). Using the same F test for homoscedasticity, we calculated no significant differences in variance between our values of NAA/Cr, mI/Cr, and Tau/Cr compared with published values.
Compared with normal values (17), Tau/Cr, Glx/Cr, and mI/Cr were significantly elevated (P < .001), whereas Cho/Cr was significantly decreased (P < .001). NAA/Cr was not significantly different from normal values (Fig 3, Table 1). Clinical outcomes were not correlated with the levels of brain metabolites.

Metabolite ratios relative to Cr in infants with suspected kernicterus based on T1- and T2-weighted imaging findings (kernicterus) compared with normal values (normals). Tau/Cr, Glx/Cr, and mI/Cr were significantly elevated (*; P < .001), whereas Cho/Cr was significantly decreased (**; P < .001).
Discussion
During excitatory synapse activation in the brain, Glu, the most prevalent excitatory neurotransmitter in the brain, is released from presynaptic neurons into the synaptic cleft of synapses. In normal synapses, Glu is taken up by astrocytes and converted to Gln. Bilirubin inhibits this astrocytic uptake of Glu (15). As the Glu-Gln cycle is disrupted in the uptake and conversion to Gln, the extracellular space is likely the source of elevated Glx/Cr signal intensity (possibly in the form of Glu). This increased extracellular Glu concentration results in overstimulation of postsynaptic neurotransmitter receptors, including n-methyl-d-aspartate (NMDA) receptors. This overstimulation of neurons can lead to excitotoxic neuronal death (19). In vitro experiments with cultured neurons have demonstrated a bilirubin associated increase in NMDA receptor sensitivity (20), supporting our in vivo data.
Tau, or 2-aminoethanesulfonic acid, is classified as a unique amino acid and a conditionally essential nutrient important in mammalian development and a salt for bile acid conjugation. Structurally, it is similar to alanine; however, the carboxy group is replaced with a SO3− moiety. In the liver, Tau is important in detoxification mechanisms. In the brain, it is one of the defense mechanisms against excitotoxic conditions, as it is an osmoregulator and neuromodulator (21). Overstimulation of NMDA Glu receptors induces the release of Tau (22). Therefore, the increased Tau/Cr signal intensity seen in our data (Fig 3) is likely a direct result of excess Glu. If this is the case, then perhaps Tau could be added to the total parenteral nutrition administered to babies with jaundice as a preventive measure.
Postmortem examinations of babies with kernicterus have shown moderate-to-marked loss of neurons, demyelination, and gliosis in the basal ganglia (9). On 1H-MR spectroscopy, increased mI and Cho values have been observed under such circumstances (23). We observed an increase in mI/Cr; however, we also observed a concurrent decrease in Cho/Cr. We suggest that the increase in Cho is more apparent in later stages of the disease rather than in the acute phase, as we report here. Concurrently, we suggest that mI, at increased levels, functions as an osmolyte in the early stage of kernicterus, as is seen often in other forms of neurotoxicity (24).
Studies of hepatic encephalopathy have shown increases in Gln and Glu and decreases in Cho and mI (25). Kernicterus and hepatic encephalopathy may have some similarities, as they both affect the same regions of the brain. One study showed a decrease in Cho with no corresponding decrease in mI in the presence of cirrhosis (26). Studies at higher field strengths than ours would allow resolution of Glu and Gln signals and a determination of whether Glu mediates bilirubin toxicity.
Despite an increase in the incidence of kernicterus, few infants develop the disease. Of those who do develop kernicterus, many are have other problems, such as sepsis, acidosis, or ischemia; this might have confounded our results. A large patient population might allow for a correlation between brain metabolite levels and clinical outcomes. In addition, the ages of our patients made the inclusion of age-matched control subjects difficult.
Conclusion
Kernicterus has a characteristic signature on 1H-MR spectroscopy. Our results mostly agreed with what is known about bilirubin pathology, and the decreased Cho/Cr result indicated a possible link between hepatic encephalopathy and kernicterus, which may help elucidate the pathophysiology of bilirubin neurotoxicity. This knowledge, in turn could help us find a treatment to prevent the brain damage caused by excess bilirubin or to provide a safer alternative to exchange transfusion in the case of acute kernicterus.
Footnotes
Supported by the Behavioral Research and Imaging Network, Ontario Research and Development Challenge Fund.
Presented in part at the European Society for Magnetic Resonance in Medicine and Biology, Rotterdam, the Netherlands, September 18–21, 2003.
References
- Received August 4, 2004.
- Accepted after revision November 11, 2004.
- Copyright © American Society of Neuroradiology
In this issue


Jump to section
Related Articles
Cited By...
- No citing articles found.