
Abstract
BACKGROUND AND PURPOSE: Noninvasive assessment of the hemodynamic significance of carotid stenosis is often performed with MR angiography and supplemented with carotid Doppler sonography. Phase contrast with vastly undersampled isotropic projection reconstruction (PC-VIPR), a novel MR imaging technique, accelerates phase-contrast MR flow imaging and provides both images of the vessels and measurements of blood-flow velocities. For this study, we determined the accuracy of PC-VIPR blood-flow velocity measurements to determine pressure gradients across an experimental carotid stenosis.
MATERIALS AND METHODS: A focal stenosis was surgically created in each common carotid artery of 6 canines. Digital subtraction angiography (DSA) was performed, and the degree of stenosis was determined using the North American Symptomatic Carotid Endarterectomy Trial methodology. A microcatheter was positioned in the carotid artery proximal and distal to the stenosis, and pressures were measured in the vessel through the catheter. PC-VIPR was then performed on a 1.5T MR imaging scanner with parameters producing 0.8-mm isotropic voxel resolution. From the velocity measurements, pressure gradients were calculated from the Navier-Stokes relationship to compare with the pressures measured by a catheter.
RESULTS: Carotid stenoses in the 50%–85% range were produced in the 12 arteries. Pressure gradients across the stenoses ranged from 6 to 26 mm Hg. The pressure gradient calculated from the PC-VIPR data correlated (r = 0.91, P < .0001) with the actual pressure measurements.
CONCLUSION: With PC-VIPR, a novel MR imaging technique, the hemodynamic effect of a stenosis on flow and pressure can be evaluated.
Stroke is the third leading cause of death and disability in the United States, with more than 700 000 new strokes occurring each year.1 Up to 25% of these strokes are related to stenosis of the carotid arteries.1 Because of the significant impact on patient outcomes, much work has been done over the past 20 years to reduce this effect. Many clinical trials such as the North American Symptomatic Carotid Endarterectomy Trial (NASCET),2 the European Carotid Surgery Trial (ECST),3 and the Veteran Affairs Cooperative Trial4 have demonstrated that surgical revascularization of the stenosis will reduce the future stroke risk in certain patient populations, related to degree of narrowing. Because of the correlation of patient risk reduction in groups harboring a certain degree of stenosis, it is paramount to be able to accurately and noninvasively determine the degree of stenosis.
Clinical evaluation of carotid stenosis has changed very little during the last decade with correlation of 2 noninvasive studies such as MR angiography (MRA) and carotid Doppler sonography being the recommended preoperative imaging techniques.5–7 In the interventional coronary literature, previous work has been performed that demonstrated that measurable pressure gradients can be useful to determine the significance of a stenosis.8–10 Evaluation of iliac and renal stenosis has similarly shown that pressure gradients can help further determine the significance of a stenosis.11–16 However, these measurements were performed during angiography, requiring an invasive procedure, and are not practical in the carotid arteries, in which there is an increased risk of a thromboembolic event when the stenosis is crossed with a wire or microcatheter.
We have developed a novel method for obtaining phase-contrast images with phase-contrast with vastly undersampled isotropic projection reconstruction (PC-VIPR)17,18 Using this method, we can obtain anatomic images with similar resolution to standard 3D time-of-flight (TOF) examinations, but with greater anatomic coverage. Additionally, 3-directional velocity images are obtained at up to 50 times faster than conventional 3D Cartesian phase-contrast examinations when one is considering acquisition time, voxel size, and anatomic coverage. This rapid imaging technique can also be used in conjunction with cardiac gating to generate quantitative time-resolved blood-flow measurements in clinically feasible imaging times. This time-resolved information can be retrospectively analyzed to calculate intravascular pressure gradients.
Given the current clinical absence of a noninvasive gold standard method of imaging, we believe that MR imaging may achieve this status if supportive physiologic data can improve the anatomic accuracy of determining the significance of a stenosis. For this study, we wanted to determine the feasibility of the PC-VIPR sequence to measure pressure gradients across an experimental canine carotid stenosis.
Materials and Methods
Surgery and Angiography
The protocol for the study was approved by the institutional animal care committee. Six female beagles weighing approximately 30 pounds each underwent surgery to create common carotid artery stenoses. All surgeries were performed with the animals under general endotracheal anesthesia. A plastic nonferromagnetic cable tie was secured around each carotid artery. One week of recovery was allowed to resolve any evidence of vasospasm or irritative effects of the surgery. The common carotid arteries all measured between 3.5 and 4 mm in diameter.
With the animals under general anesthesia and by using standard techniques, a digital subtraction angiogram (DSA) was obtained in the frontal and lateral projections of the carotid arteries. Digital images documented the degree of stenosis by using methods outlined in the NASCET trial.2 An Excel-14 microcatheter (lumen diameter, 0.017 inches; Boston Scientific Corp, Fremont, Calif) was then manipulated under fluoroscopic monitoring into a position 1 cm proximal to the stenosis and connected to a Propaq arterial pressure monitor (Protocol Systems, Beaverton, Ore). Systolic, diastolic, and mean arterial pressures were observed for a period of 2 minutes to observe stability of the reading. Arterial waveforms were observed to ensure consistency and appropriate catheter readings. The data were then recorded with the corresponding arterial waveform, the catheter was manipulated into a position at the stenosis and subsequently 1 cm distal to the stenosis, and the sequence repeated. The pressure gradient across the stenosis was calculated by subtracting the mean pressure distal to the stenosis from the mean pressure proximal to the stenosis.
MR Imaging
With the animal still under anesthesia and the catheter removed, the beagle was placed in a 4-channel knee coil and imaged with a 1.5T MR imaging scanner (TwinSpeed Excite HD, Version 12.0, GE Healthcare, Waukesha, Wis). Electrocardiogram (ECG) leads were placed. Standard contrast-enhanced and 3D TOF images were obtained. PC-VIPR was acquired with ECG gating at the following parameters: TE/TR of 3.4/8.8 ms and temporal resolution of 40 ms, 256 × 256 × 256 acquisition matrix, 20 × 20 cm FOV, 15-cm z-axis excitation slab, 32-kHz readout bandwidth, 75% fractional readout, and a velocity-encoding value of 150 cm/s. The total imaging time for the PC-VIPR scan was 10 minutes, 14 seconds. Voxel sizes of the TOF and contrast-enhanced examinations were 0.7 × 0.7 × 1.4 mm and 0.5 × 0.5 × 2.0 mm, respectively, compared with 0.78125 × 0.78125 × 0.78125 mm (0.477 mm3) in the PC-VIPR examination. Data at individual timeframes within the cardiac cycle were reconstructed by using an adaptive-width temporal filter. Each image was reconstructed by using the central portions of k-space sampled during a narrow time segment and the periphery of k-space sampled from a broader temporal window. For each timeframe, dynamic velocity images were reconstructed via phase-difference processing. Anatomic images were processed from the composite complex difference volumetric dataset.
Dynamic phase-difference images were then analyzed to determine flow rates and trans-stenotic pressure gradients. Flow rates across the stenosis were measured by using a standard GE flow analysis package on the axial flow images. Pressure gradients were determined on the basis of iterative methods that have been validated in both phantom and animal models.19–22 This technique is based on the Navier-Stokes equations, which simplify more complex relationships by assuming the fluid to be both incompressible and Newtonian. Arterial blood flow generally satisfies these assumptions with a dynamic viscosity of approximately 4 cP. A 4-step process was used in the implementation of the technique, consisting of vessel segmentation, pressure-gradient determination, integrative pressure determination, and iterative refinement. Vessel segmentation was performed with a user set threshold, which was followed by an anti-island filter. This filter smoothed the vessel wall and removed small isolated regions that cloud images and introduce additional error. Pressure gradients were then determined by using central difference equations with corrections for errors occurring at the edge of the vessel. Next, an initial pressure map was determined by using a simple seed-point method and was iteratively refined by using a path-averaging algorithm.19 Dynamic pressure maps were then averaged for comparison with in vivo measurements, and the calculation of pressure from the PC-VIPR data was compared with the pressure differences that were measured between 1 cm proximal and 1 cm distal to the stenosis.
Data Evaluation
The degree of carotid stenosis was estimated on the basis of the NASCET criteria from the projection with the most significant stenosis.2 The measurements were performed by printing the image and measuring the vessel with calipers. Pressure gradients calculated from the PC-VIPR data were compared with the actual pressure measurement (catheter) with regression analysis.
Statistics
The calculated pressure gradients were compared with the actual pressure gradients (catheter measurement), and the correlation was tested with a Z-test by using Fisher r to z transformation. Further agreement between the pressure measurements was evaluated by using 95% confidence intervals (CIs) on the difference of the values as described by Bland and Altman.23,24
Results
In the 6 canines, DSA, catheter pressure measurements, contrast-enhanced MR images, TOF MR images, and PC-VIPR images were acquired and were deemed technically adequate. The animals demonstrated no evidence of complication from angiography.
DSA showed a smoothly tapering carotid stenosis in each carotid artery, ranging from 50%–85%. In 1 carotid artery with 85% stenosis, signal-intensity loss present at the stenosis on MR imaging precluded an accurate evaluation of the stenosis with PC-VIPR. In the other cases, the stenosis demonstrated in the DSA was also demonstrated with the conventional MRA techniques and with PC-VIPR (Fig 1).

Sample carotid stenosis images from contrast-enhanced MRA (A), PC-VIPR MRA (B), 3D Time of Flight MRA (C), and DSA (D).
In each carotid artery, pressure waveforms similar to those from direct invasive monitoring were obtained with the time-resolved PC-VIPR data (Fig 2A). Pressure maps created from the velocity data showed pressure drops across the carotid stenosis (Fig 2B). The pressure gradient over the stenosis calculated from the PC-VIPR data for the 12 carotid arteries ranged from 8 to 20 mm Hg.

Sample dynamic pressure curve (A) and average pressure color map (B) from the PC-VIPR technique obtained across the carotid artery stenosis.
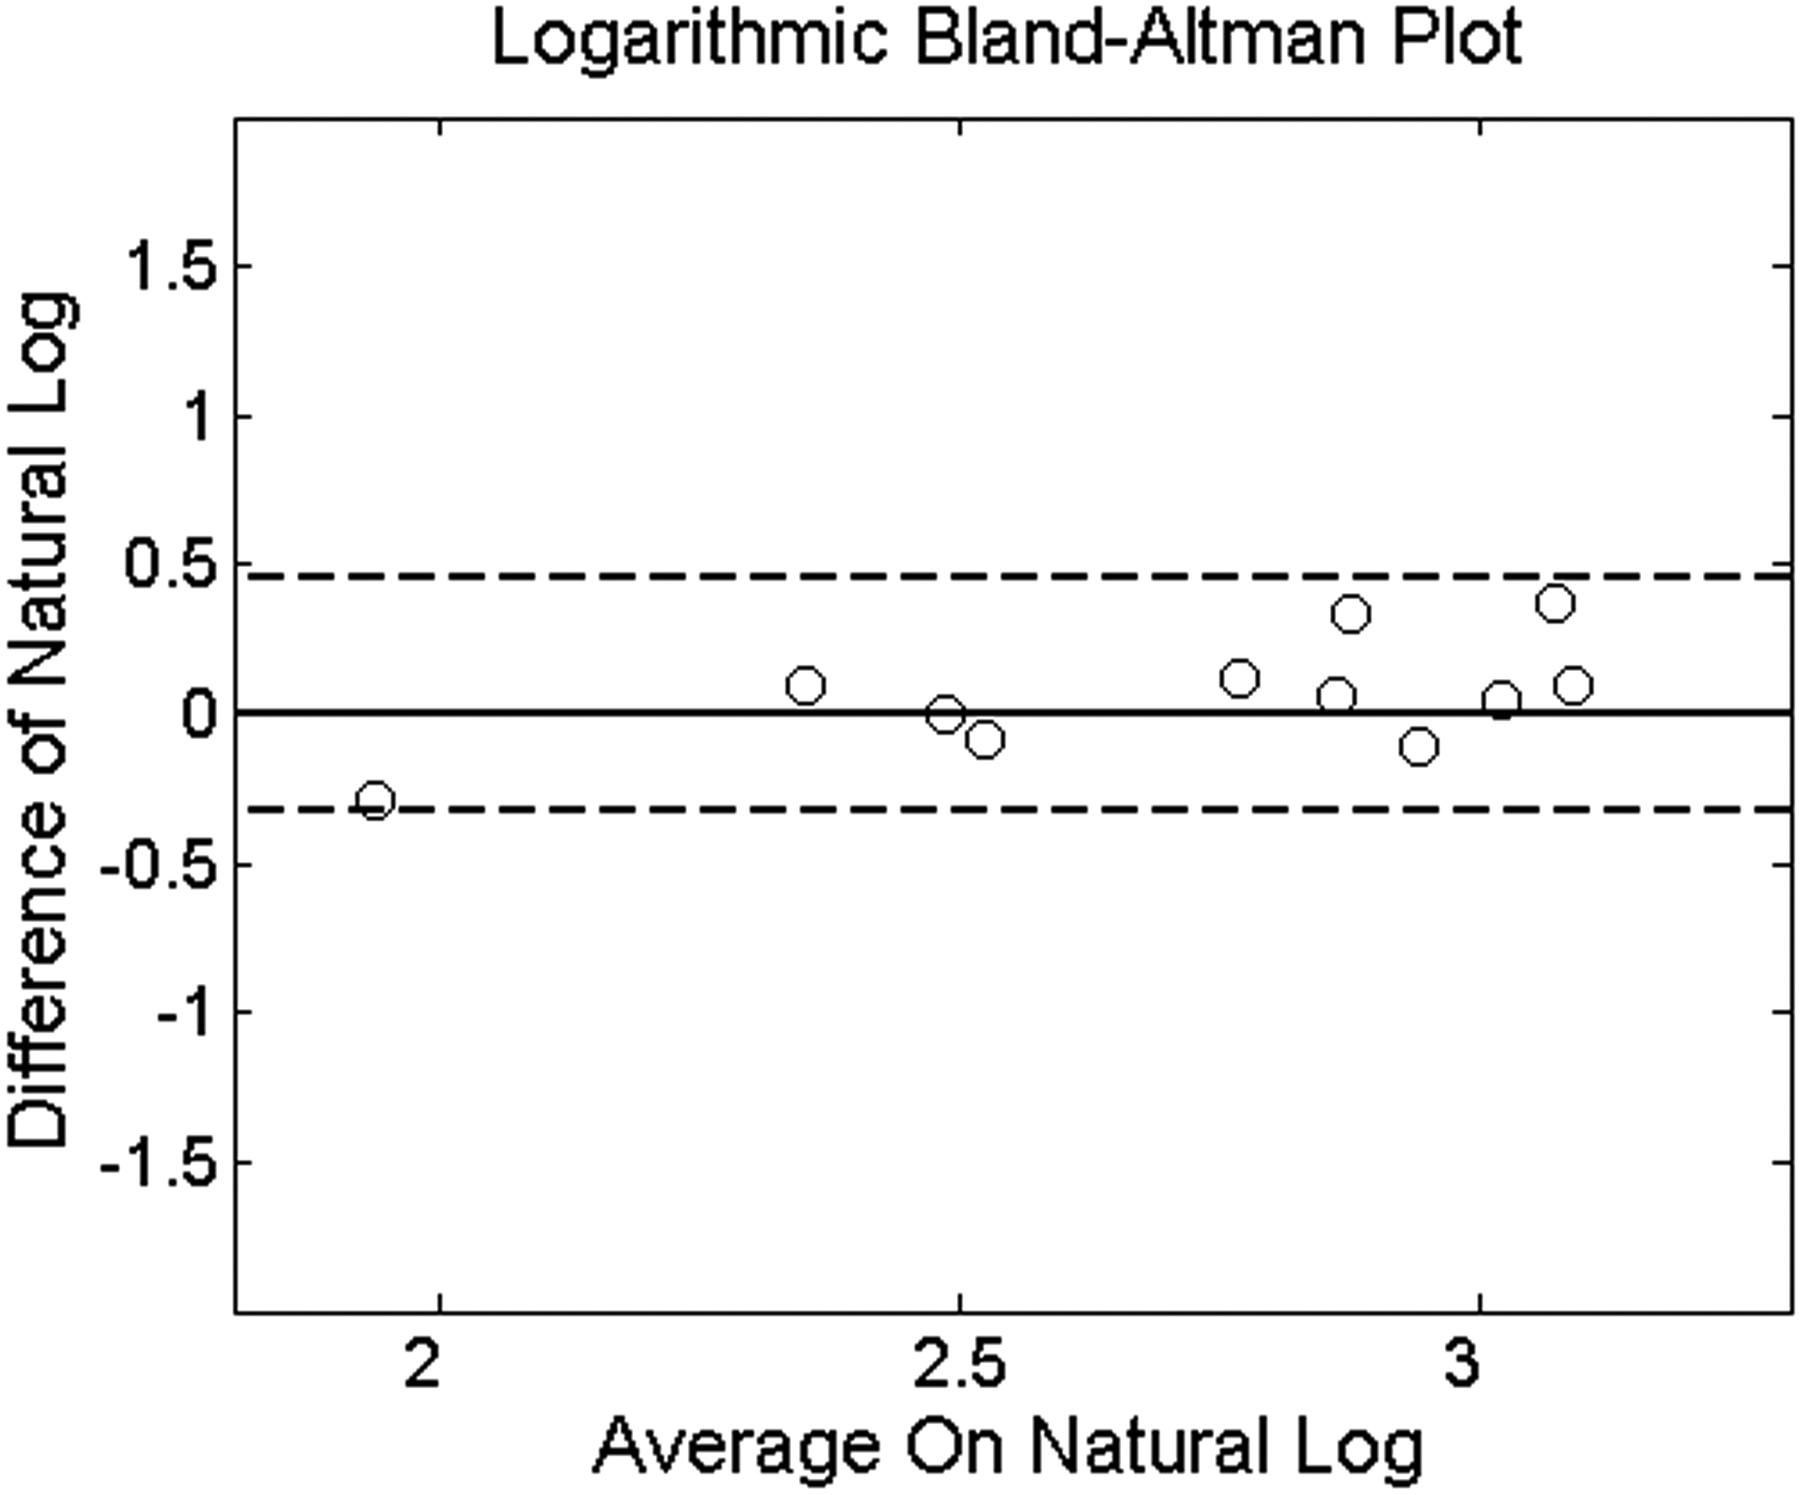
The Z-test showed a high degree of correlation (r = 0.86, P = .0006) in the pressure gradients obtained noninvasively with PC-VIPR and invasively with a microcatheter (Fig 3). Figure 3 also shows inflation of variance as the pressure values increase; thus, we used the logarithm-transformed data to smooth the variance.23,24 We obtained a 95% CI for the logarithm of the pressure gradients measured from the catheters subtracted from the logarithm of the calculated PC-VIPR measurements (−0.33, 0.46). This means that 95% of the VIPR measurements are expected to be 0.72–1.58 times the corresponding catheter measurements. The correlation between the logarithm-transformed pressure measurements was 0.91 (P < .0001) (Fig 4).

Plot showing correlation of actual measured microcatheter values versus calculated pressure gradients from PC-VIPR across the stenosis.

Bland-Altman plot showing the correlation of the logarithm-transformed actual measured microcatheter values versus the logarithm-transformed calculated pressure gradients from PC-VIPR across the stenosis. Dashed line represents the 95% CI at −0.33 and 0.46.
Microcatheter pressure tracings showed systolic and diastolic variations with minimal deviation during the period of recording pressure in each animal. These variations due to systole and diastole were greater proximal to the stenosis than distal to it (Fig 5). Differences in mean arterial pressure proximal and distal to the stenosis ranged from 6 to 26 mm Hg in the 12 carotid arteries. The pressure gradient and the degree of stenosis did not correlate closely (Fig 6).

Sample arterial waveform tracings from the microcatheter at least 1 cm distal to the carotid stenosis (top row), at the level of the stenosis (middle row), and at least 1 cm proximal to the stenosis (bottom row). The adjacent values represent the mean arterial pressures as well as the systolic (S) and diastolic (D) values generated by the Propaq arterial pressure monitor.
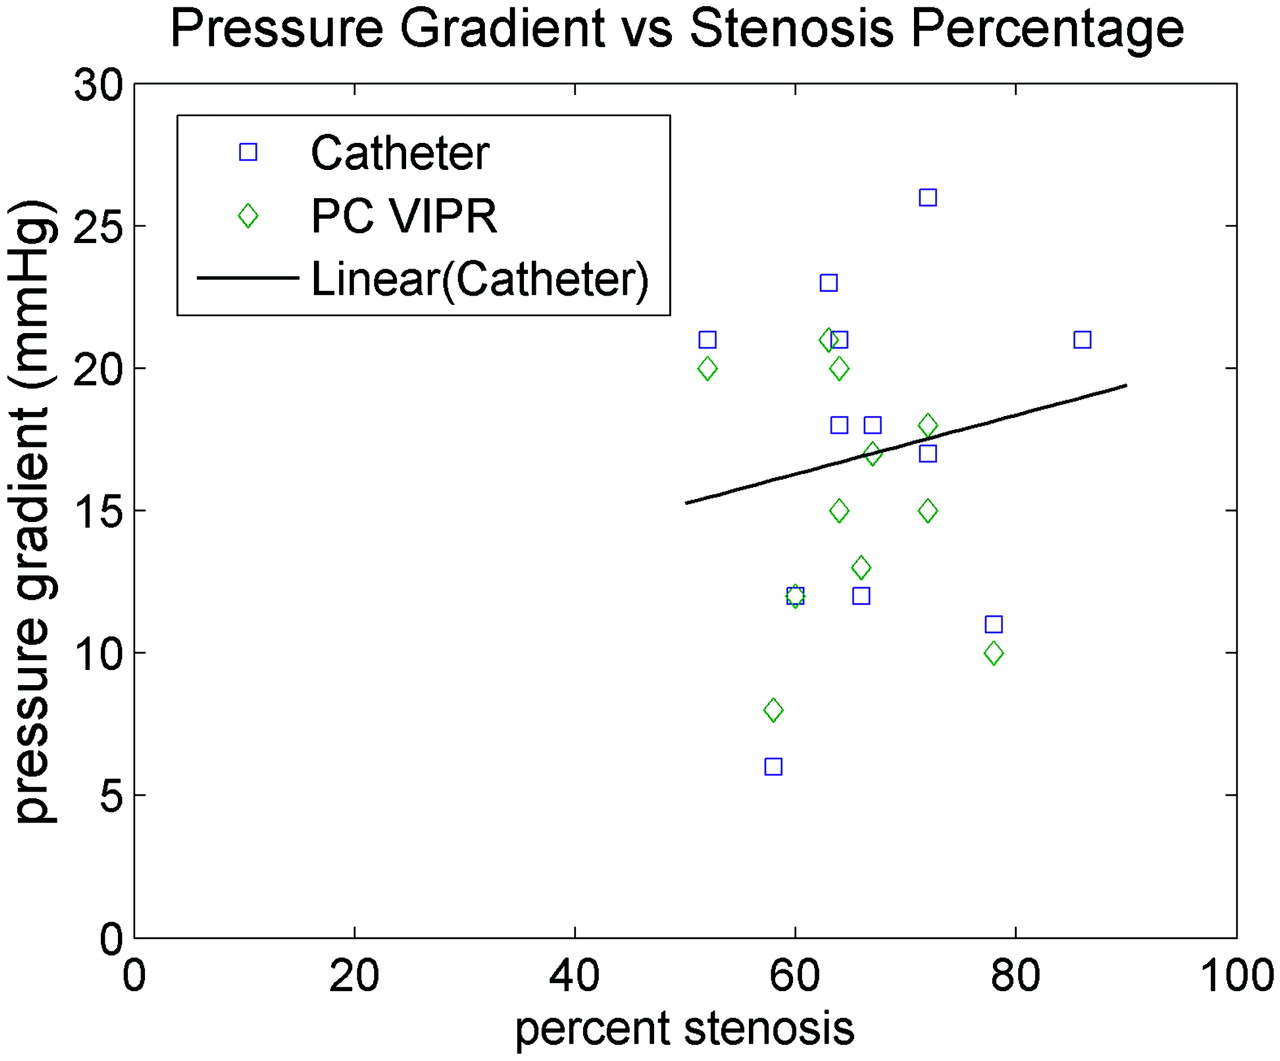
Plot showing that pressure changes are identified at all of the observed degrees of stenosis with weak correlation between the degree of stenosis and the pressure gradient due to a high variability in pressure changes.
Discussion
This study shows that in animals with surgically induced carotid stenosis greater than 50%, PC-VIPR can demonstrate the stenosis and estimate the physiologic significance of the stenosis. This study in animals was performed as a proof of the principle that a fast phase-contrast MR imaging technique with good temporal and spatial resolution demonstrates both the anatomic changes in the vessel and their effect on flow. The number of animals was limited but highly significant correlations (r = 0.91, P < .0001) were found between the pressure gradients calculated from the PC-VIPR sequence and the pressures gradients measured with a catheter.
PC-VIPR is novel phase-contrast MR imaging technique designed to purposefully undersample the periphery of k-space, which allows image-acquisition rates up to 50 times faster than standard Cartesian imaging.17,18 By design, this technique yields increased spatial resolution and greater anatomic coverage. Quantitative flow and velocity information is the underlying strength of phase-contrast techniques. This allows mathematic analysis of the data with the Navier-Stokes equation to generate pressure gradients across the region of stenosis.
One of the weaknesses of this study is that the stenosis produced surgically in these animals does not replicate the stenoses resulting from atherosclerosis. The longer irregular stenosis in patients with atherosclerosis may result in different flow patterns than those in this study. Although the pressure gradients calculated from PC-VIPR correlated well with the pressure gradients measured, those calculated from PC-VIPR had a smaller range. Although in the PC-VIPR measurements the range was 8–20 mm Hg, in the actual recordings it was 6–26 mm Hg. Which measurement of pressure in this study was more accurate cannot be determined. Possible explanations include damping of the pressure measurement in the catheter system or partial volume averaging effects in the PC-VIPR flow data.
Furthermore, the effect of the long TE on the accuracy of flow measurements in the face of very complex flow is not known. PC-VIPR is relatively insensitive to dephasing from turbulent flow because of the high resolution and isotropic acquisition of the PC-VIPR pattern. We have tried to reduce the TE by using balanced gradients and a fractional readout, which may result in a small increase in error or possible failures in complex flow. However, we have found that the size of the vessel is more important than tortuosity or the complexity flow for success with this sequence.
Results from this study agree well with those of other studies in which pressure gradients have been made. In this study, pressure gradients of up to 26 mm Hg were present in the stenoses that were surgically induced. In renal arteries, a pressure gradient of more than 20 mm Hg was shown to have clinical significance.11 In the iliac arteries, stenoses have been reported to be significant at 5–10 mm Hg.12,13
It has been well documented that stenosis of ≥70% can cause signal-intensity dropout at the site of stenosis on standard 3D TOF MRA.25,26 This occurred once in this study as well as in some of our preliminary work. When it occurred, there was failure of the PC-VIPR to produce a flow or pressure-gradient result because of a loss of data at the stenosis site. During our development of the PC-VIPR sequence, we improved the resolution by decreasing the FOV, resulting in smaller isotropic voxels (0.78125 mm), which have helped to minimize this artifact. However, clinically this change very likely will not result in a significant problem because it has been well established that symptomatic patients with stenosis ≥70% should undergo surgery.2,3 The stenoses that result in a 50%–70% narrowing are the group that requires further characterization.
PC-VIPR allows MR imaging to provide further physiologic data about a stenosis. Given the varied pressure gradients at which stenoses are deemed significant, depending on anatomic location, we are uncertain of the level of pressure change at which a carotid stenosis will become significant. In the future, we hope to establish with further studies that a threshold exists at which the pressure gradient, as determined by PC-VIPR, becomes significant, such as is seen with duplex sonographic velocities.
Conclusion
PC-VIPR, a novel MR imaging technique, can yield trans-stenotic gradient pressures that highly correlate with those obtained invasively. This result allows the degree of stenosis of a vessel and the effect of the stenosis on flow to be evaluated with a single technique. Coupling physiologic and anatomic data may improve accuracy and consolidate noninvasive imaging evaluation of arterial stenosis. Further work in this area is currently underway.
References
- Received December 6, 2005.
- Accepted after revision February 27, 2006.
- Copyright © American Society of Neuroradiology
In this issue


Jump to section
Related Articles
Cited By...
- Hemodynamic Changes in Patients with Arteriovenous Malformations Assessed Using High-Resolution 3D Radial Phase-Contrast MR Angiography
- In Vivo Evaluation of Quantitative MR Angiography in a Canine Carotid Artery Stenosis Model
- Fast Whole-Brain 4D Contrast-Enhanced MR Angiography with Velocity Encoding Using Undersampled Radial Acquisition and Highly Constrained Projection Reconstruction: Image-Quality Assessment in Volunteer Subjects
- Velocity Measurements in the Middle Cerebral Arteries of Healthy Volunteers Using 3D Radial Phase-Contrast HYPRFlow: Comparison with Transcranial Doppler Sonography and 2D Phase-Contrast MR Imaging