
Abstract
BACKGROUND AND PURPOSE: The dynamics of brain-water content associated with hemodialysis in patients with severe azotemia remains obscure. To investigate whether either interstitial or cytotoxic edema is responsible for dialysis disequilibrium syndrome (DDS), we used diffusion-weighted MR imaging (DWI) to measure the apparent diffusion coefficient (ADC), which is sensitive for detecting tissue water dynamics.
METHODS: Eight consecutive patients with end stage renal disease (ESRD) and blood urea nitrogen level of more than 100 mg/dL (160.9 ± 53.1 mg/dL) were recruited. Conventional MR images, DWI, and clinical manifestations were obtained before and after the 1st hemodialysis. The ADC values were determined for regions of normal-appearing gray and white matter and for regions of hyperintensity of white matter on T2-weighted MR imaging.
RESULTS: Foci of bright areas of white matter were found in all patients on T2-weighted images. The ADC values of the patients with ESRD, in white matter and gray matter before and after hemodialysis, were greater than those of the healthy controls (P < .005). Regarding the impact of hemodialysis, the ADC of frontal lobe white matter increased significantly after hemodialysis (1.09 ± 0.11 versus 1.03 ± 0.11, P = .036). We did not find the specific area of brain edema reported in posterior leukoencephalopathy and the osmotic demyelination syndrome.
CONCLUSIONS: These results suggest that severe azotemia in end stage renal disease leads to interstitial brain edema reflected as increased ADC, and the further increased ADC reflects that edema associated with 1st hemodialysis is interstitial rather than cytotoxic in nature.
Uremic complications of the central nervous system may result from either multiple metabolic derangements associated with end stage renal disease (ESRD) or dialysis procedures. The clinical features include consciousness alterations, headache, nausea and emesis, myoclonus, tremor, and focal or generalized seizures.1 Among these complications, dialysis disequilibrium syndrome (DDS), first described by Kennedy et al, 2 has been observed for more than 30 years. It usually occurs during the last hour of hemodialysis or thereafter, and its diagnosis in patients with ESRD is mainly based on exclusion of other possible central nervous system disorders.1, 3
Most clinical manifestations of DDS are mainly due to brain swelling occurring as a consequence of the dialysis procedure.4, 5 However, the nature of brain edema associated with DDS remains a controversial issue. It has been classified as a cytotoxic edema by Fishman and Chan6 and as an interstitial edema by Milhorat.7 Moreover, there have been conflicting studies concerning the physiologic mechanisms that lead to the formation of edema in DDS. Pappius et al4 introduced the “reverse urea effect,” postulating that a significant urea gradient between blood and brain after dialysis is responsible for the inflow of water to the brain. This hypothesis was confirmed in a study of rats by using diffusion-weighted MR imaging (DWI), which demonstrated a predominant increase in the extracellular water content caused by an osmotic gradient of urea nitrogen across the blood-brain barrier; however, it has never been investigated in humans.8 On the other hand, Arieff et al5 concluded that the formation of idiogenic osmoles was responsible for cytotoxic edema. Furthermore, although DDS and osmotic demyelination syndrome occur in different clinical settings, they have been reported to have similar CT and MR imaging features.9,10 The osmotic demyelination syndrome was originally described in alcoholics and malnourished patients and subsequently reported in patients with low serum osmolarity after rapid correction of hyponatremia.11,12
The apparent diffusion coefficient (ADC) measured by DWI is sensitive for detecting dynamic changes in tissue water. Significant use of this technique has already been made in the imaging and diagnosis of stroke.13–16 To date, there are few reports describing cranial DWI in patients with ESRD at the initiation of hemodialysis therapy.8,10,17,18 The present work using conventional MR imaging and DWI was undertaken to characterize brain-water dynamics occurring in patients with uremia at first hemodialysis and to investigate whether either interstitial edema or cytotoxic edema is responsible for DDS. With measures of the ADC, we sought to clarify the MR imaging characteristics and underlying mechanisms of DDS, the location of brain-water accumulation, and the possible factor of water driving force. Finally, our study may provide clinicians with conventional MR imaging and DWI characteristics to help with the differential diagnosis of neurologic disorders in patients with ESRD, who are subject to uremic encephalopathy or DDS.
Methods
Patients
This study was conducted prospectively. Eight patients with ESRD, 6 men and 2 women, at their first hemodialysis therapy session were enrolled. Their mean age was 53.3 ± 12.2 years (range, 31–68 years). None of the patients had a history of stroke, meningitis, or cerebritis or any clinical or radiologic evidence of neurologic disease. The Human Research Review Committee at the Kaohsiung Veterans General Hospital approved the protocol, and informed written consent was obtained from each patient. The underlying diseases of renal failure in the patients were as follows: diabetic nephropathy in 1 patient, chronic glomerulonephritis in 3, and chronic interstitial nephritis in 4. All patients underwent conventional MR imaging and DWI within 30 minutes before and after hemodialysis, which lasted 2 and one-half hours with diacetyl-cuprophan dialyzers of 1.7-m2 surface area without heparin, a blood flow rate of 150–200 mL/min, and dialysate flow rate of 500 mL/min. The dialysate composition was as follows: Na+, 140 mEq/L; K+, 2 mEq/L; Ca2+, 3.5 mEq/L; HCO3−, 35 mEq/L; and glucose, 200 mg/dL. The dialysate temperature was maintained at 36.5°C. Any significant decrease of blood pressure during hemodialysis would have been treated with intravenous infusion of normal saline; however, none of our patients experienced hypotension during the procedure. Before and after hemodialysis, blood samples were obtained from the artery line to measure urea, glucose, and electrolyte concentrations. Clinical symptoms were observed and recorded. The same MR imaging procedures were also performed during the same period on the 8 sex- and age-matched healthy control subjects who had a mean age of 53.8 ± 12.5 years, (range, 37–73.8 years). The controls consisted of patients who were admitted for physical checkup and had normal renal function.
Conventional MR Imaging and DWI
The conventional imaging studies included axial T1-weighted spin-echo (TR/TE/NEX, 500/30/2), T2-weighted fast spin-echo (TR/TE/NEX, 4000/100/2) with an echo-train length of 8, and fast fluid-attenuated inversion recovery (TR/TI/TE/NEX, 9000/2200/133/1). Sections (5 mm thick) with 2.5-mm intersection gaps, 24-cm FOV, and 256 × 192 matrix were used for all scans.
The imaging sequence for DWI was a single-shot spin-echo echo-planar imaging (TR/TE, 10 000/93 with diffusion sensitivities; b = 0 seconds/mm2 and b = 1000 seconds/mm2). The diffusion gradients were applied sequentially in 3 orthogonal directions to generate 3 sets of axial DWIs. Sections (5 mm thick) with 2.5-mm intersection gaps, 24-cm FOV, and 128 × 128 matrix were used for all scans. The scanning time was 40 seconds. A composite isotropic trace image was made by multiplying the 3 DWIs together and taking the cube root of the result to remove the effects of diffusion anisotropy.
Analysis of diffusion changes was performed by calculating the ADC, based on the Stejskal and Tanner equation,19 as the negative slope of the linear regression line best fitting the points for b versus ln (SI), where SI is the signal intensity from a region of interest (ROI) of the images acquired at the 2 b values. The data from the DWIs were transferred to an Advantage Windows workstation (GE Healthcare, Milwaukee, Wis). ADC maps were generated by performing this calculation on a pixel-by-pixel basis by using FuncTool software (GE Healthcare).
Region-of-Interest Analysis
A neuroradiologist blinded to the clinical data of the subjects placed a uniform ROI on each side of the midline in the following regions: normal-appearing gray matter and white matter of the frontal lobe, the occipital lobe (Fig 1A), and hyperintensities of cerebral white matter (leukoaraiosis) on T2-weighted images (Fig 1B) in the control subjects and patients before and after hemodialysis. ROI measurements were defined on the ADC map by using an Advantage Windows workstation and FuncTool software. Each ROI was drawn semiautomatically by using FuncTool software and a standard size of 44 ± 2 mm2, which is equivalent to 11–13 pixels. The ROI of normal-appearing gray matter and white matter was carefully chosen to rule out the inclusion of invagination of macroscopic CSF-containing space. Contamination of the normal-appearing white matter with the regions of leukoaraiosis was carefully avoided. While drawing the ROIs of leukoaraiosis on the ADC maps, we also simultaneously located the lesions on the conventional images to avoid mistakes.
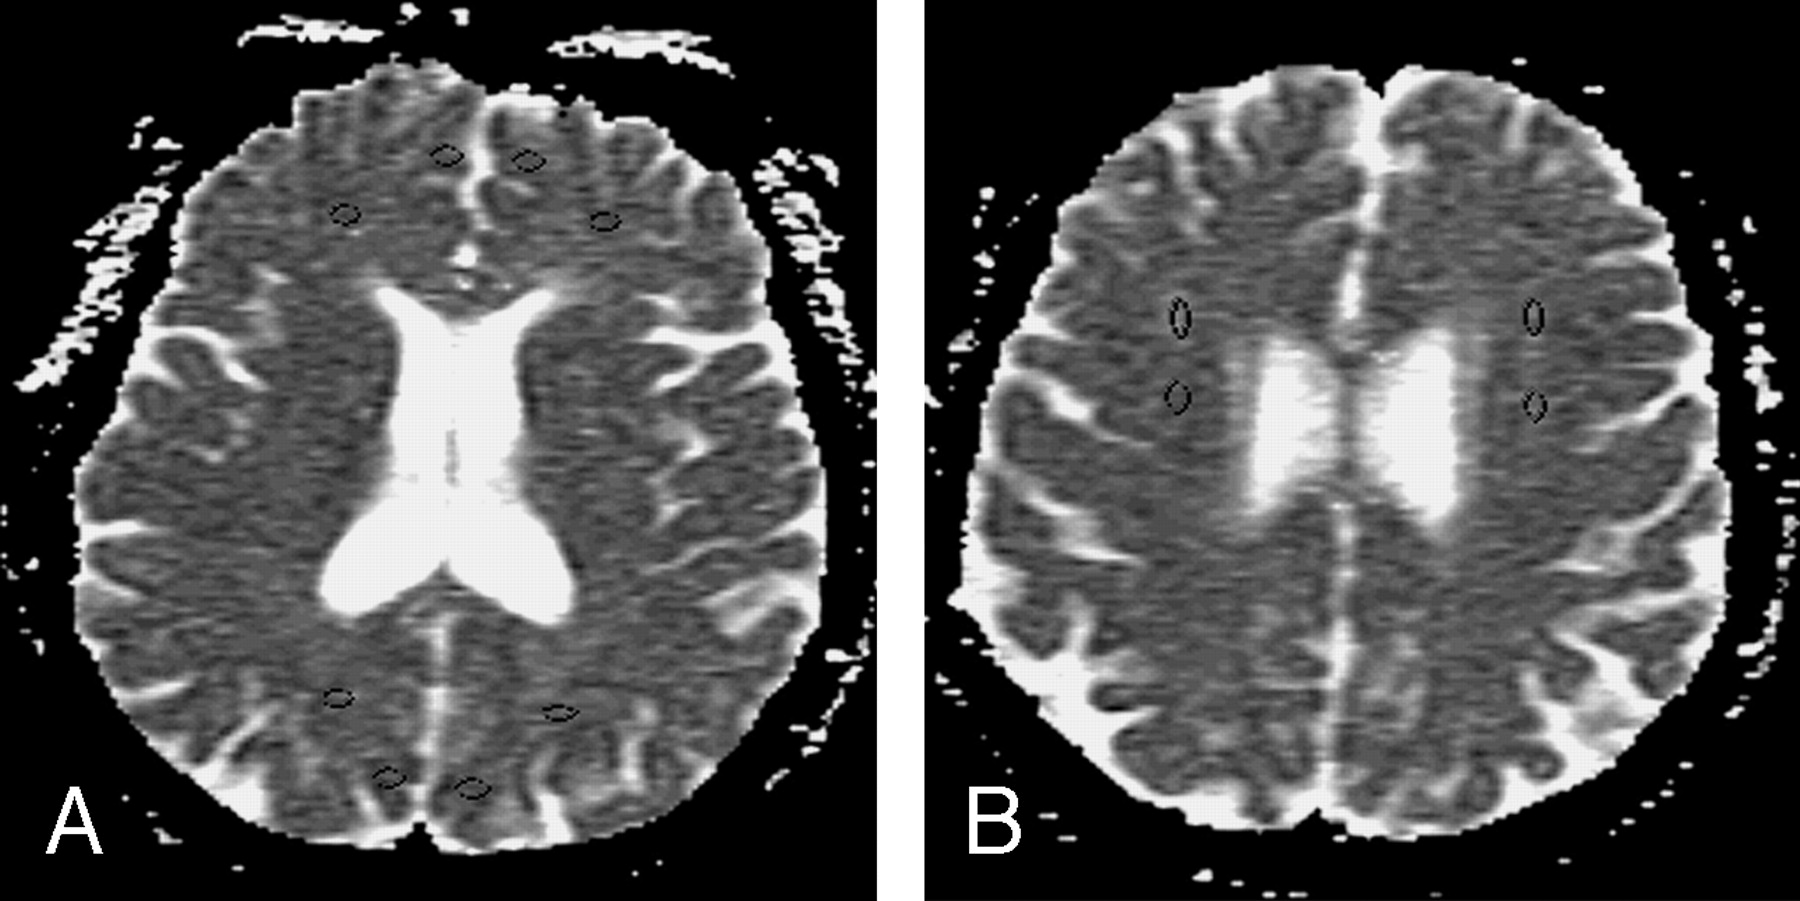
ROIs used in the normal-appearing gray and white matter and leukoaraiosis analysis are superimposed on the axial ADC maps. A, Normal-appearing gray and white matter regions: left and right frontal and occipital lobes. B, Hyperintensities of the cerebral white matter. The ROIs are indicated by a circle.
Statistical Analysis
The average value of the ADC of the right and left counterparts in each patient was used for testing statistical significance in the frontal and occipital lobes. Data are expressed as mean ± SD. Differences within groups for continuous values were evaluated by using the nonparametric Wilcoxon signed rank test, and differences between groups were examined by using the Mann-Whitney U test. Significance was accepted at the level of P < .05.
Results
Seven patients after dialysis presented with headache and/or dizziness, and 1 developed nausea and vomiting. There were no patients who presented with severe neurologic manifestations such as consciousness disturbance and seizure. High predialysis blood urea nitrogen levels may have contributed partially to a much higher incidence of symptomatic DDS in our patients than that described in a previous report.20 All the patients with the aforementioned symptoms recovered completely the next day. Clinical data for the patients with ESRD showed a significant decrease in plasma osmolality (333 ± 12 versus 310 ± 9 mOsm/kg, P < .05), blood urea nitrogen level (161 ± 53 versus 99 ± 52 mg/dL, P < .05), and creatinine level (17 ± 6 versus 11 ± 3 mg/dL, P < .05), but a rise in blood pH level (7.32 ± 0.07 versus 7.39 ± 0.06, P < .05) after hemodialysis. Although a trend in decline of diastolic blood pressure (84 ± 14 versus 78 ± 12 mm Hg, P = .06) and an increase in serum sodium level (132 ± 8 versus 136 ± 5 mEq/L, P = .06) were found, there was no significant difference in systolic blood pressure (161 ± 32 versus 155 ± 29 mm Hg, P = .48).
On conventional MR imaging, bilateral, patchy, and diffuse areas of hyperintensity of the cerebral white matter (leukoaraiosis) were found on T2-weighted and fluid-attenuated inversion recovery images. Similar lesions were found in all 8 patients with ESRD. There were no morphologic changes noted in the cisternal ventricular system before and after hemodialysis on conventional MR imaging. We did not find hyperintense areas in the occipital lobe, which are characteristic of reversible posterior leukoencephalopathy or symmetric hyperintensity involving the central pons, which is characteristic of central pontine myelinosis imaging features on T2-weighted images.
Figure 2 presents the ADC of white matter (Fig 2A) and gray matter (Fig 2B) in healthy controls and patients with ESRD before and after hemodialysis. The mean values of the patients with ESRD in both white matter and gray matter before and after hemodialysis were greater than those of the healthy controls (all P values < 0.005). In most comparisons, only 1 of the 8 patients with ESRD had a ADC value within the range of the healthy subjects (Fig 2). In investigating the effect of hemodialysis, it was found that the mean value of white matter in the frontal lobe increased significantly after hemodialysis (1.09 ± 0.11 versus 1.03 ± 0.11, P = .036). Hemodialysis produced an increase of the ADC in all patients except 1. The ADC of white matter in the occipital lobe, though increased after hemodialysis, did not reach a significant level (1.13 ± 0.15 versus1.09 ± 0.13, P = .061). We also compared the data between the frontal lobe and occipital lobe and did not find a difference in the ADC. We did not find hyperintense areas in the occipital lobe, which are characteristic of reversible posterior leukoencephalopathy, on T2-weighted images in any of our patients after dialysis. All patients with ESRD had changes of leukoaraiosis on the T2-weighted images; the ADC, which was greater than that of normal-appearing frontal white matter (1.32 ± 0.11 versus 1.03 ± 0.11, P < .05); and occipital white matter (1.32 ± 0.11 versus 1.09 ± 0.13, P < .05) in the patients with ESRD before hemodialysis.
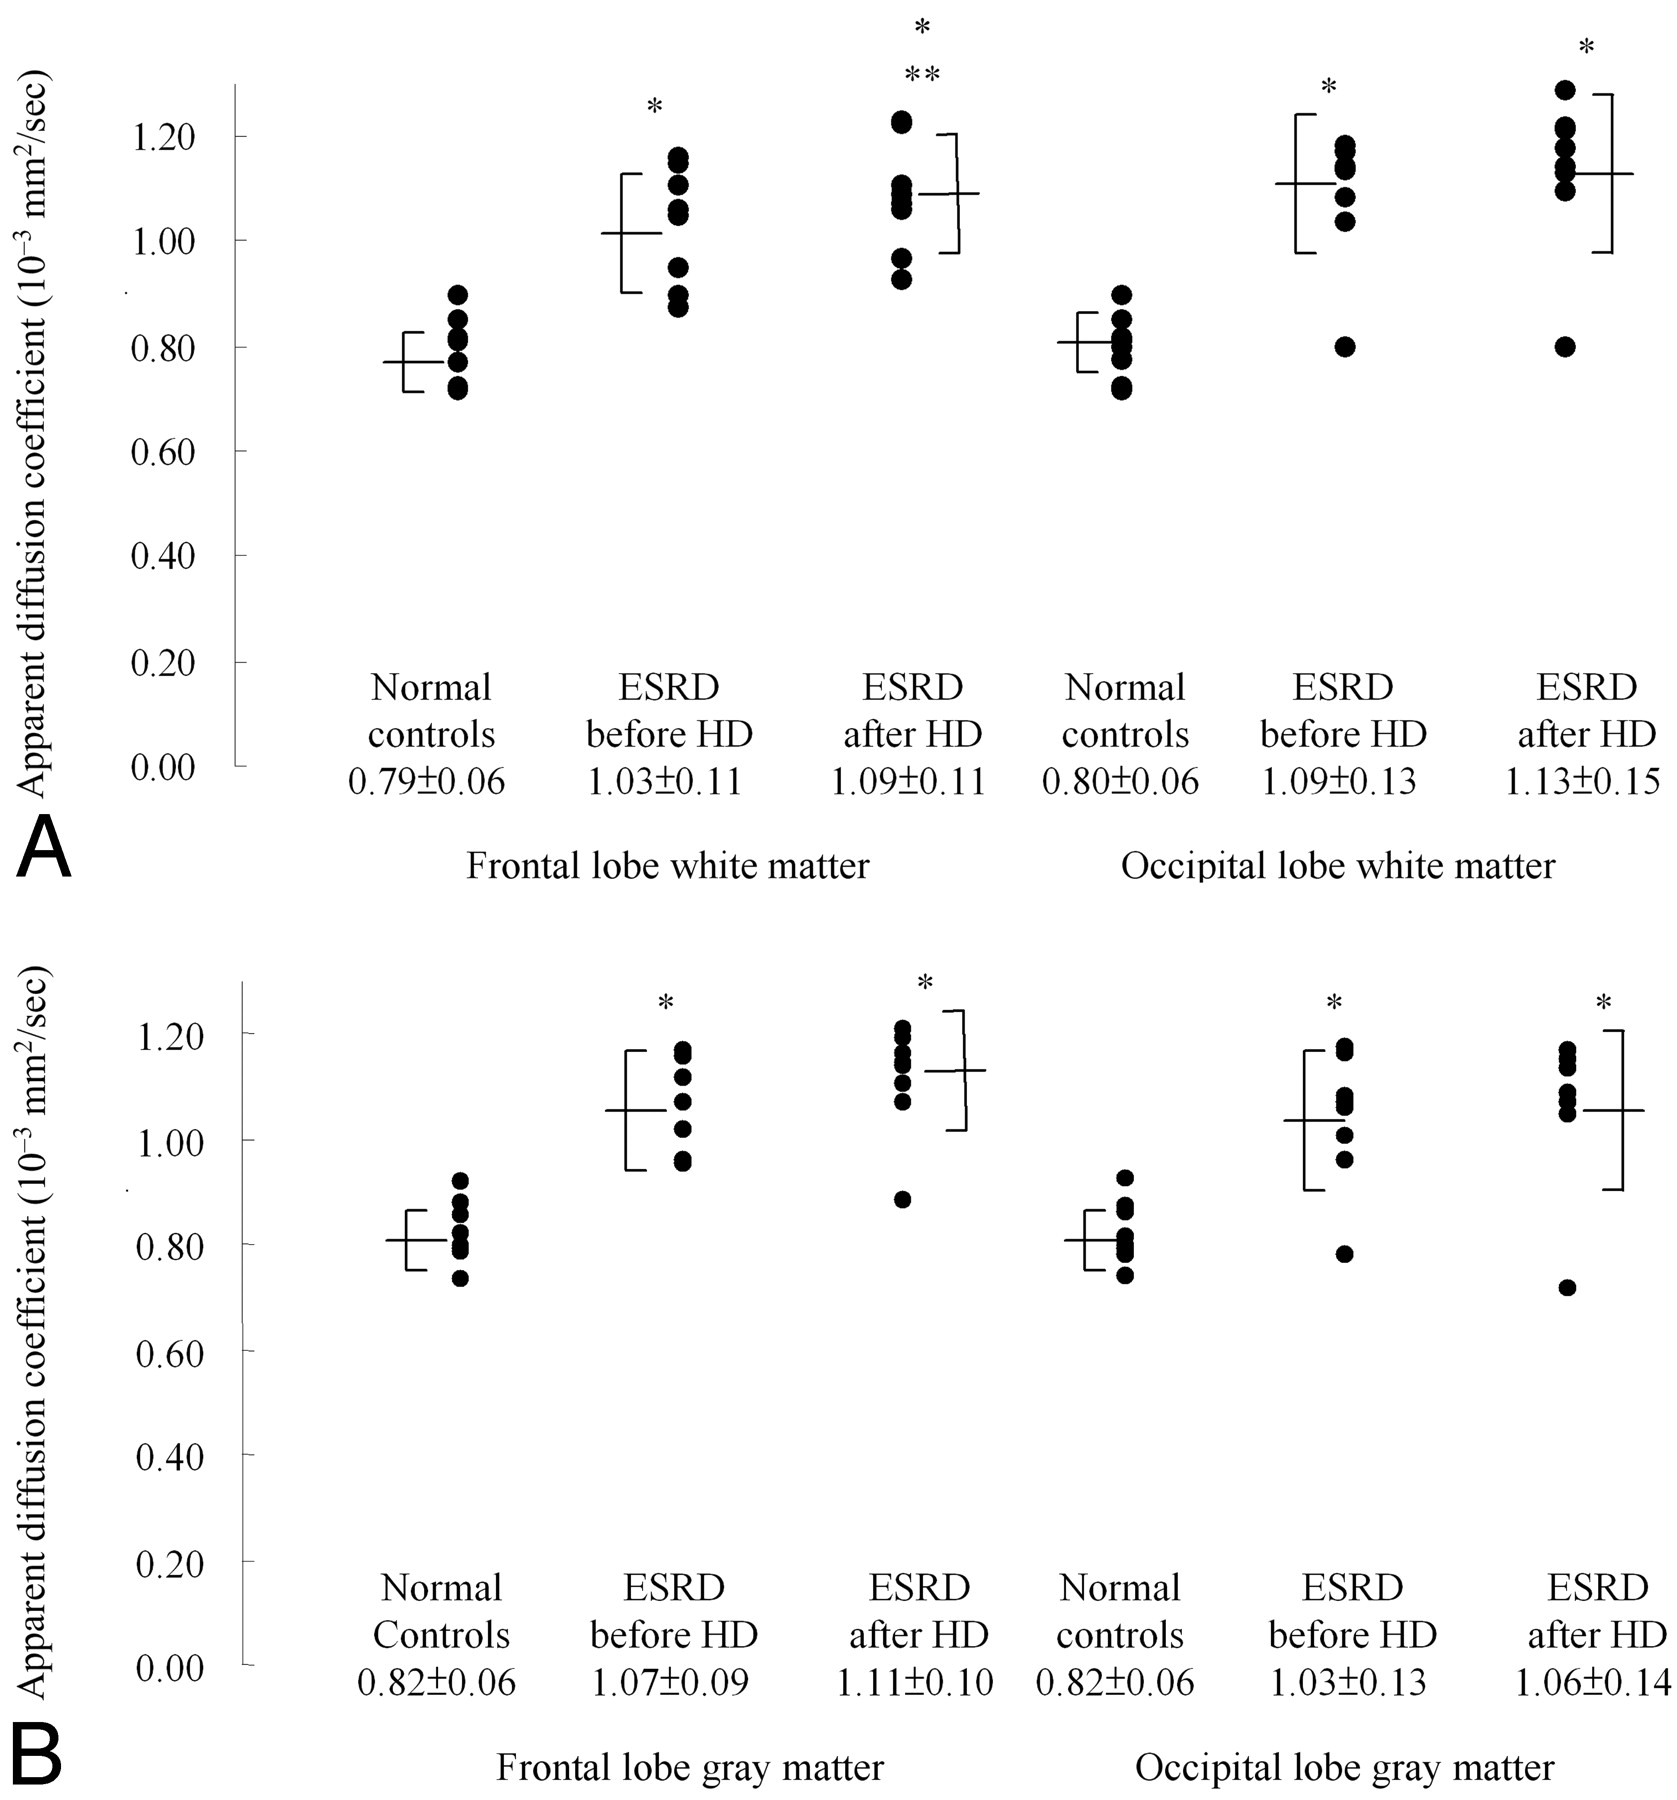
ADC (10−3 mm2/s) of white matter (A) and gray matter (B) in healthy controls and patients with end stage renal disease before and after hemodialysis. The data are expressed as mean ± SD, which are also presented in bars. Asterisk indicates P < .005 compared with that of healthy controls; double asterisks, P < .05 compared with values before hemodialysis.
Discussion
With conventional MR imaging, silent cerebral white matter lesions have been reported in one third of patients with chronic kidney disease, with a glomerular filtration rate between 15 and 60 mL/min.21 These lesions are related to vascular risk factors, particularly hypertension, and reflect ischemic brain damage caused by generalized vascular damage. The intensity and prevalence of these lesions in our patients was at the extreme, which might be explained by the severity of renal impairment in patients who were in need of renal replacement therapy to maintain life. Reversible posterior leukoencephalopathy is a syndrome of headache, seizures, and visual loss, often associated with an abrupt increase in blood pressure.22 The MR imaging findings predominantly involve the posterior regions of the cerebral hemispheres and affect both gray matter and white matter. However, sustained rather than abrupt hypertension, absence of visual symptoms, and no characteristic imaging findings in our patients do not support the diagnosis of reversible posterior leukoencephalopathy.
The diffuse increase of the ADC in normal-appearing white matter and gray matter in our patients compared with that in healthy subjects, indicating interstitial edema, to our knowledge, has never been previously reported. On the contrary, some previous reports found that there was no increase in brain-water content of patients with uremia and animals.8,23–25 The population characteristics of those studies were different from ours in that the severity of renal failure in those animals that were studied was moderate and some investigations were even done by using an acute renal failure model. Moreover, only 1 study was conducted in rats with acute renal failure by using DWI to assess the brain-water dynamics. It is interesting to ask what might be the causes of interstitial edema. Uremic toxin–associated dysfunction of the blood-brain barrier may account for the findings in those patients with ESRD before their 1st hemodialysis.26 Hypertension is prevalent in patients with ESRD at the initiation of long-term dialysis therapy, which may accelerate atherosclerosis and cause damage to cerebral vasculature in patients with ESRD, leading to the increase of the ADC.20
Cerebral edema is responsible for most of the manifestations of DDS. However, the pathogenesis, reverse urea effect–related interstitial edema versus idiogenic osmole effect–related cytotoxic edema, remains controversial. In this study, we found that hemodialysis increased the ADC of brain-water, especially in white matter, in patients with ESRD studied with DWI, which supports interstitial edema rather than cytotoxicity and an important role for the reverse urea effect in the pathogenesis of brain edema in DDS. Although DDS and osmotic demyelination syndrome have been reported to have similar CT and MR imaging features, we did not find the characteristic central pontine myelinosis images on T2-weighted imaging. Furthermore, the intensity and rate of plasma sodium correction in our study, which ranged from 132 to 136 mEq/L, were not likely to be the cause of significant brain damage.
Conclusion
On the basis of our results, patients with ESRD with severe azotemia had greater ADC than healthy subjects, which could be aggravated by hemodialysis. These results suggest that severe azotemia in ESRD leads to interstitial brain edema reflected as increased ADC, and the further increased ADC reflects that edema associated with first hemodialysis is interstitial rather than cytotoxic in nature. Moreover, the MR imaging features of DDS are not similar to those reported in osmotic demyelination syndrome and reversible posterior leukoencephalopathy.
Footnotes
This study was supported by the Kaohsiung Veterans General Hospital, Taiwan (Grant No. VGHKS-94-17).
References
- Received January 12, 2006.
- Accepted after revision April 19, 2006.
- Copyright © American Society of Neuroradiology


