
Abstract
BACKGROUND AND PURPOSE: Previous studies have shown involvement of both gray matter (GM) and white matter (WM) in mild cognitive impairment (MCI) and Alzheimer disease (AD). In this study, we assessed the lobar distribution of the GM and WM pathology over the brain and the association of lobar distribution with global cognitive decline.
MATERIALS AND METHODS: Fifty-five patients with AD, 19 patients with MCI, and 43 subjects with normal cognitive function participated in this study. GM and WM were segmented on dual fast spin-echo and fluid-attenuated inversion recovery MR images. A custom template representing anatomic areas was applied. Magnetization transfer imaging (MTI) peak height and mean magnetization transfer ratio (MTR) provided measures for structural brain damage.
RESULTS: Both mean MTR and MTI peak height showed that patients with AD had more structural brain damage in the GM of all lobes compared with controls. Patients with MCI had lower GM peak height compared with controls for the temporal and frontal lobe. WM peak height was lower for all lobes investigated for patients with both AD and MCI. WM mean MTR was lower in the frontal, parietal, and temporal lobes for patients with AD compared with controls. Age and both temporal GM peak height and mean MTR were the only parameters that predicted cognition.
CONCLUSION: This study shows that in addition to more focal GM MTI changes in the temporal and frontal lobes, widespread WM changes are present in the earliest stages of AD. This might point to an important role for WM pathology in the earliest stage of AD.
Alzheimer disease (AD) is a neurodegenerative disorder that is characterized neuropathologically by extracellular deposits of amyloid β and intracellular neurofibrillary tangles in the gray matter (GM).1 In addition to this GM pathology, evidence is accumulating that vascular pathology also plays an important role in the development of AD.2–4 This vascular pathology is presumed to be reflected in white matter (WM) abnormalities on MR imaging. These WM changes can be seen as WM hyperintensities (WMH) on conventional MR imaging (eg, fluid-attenuated inversion recovery [FLAIR] or T2-weighted MR imaging) but might also affect WM outside these visible lesions.5,6
Magnetization transfer imaging (MTI) is a quantitative MR imaging technique, which is highly sensitive to structural brain changes.7,8 Although MTI has been developed to study WM changes, it is also sensitive to changes in tissue structure of the GM.9–12 This makes MTI an attractive tool to study the earliest brain changes in both WM and GM in the continuum of cognitive decline in old age.
Previous MTI studies investigating the distribution of brain changes over the lobes in AD and mild cognitive impairment (MCI) found changes located in the temporal lobe,13,14 but changes outside this lobe were also detected.15 However, in these studies, GM and WM were taken together, so no differentiation could be made as to whether the observed changes were attributable to GM or WM. It is conceivable that there are differences in the distribution of GM and WM damage over the lobes. GM damage is thought to originate from the temporal lobe. However, WM damage can be expected to have a more diffuse distribution because it is known that WMH are diffusely distributed over the brain.16 Therefore, the aim of the present study was to investigate how brain changes, as detected by MTI, are distributed over the GM and WM in both MCI and AD. In addition, we investigated the association between structural brain changes, as detected by MTI, and global cognitive decline.
Methods
Patients
Elderly patients who were consecutively referred to our outpatient memory clinic participated in this study. Fifty-five patients with probable AD, 19 patients with MCI, and 43 subjects with normal cognitive function were included. The healthy group included 19 patients who were evaluated for memory complaints but who had no detectable cognitive deficits on neuropsychological testing and 24 volunteers without memory complaints who were recruited through an advertisement in a local newspaper. All subjects were evaluated for memory complaints by using a standardized dementia screening that included a detailed medical history, a general internal and neurologic examination, laboratory tests, neuropsychological testing including the Mini-Mental State Examination (MMSE),17 and MR imaging of the brain. Diagnoses were made in a multidisciplinary consensus meeting according to the National Institute of Neurologic and Communicative Disorders and Stroke-Alzheimer Disease and Related Disorders Association criteria for probable AD18 and the criteria according to Petersen et al for MCI.19,20 Patients and controls were included if they met the following criteria: 1) older than 60 years, 2) no other neurologic or psychiatric illness, and 3) no abnormalities on MR imaging other than WMH or an incidental small lacunar lesion (≤5 mm in diameter). This study was approved by the local medical ethics committee. Written informed consent was obtained from all subjects or from a close relative if a patient was demented.
MR Imaging Data
MR imaging was performed on a 1.5T MR imaging system (Philips Medical Systems, Best, the Netherlands). Conventional dual fast spin-echo (48 axial sections, section thickness = 3 mm, no gap, TR/TE= 3,000/27, TI = 120 ms, flip angle = 90°, FOV = 220 mm, matrix = 256 × 256) and FLAIR (48 axial sections, section thickness = 3 mm, no gap, TR/TE = 8,000/100 ms, TI = 2,000 ms; flip angle = 90°, FOV = 220 mm, matrix = 256 × 256) sequences were obtained in all patients. The line through the inferior border of the genu and splenium of the corpus callosum defined the direction of scanning. MTI of the brain was performed by using a 3D gradient-echo pulse sequence (28 axial sections, section thickness = 5 mm, no gap, TR/TE = 106/6 ms, flip angle = 12°, FOV = 220 mm, matrix = 256 × 256) (a sinc-gauss-shaped saturation pulse 1,100 Hz below the frequency of water was added).21 These scanning parameters were chosen to minimize T1 and T2 weighting, resulting in a proton-attenuation (PD) contrast in the absence of magnetization transfer (MT) saturation pulses. Two consecutive sets of images were acquired; the first was performed in combination with the MT saturation pulse, and the second, without.
Image Postprocessing
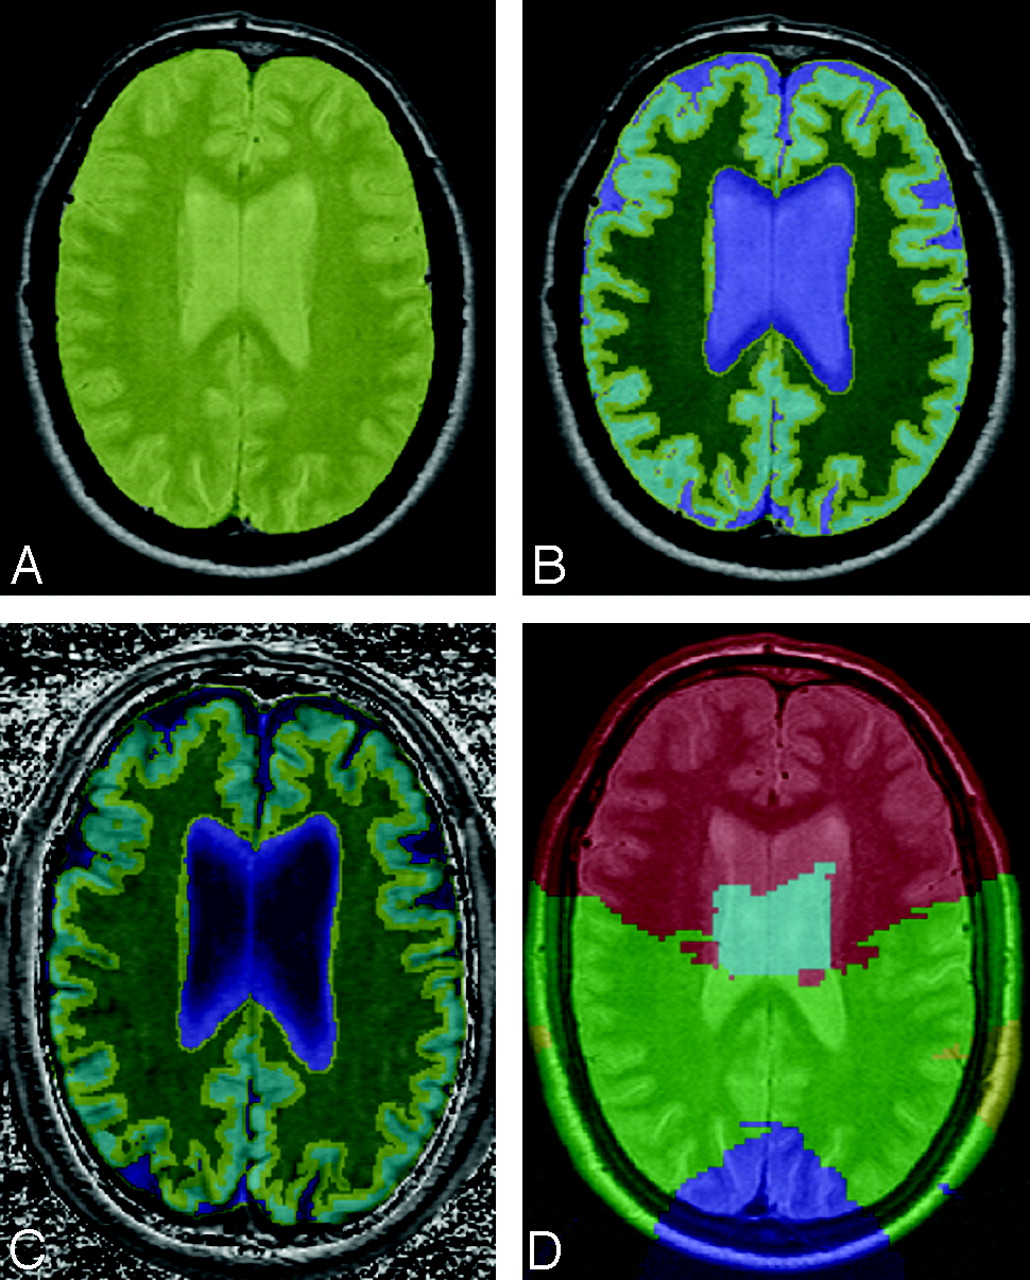
Images were analyzed by using Software for Neuro-Image Processing in Experimental Research, an in-house–developed program for image processing.22 Briefly, the postprocessing included the following steps (Fig 1): First, the PD image was used to create an intracranial mask. The PD, T2, and FLAIR images were combined to generate segmentations of GM, WM, WMH, and CSF. Subsequently, a custom template was applied to exclude the cerebellum, brain stem, and basal ganglia from analysis and to determine the anatomic regions of the frontal, temporal, parietal, and occipital lobes (Fig 2).23 The boundaries between lobes in this custom-designed template were drawn according to Zilles and Rehkämper.24 All structures rostral of the mesencephalon and cerebellum were considered supratentorial. All interfaces between CSF, GM, and WM were eroded 1 voxel to minimize partial voluming effects. Finally, these masks were coregistered to the MT images. The magnetization transfer ratio (MTR) for each voxel within the mask was calculated automatically by using the formula MTR = {(M0 − Ms)/M0} × 100%, in which Ms represents the signal intensity of voxels with saturation and M0 represents the intensity of voxels without saturation. In the resulting MTR map, voxel values represented the percentage of signal-intensity loss caused by transfer of magnetization of the saturated immobile macromolecular-bound to the free water pool of protons.21 Mean MTR was defined as the average MTR of all voxels in the GM or WM of a given a lobe. The frequency distributions of MTR values were displayed as MTR histograms of the GM and WM of each lobe, respectively.25 From each histogram, the peak height was derived. The peak height of the histogram was determined as a measure of the frequency of appearance of the most common MTR value and reflected the amount of remaining normal brain tissue. This peak height was normalized for lobar size by dividing the number of voxels on the peak by the total number of segmented voxels. The normalized peak height thus obtained was a measure reflecting the amount of remaining normal brain tissue in a specific lobe, independent of lobar size and atrophy.26

A, Automatic segmentation process. First, the PD image is used to create an intracranial segmentation. B, The PD, T2, and FLAIR images are combined to generate segmentations of GM and WM. C, After that, the masks are coregistered to the MTI image. D, Finally, the custom template representing the frontal, parietal, temporal, and occipital lobes, drawn according to Zilles and Rehkämper,24 was applied (also see Fig 2).

3D example of the anatomic template used in this study. The boundaries between the lobes in this template were drawn according to Zilles and Rehkämper.24
Statistical Analysis
Statistical Package for the Social Sciences for Windows (Release 10.0; SPSS, Chicago, Ill) was used for data analysis. Categoric variables were analyzed by using a χ2 test. Differences in group means were analyzed by using analysis of variance with post hoc Bonferroni tests. Independent associations between structural brain abnormalities and MMSE across all groups were assessed by simultaneously entering the GM and WM peak heights for all regions, atrophy, WMH volume, age, and sex in a linear regression model. The level of statistical significance was set at P < .05.
Results
There were no differences in sex, age, education, and WMH volume between groups (Table 1). As expected, patients with AD had lower MMSE scores than patients with MCI and subjects with normal cognition. Furthermore, patients with AD had more atrophy compared with subjects with normal cognition.
Demographic and clinical characteristics
The GM and WM peak heights of the frontal, parietal, temporal, and occipital lobes for each diagnostic group are displayed in Table 2. Patients with AD had a lower GM and WM peak height for all lobes compared with subjects with normal cognition. Patients with MCI had a lower GM peak height compared with controls for the temporal and frontal lobe. WM peak height was reduced for all lobes investigated when comparing patients with MCI and AD with subjects with normal cognition. There were no differences between patients with MCI and AD. Mean MTRs of the frontal, parietal, temporal, and occipital GM and WM are shown in Table 3. The mean MTR of all regions, except the occipital WM, differed between patients with AD and subjects with normal cognition. No differences were found between patients with MCI and AD or between patients with MCI and subjects with normal cognition.
GM and WM peak height of the frontal, parietal, temporal, and occipital lobes
GM and WM mean MTR of the frontal, parietal, temporal, and occipital lobes
When the peak heights for all regions, atrophy, WMH volume, age, and sex were entered simultaneously in a linear regression model, age (β[SE] = 0.41 [.02]); P < .001) and temporal GM peak height (β[SE] = 0.75 [.03]) P < .001) (Fig 3) were the only parameters that predicted cognition. Similar results were found for mean MTR because age (P < .001; β[SE] = 0.19 [.02]) and temporal GM mean MTR (P < .001; β[SE] = 0.74 [.03]) predicted cognition in this model. This analysis was performed across all 3 groups. Within the groups, none of the parameters were associated with MMSE (P > .05).
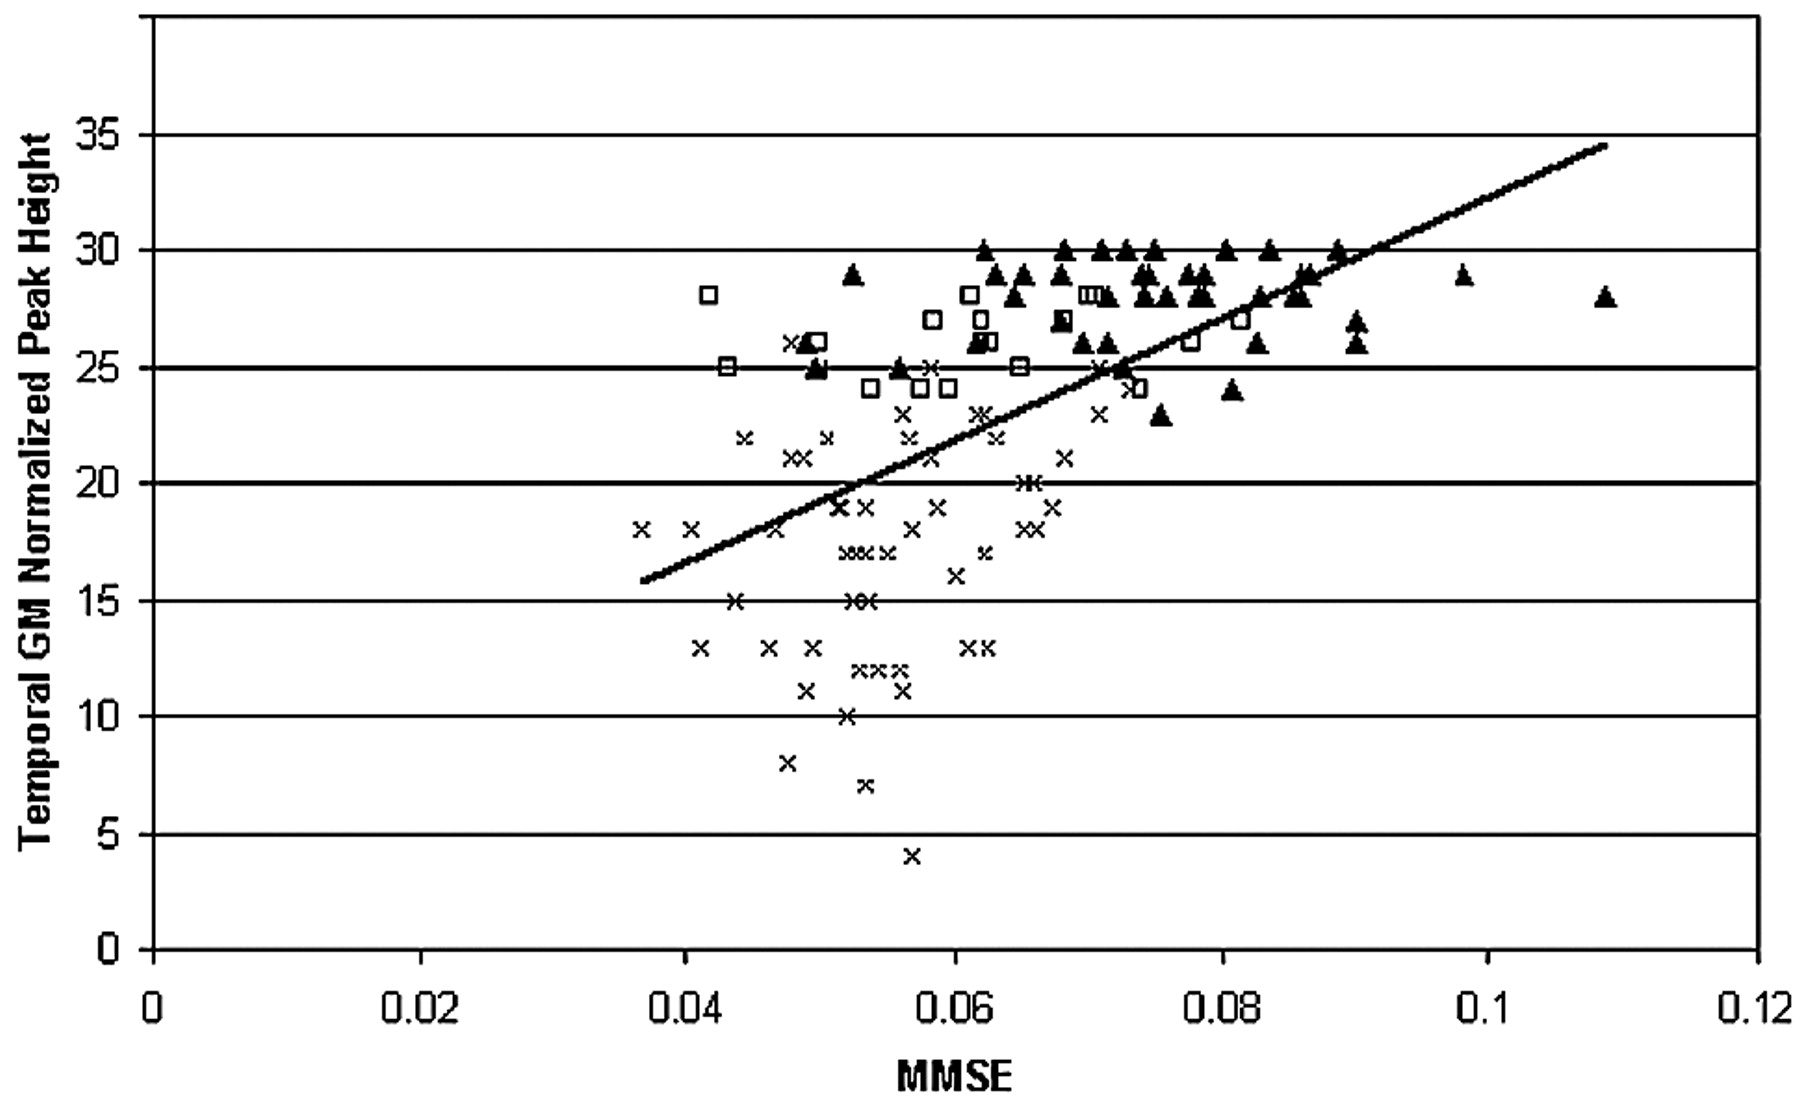
Scatterplot of MMSE versus temporal GM peak height (Pearson r = 0.67). In a linear regression analysis with the GM and WM peak heights of all lobes, WMH volume, atrophy, age, and sex as predictors, temporal GM peak height was, along with age, the only parameter to independently predict MMSE (P < .001; β[SE] = 0.75 [.03]). This implies that if the MMSE decreases 1 point, the peak height will decrease with 0.75. ▴ indicates cognitive normal; □, MCI; ×, AD; MMSE, points scored on Mini Mental State Examination; Temporal GM Normalized Peak Height, number of voxels on the peak of the temporal GMMT histogram/total number of temporal GM voxels × 103.
Discussion
In this study, we found that patients with AD showed widespread MTI changes in both GM and WM. Widespread structural changes were also found in the WM of patients with MCI in addition to GM changes in the temporal and frontal lobes. When all peak heights or mean MTRs of all lobes were assessed simultaneously, GM changes of the temporal lobe were found to be independently associated with MMSE. Furthermore, our study is in line with previous studies that reported that MTI peak height is the most sensitive MTR parameter in detecting brain pathology.13,26,27 Mean MTR only detected differences between patients with AD and subjects with normal cognition, whereas peak height also detected differences between subjects with normal cognition and patients with MCI.
These findings are in line with previous quantitative MR imaging studies detecting WM and GM damage in MCI and AD.5,28 However, in all the previous studies investigating the lobar distribution of MTR changes in patients with MCI and AD, GM and WM were taken together.13–15 Therefore, it remained unclear whether the widespread MTR changes found in AD and MCI were attributable to damage in the GM only. This study combined a GM/WM segmentation with the lobar localization of the MTR changes in the cerebrum of patients with MCI and AD.
GM damage found in the group of patients with AD involved all lobes investigated. This is in line with neuropathologic findings showing that the entire cerebrum is involved in the more-advanced stages of the disease.1 In our study, MTR changes were detected in the temporal and frontal lobes of patients with MCI. The temporal GM is the region where the earliest neuropathologic changes are found in AD. Neuropathologic changes of this region reflect disease progression because the atrophy rate of this region is known to be a marker of disease progression.29 This also explains the strong and specific association between temporal GM peak height and MMSE. Furthermore, GM pathology affects the frontal lobe in MCI.30 Our MTI findings seem to confirm this involvement of both temporal and frontal GM in MCI.
In the WM of patients with AD, damage has been demonstrated in various regions of interest, including the frontal, temporal, parietal, and occipital lobes, by using diffusion-weighted imaging.5,6 In addition, diffusion tensor imaging showed WM damage not only inside but also outside the temporal lobe in patients with MCI.28 In this MTI study, we were able to expand on these former studies because we showed widespread WM damage in all lobes of patients with both MCI and AD, applying volumetric analysis. We hypothesize that the observed WM changes are caused by chronic hypoperfusion based on cerebral small vessel disease. Age-related WMH are a well-documented manifestation of such small-vessel disease.31 However, it is unlikely that the observed MTI changes in lobar WM can only be attributed to the relatively small volumes of WMH that we found in our patients. Because it has been demonstrated that MTI is more sensitive to the presence of structural brain changes than conventional MR imaging sequences,7,8 changes in the normal-appearing WM (NAWM) probably also contribute to the observed MTI changes in the WM. This was confirmed by our study because a separate assessment of the NAWM did not yield peak heights that were significantly different from the whole WM peak heights. We presume that these changes are more subtle manifestations of the same pathology underlying WMH. These findings are in keeping with recent neuropathologic studies showing that microvascular disease is not only almost universally present in MCI but might also play an important role in cognitive decline.3,32,33
One of the major strengths of this study is the robust segmentation method that was used. The segmentation procedure was fully automatic and did not require human interference. Erosion guaranteed that partial voluming effects did not affect our results. Therefore, we are confident that the results are not caused by volume loss. Furthermore, volumetric analysis allowed us to include all cortical GM and WM voxels except those that were left out after erosion. In addition, we were able to include fairly large groups of patients and controls. A potential limitation of this study was that our in-house–developed template of the anatomic regions of the cerebral lobes is somewhat artificial because it is impossible to define exact boundaries for the WM between lobes. However, the segmentation results appeared appropriate. Our study shows that MTI is a sensitive tool for detecting WM and GM damage in the early stages of AD, when peak height is used as an outcome measure. Therefore, MTI might have potential value as a diagnostic tool or as a surrogate marker of disease in both MCI and AD. However, the predictive value of MTI needs further investigation, especially by studies with a longitudinal design.
Conclusion
The conclusion drawn from this study is that brain damage, as detected by MTI, is widespread over the lobes in patients with both AD and MCI. GM damage is more focally present in the temporal and frontal lobes of patients with MCI. This is in line with the neuropathologic knowledge that GM damage originates from the temporal lobe in AD and explains the independent association between temporal GM peak height and cognitive decline. WM damage was found in all 4 lobes of the patients with MCI investigated in this study. This might point to the involvement of a diffuse process affecting the WM even before patients are clinically demented and could be explained by the presence of diffuse vascular pathology.
Footnotes
Paper previously presented at: Annual Meeting of the Society for Vascular Behavioural and Cognitive Disorders, June 8–12, 2005, Florence, Italy; and at the International Society for Magnetic Resonance in Medicine Workshop “Imaging Myelin: Formation, Destruction and Repair,” February 8–10, 2006, Vancouver, Canada.
References
- Received April 10, 2006.
- Accepted after revision April 9, 2007.
- Copyright © American Society of Neuroradiology
In this issue


Jump to section
Related Articles
Cited By...
- Microstructural Tissue Changes in Alzheimer Disease Brains: Insights from Magnetization Transfer Imaging
- Regional Analysis of the Magnetization Transfer Ratio of the Brain in Mild Alzheimer Disease and Amnestic Mild Cognitive Impairment
- Longitudinal Magnetization Transfer Imaging in Mild to Severe Alzheimer Disease