
Abstract
BACKGROUND AND PURPOSE: Late infantile neuronal ceroid lipofuscinosis (LINCL), a form of Batten disease, is a fatal neurodegenerative genetic disorder, diagnosed via DNA testing, that affects approximately 200 children in the United States at any one time. This study was conducted to evaluate whether quantitative data derived by diffusion-weighted MR imaging (DWI) techniques can supplement clinical disability scale information to provide a quantitative estimate of neurodegeneration, as well as disease progression and severity.
MATERIALS AND METHODS: This study prospectively analyzed 32 DWI examinations from 18 patients having confirmed LINCL at various stages of disease. A whole-brain apparent diffusion coefficient (ADC) histogram was fitted with a dual Gaussian function combined with a function designed to model voxels containing a partial volume fraction of brain parenchyma versus CSF. Previously published whole-brain ADC values of age-matched control subjects were compared with those of the LINCL patients. Correlations were tested between the peak ADC of the fitted histogram and patient age, disease severity, and a CNS disability scale adapted for LINCL.
RESULTS: ADC values assigned to brain parenchyma were higher than published ADC values for age-matched control subjects. ADC values between patients and control subjects began to differ at 5 years of age based on 95% confidence intervals. ADC values had a nearly equal correlation with patient age (R2 = 0.71) and disease duration (R2 = 0.68), whereas the correlation with the central nervous system disability scale (R2 = 0.27) was much weaker.
CONCLUSION: This study indicates that brain ADC values acquired using DWI may be used as an independent measure of disease severity and duration in LINCL.
Late infantile neuronal ceroid lipofuscinosis (LINCL), a form of Batten disease, is an autosomal recessive lysosomal storage disease that results in neurodegeneration.1 It first manifests between the ages of 2–4 years through seizures followed by deteriorating motor, cognitive, and visual abilities, traditionally leading to death by ages 8–12 years.2 Definitive diagnosis of LINCL is done via genetic testing for mutations in the CLN2 gene, which results in deficiency of the lysosomal protease tripeptidyl peptidase-I. Absence of this protease leads to lysosomal distension and neuronal death. There are no known treatments for LINCL other than symptom management. A better understanding of the anatomic distribution of neurodegeneration may permit genetic and cellular therapies to be targeted to appropriate locations in the brain.3
Progression of neuronal degeneration can be assessed by a disability scale based on speech, vision, language, and seizures.4 To monitor brain-directed therapies, a modified central nervous system (CNS) disability score has been established.1 However, these methods are nonspecific in that they do not implicate specific areas of the brain. Quantitative MR imaging techniques may supplement information provided by the disability scale and provide a more refined evaluation of neurodegeneration, as well as an opportunity for serial assessment of the same patient.
Diffusion-weighted MR imaging (DWI) is a technique that has been shown to detect water diffusion abnormalities in various disease states.5–7 Measurement of the apparent diffusion coefficient (ADC) provides a quantitative estimate of the restrictive nature of the motion of water molecules within tissue for each voxel in a diffusion-weighted image. The ADC is known to decrease with increasing age in normal children as the brain becomes increasingly myelinated and structured.8,9 This study used whole-brain ADC histograms to obtain a measure of the degree of water restriction in the entire brain. The whole-brain histogram was fitted using a dual Gaussian function in addition to a partial volume function. We hypothesized that the global maximum of the model fit characterizing the whole-brain ADC value derived by DWI techniques would supplement clinical disability scale information to provide a quantitative estimate of neurodegeneration, as well as disease progression and severity.
Materials and Methods
Patient Selection
The research protocol was reviewed and approved by the institutional review board at our institution. Eighteen patients presenting with genetically confirmed LINCL (9 boys and 9 girls) of ages 3.4 through 13.8 years participated in this protocol, for a total of 32 DWI examinations (Table). The average age at diagnosis for all of the patients was 3.9 ± 1.0 years. Disease severity was clinically monitored throughout the study using a modified CNS disability scale.4 The visual component was removed from the scoring system while retaining measures of motor function, seizure activity, and language skills to focus on the neurologic aspects of the disease.1 Each of these areas was ranked from 0 to 3 and then summed to provide a total score with 0 being the most severe. At the time of MR imaging, patients presented the following CNS disability scores: 2 (n = 1), 3 (n = 12), 4 (n = 6), 5 (n = 11), and 6 (n = 2).
Whole-brain ADC values for 18 patients with LINCL
Clinical MR Imaging Methods
All of the image data were acquired on a 3T MR imaging system (GE Medical Systems, Milwaukee, Wis). Conventional clinical imaging included T1-weighted, T2-weighted, and fluid-attenuated inversion recovery sequences. Next, a spin-echo diffusion-weighted echo-planar imaging sequence was implemented over the entire brain using a section thickness of 5 mm with an FOV of 22 cm, a matrix size of 128 × 128, a TR of 8.2 seconds, a TE of 70–80 ms, and 2 averages. Diffusion weighting was acquired using b = 1000 s/mm2 in 3 orthogonal directions for a total scan time of 65 seconds.
Analysis Methods
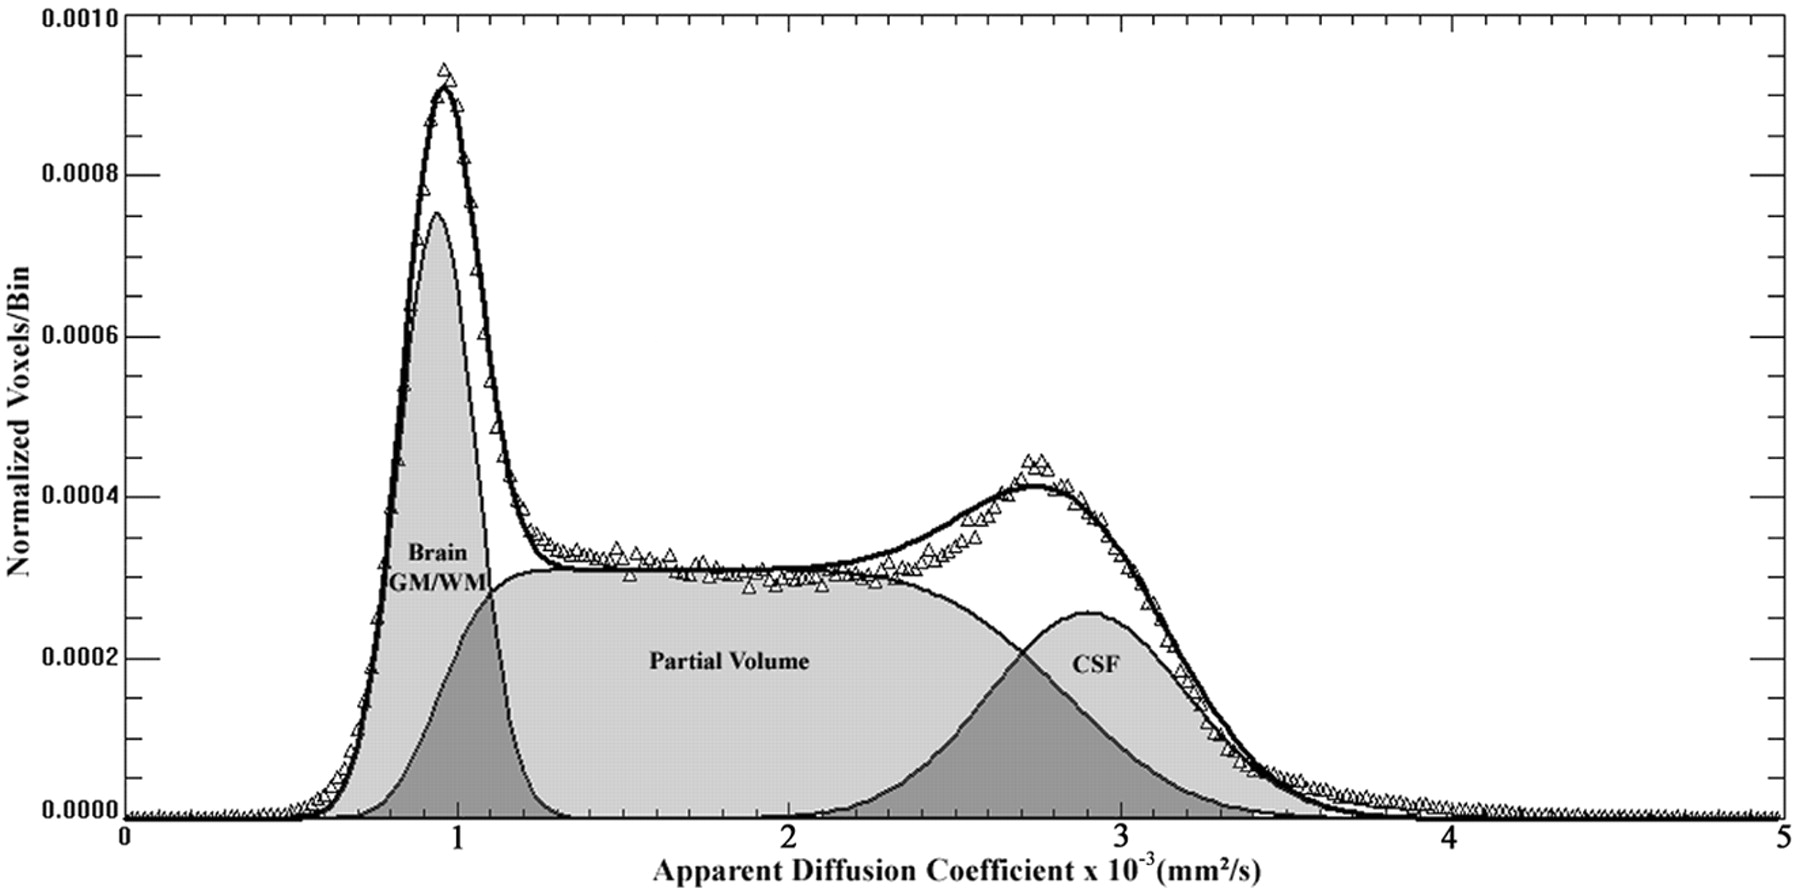
Images were exported to an Optiplex Pentium 4 4.0-GHz PC (Dell, Round Rocker, Texas) and analyzed using the Interactive Data Language (IDL 6.2; ITT, Boulder, Colo). Images were masked to include voxels having a signal intensity greater than 15% of the maximum value in the DWI series. ADC values were calculated as follows:  1) where S1 represents the signal intensity from the diffusion-weighted image and S0 the signal intensity without diffusion weighting (Fig 1). ADC values were placed in a normalized histogram of unit area. The normalized histogram was fitted with a dual Gaussian distribution function and a partial volume distribution function (Fig 2). These 3 functions were designed to segment the brain, CSF, and brain-CSF partial volume components, respectively. Modeling of these functions was based on arguments given previously8,10 but was modified in the following sense: the ADC distribution function was modeled as follows:
  2) where
  3) and
  4) are the normalized Gaussian functions describing the distribution of ADC values in the brain and CSF, respectively, and f(.) are respective weighting factors. The partial volume distribution function was modeled under the assumption that voxels that consist of brain matter and CSF contain both components in all of the possible and equally probable fractions, that is:
  5) where μ(t) = (1 − t)μbrain + tμCSF and σ2(t) = (1 − t)2σ2brain + t2σ2CSF. Curve fitting of the 6 parameters μbrain, μCSF, σbrain, σCSF, fbrain, and fCSF was performed within IDL 6.2 using a gradient expansion algorithm to compute a nonlinear least-squares fit to the data. Note that the partial volume function is completely determined by the parameters of the 2 Gaussians. The histogram bin containing the maximum value of the combined fitted function (Equation 2), of the cerebral compartment was used as a measure of the whole-brain ADC value.
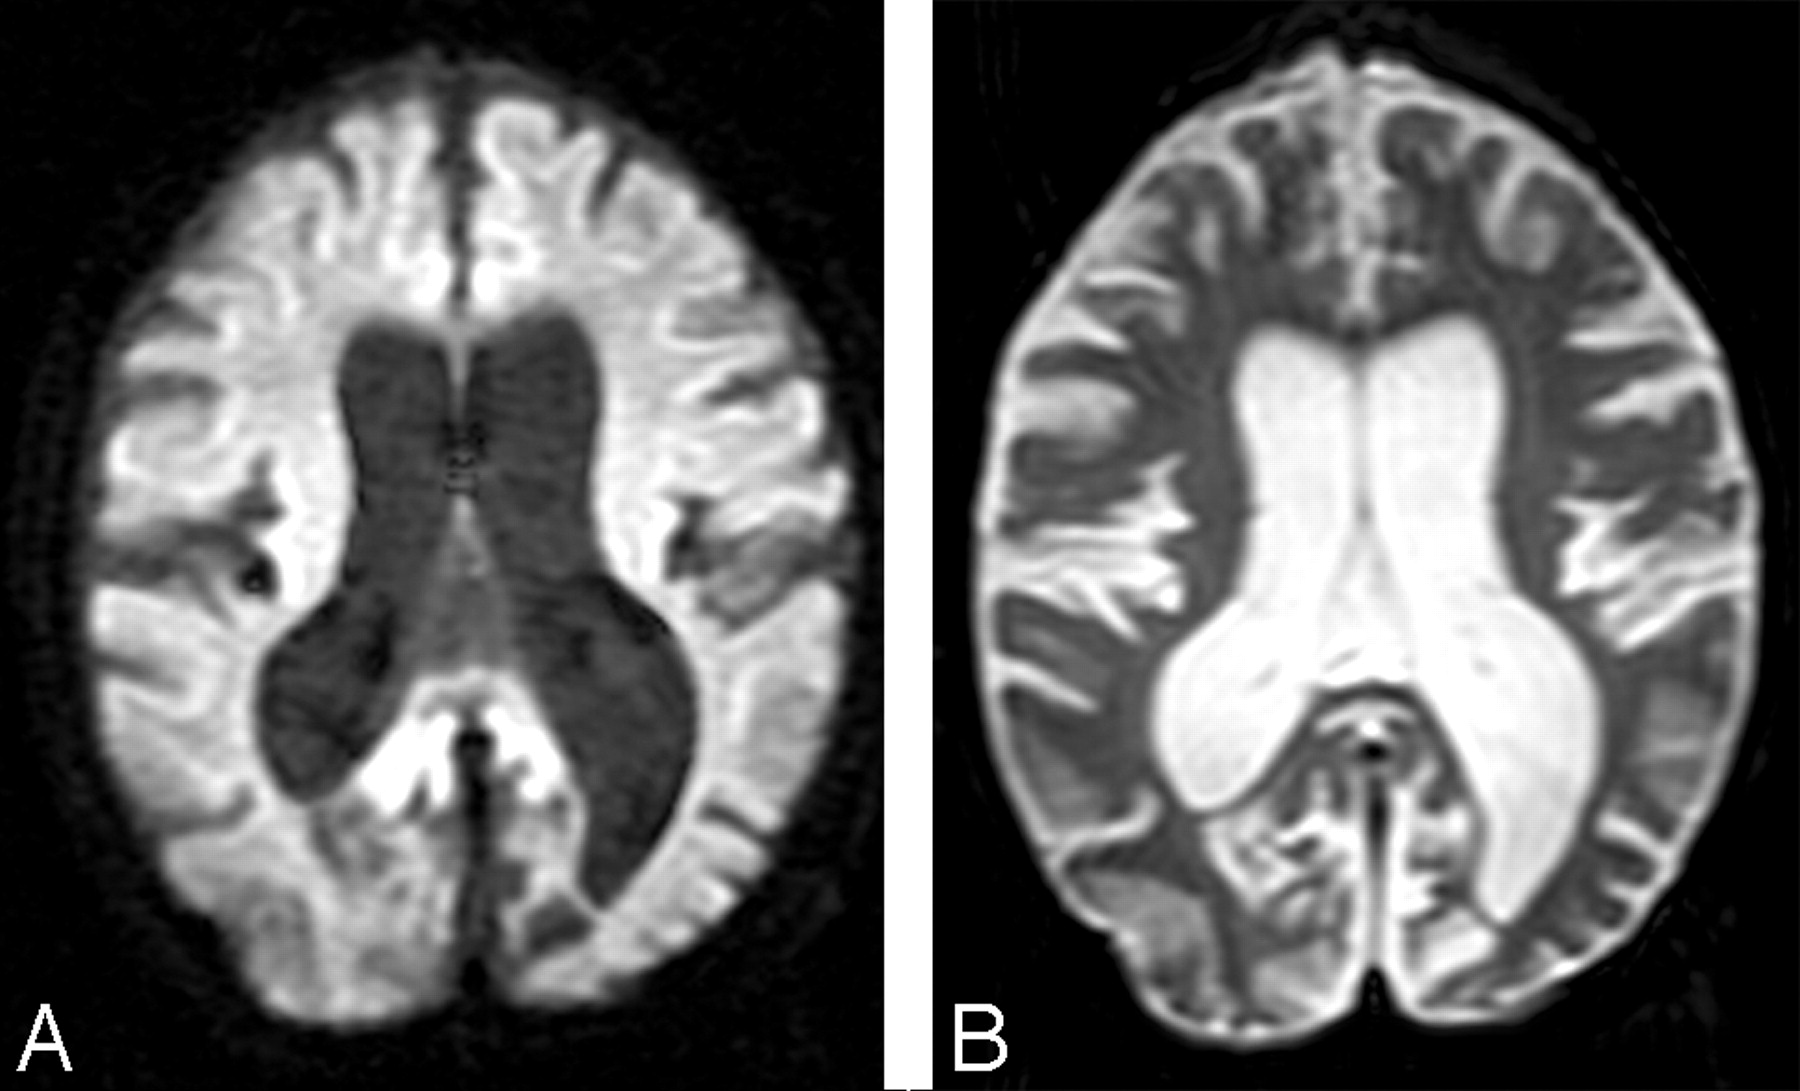
A, A diffusion-weighted image (b = 1000 s/mm2) and an image acquired without diffusion weighting (B) show enlarged sulci and dilated ventricles consistent with atrophic changes from a representative patient with LINCL.

A whole-brain ADC histogram from a representative patient with LINCL shows the dual Gaussian and partial volume functions that were used to fit the whole brain, partial volume, and CSF compartments.
A Monte Carlo algorithm was written in IDL 6.2 to verify the functional form of the equations describing the analytical partial volume model. Two standard normally distributed floating point pseudorandom number generators, r(.), were used to sample points from the Gaussian distributions (Equations 3 and 4) characterizing the brain and CSF compartments. A uniformly distributed floating point pseudorandom number generator was used to determine the partial volume weighting factors, t. A partial volume voxel was then placed in the histogram according to the following:  6) This process was repeated approximately 200,000 times to get an adequate sampling estimate of the functional form of the partial volume component. The Monte Carlo sampling method was found to produce the same functional form as the analytic solution. In addition, qualitative visual confirmation of gray and white matter, partial volume, and CSF components was obtained using images generated as shown in Fig 3 by displaying only voxels associated with specific ranges of ADC values. In the example of Fig 3, voxels are shown with the following ranges: 1) 1.0 ± 0.2 × 10⁻³ mm2/s; 2) 1.5 ± 0.2 × 10⁻³ mm2/s; 3) 2.0 ± 0.2 × 10⁻³ mm2/s; 4) 2.5 ± 0.2 × 10⁻³ mm2/s; 5) 3.0 ± 0.2 × 10⁻³ mm2/s; and 6) 3.5 ± 0.2 × 10⁻³ mm2/s.

Voxels associated with specific ranges of ADC values provide visual confirmation that compartments identified as whole brain, partial volume, and CSF correspond with specific regions as shown from a representative section of a patient with LINCL. ADC ranges displayed are described below.
A, 1.0 ± 0.2 × 10⁻³ mm2/s.
B, 1.5 ± 0.2 × 10⁻³ mm2/s.
C, 2.0 ± 0.2 × 10⁻³ mm2/s.
D, 2.5 ± 0.2 × 10⁻³ mm2/s.
E, 3.0 ± 0.2 × 10⁻³ mm2/s.
F, 3.5 ± 0.2 × 10⁻³ mm2/s.
Previously published ADC values derived from whole-brain histograms of age-matched control subjects were used for comparison with the LINCL patients. In that study, data were fitted with a 9-parameter triple-Gaussian model that incorporated components of brain parenchyma, CSF, and a mixing compartment attributed to partial volume averaging.11 The mean of the first Gaussian peak characterizing brain parenchyma defined the whole-brain ADC value for this method. For the purpose of comparison only, the full dataset of LINCL patients was fitted with the triple-Gaussian model in addition to the partial volume model described in Equation 2.
The method of statistical bootstrapping was used to estimate the error on the maximum of the ADC histogram for 5 DWI patient studies chosen at random from the full dataset.12 The histogram contained 250 bins of data, which were randomly resampled 100 times with replacement using IDL 6.2. Each of these resampled histograms was fitted with the partial volume model, and the resulting error on the maximum ADC value was calculated. A single-factor analysis of variance (ANOVA) test was used to determine statistically significant variances in the mean ADC values of the patients when grouped by their CNS disability scores. The resulting F value was compared with the critical F value for the specified number of samples, and a P value was determined using a 95% confidence interval to gauge significance for all of the results.
Results
The whole-brain ADC value containing both gray and white matter components of the brain was determined from the 32 DWI scans of the 18 LINCL subjects and given with age, CNS disability score at the time of the scan, and the age at diagnosis (Table). The estimate of percentage error on the maximum ADC value was 1.7% ± 0.3% (n = 5) using the statistical bootstrap method. The whole-brain ADC values derived from the histogram increased with age for all of the LINCL patients (Fig 4), in contrast with the decrease in ADC as a function of age as seen in age-matched control subjects. The ADC values increased linearly with patient age [ADC × 103 (mm2/s) = 0.065 * Age (years) + 0.564] yielding R2 = 0.71 (P < .0001). The whole-brain ADC values were correlated with the disease duration calculated as the age at diagnosis subtracted from the age at examination. A linear trend showed significant correlation between the whole-brain ADC histogram values and disease duration yielding R2 = 0.68 (P < .0001). There were no significant differences in the ADC values of the Gaussian representing brain parenchyma of the LINCL patients fitted using both Equation 2 and the triple-Gaussian methods. The point at which the lower 95% confidence interval of the LINCL patients crossed the upper 95% confidence interval of the control subjects was at 5 years. This implies that statistically significant deviations in whole-brain ADC may be detected as early as 5 years of age in this population.
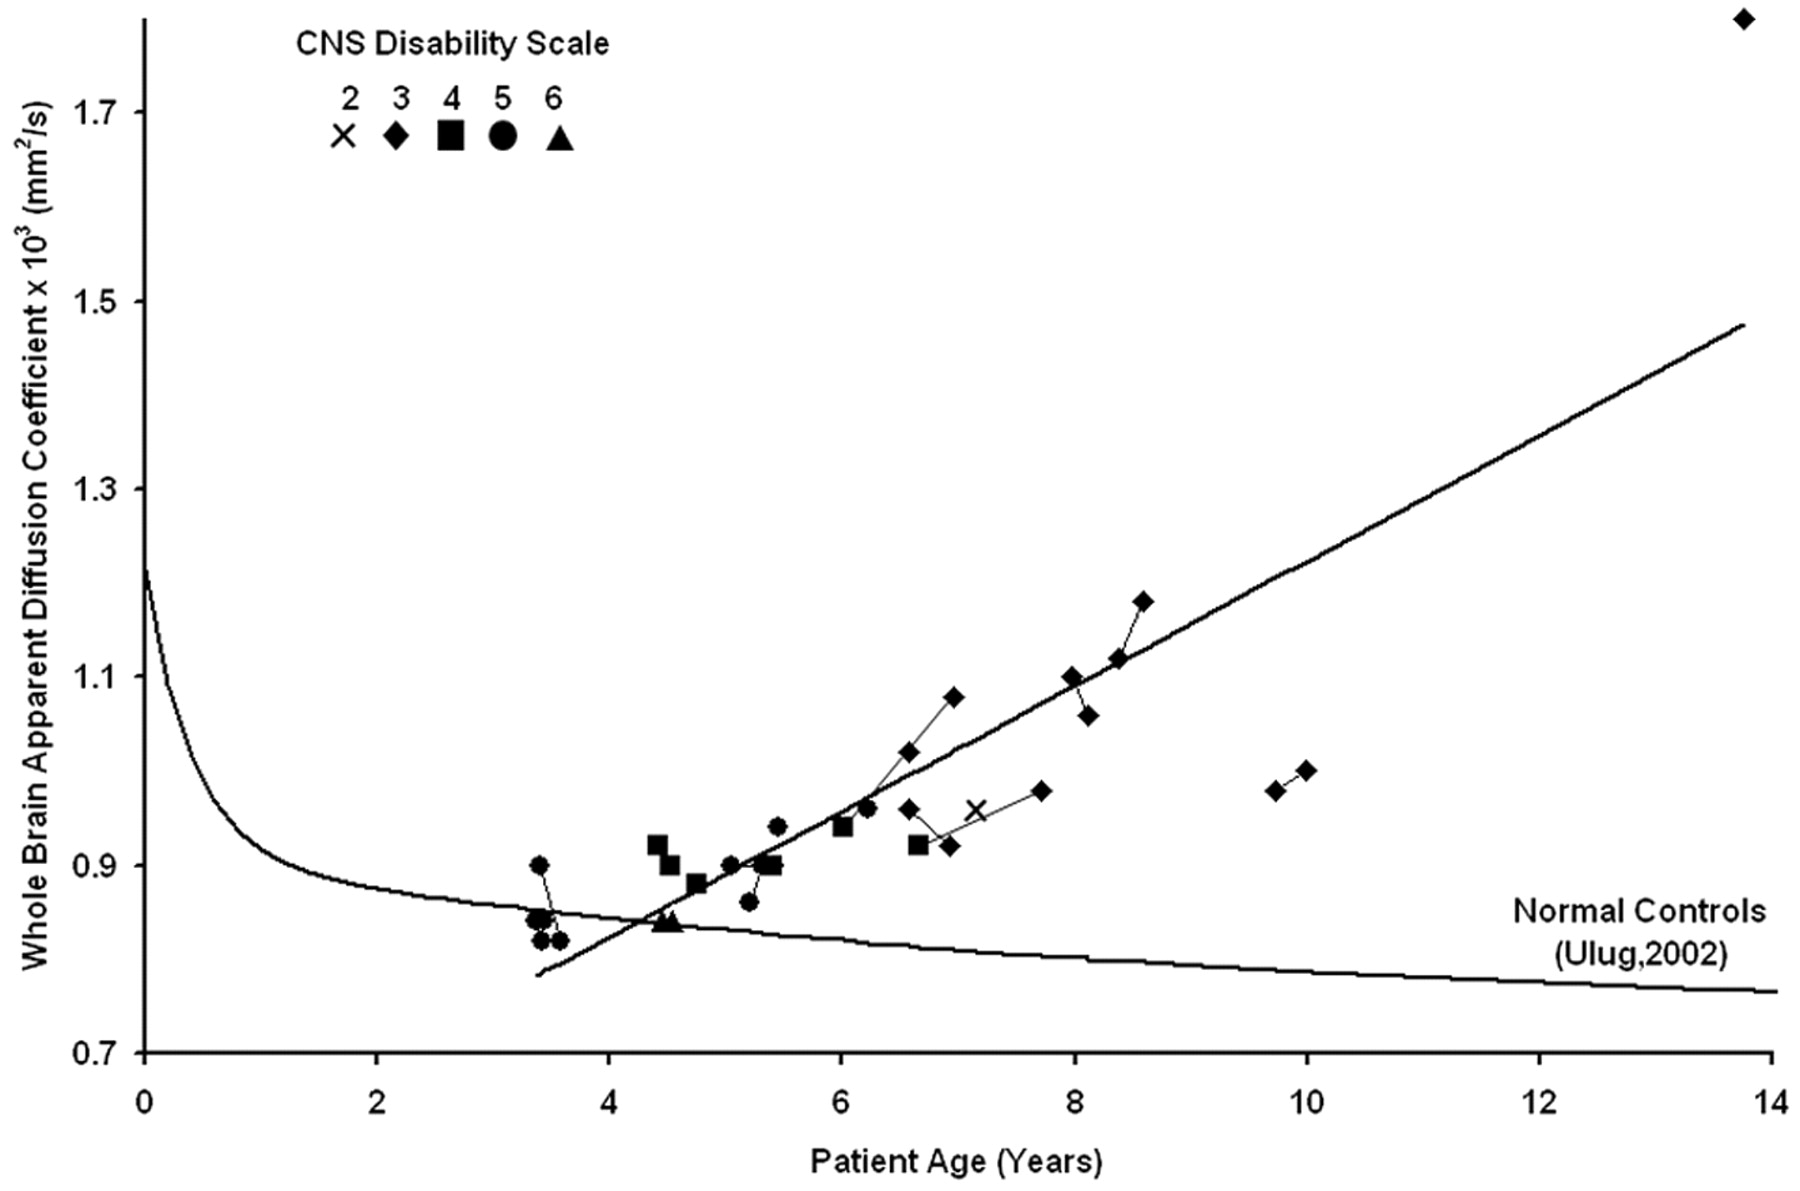
The whole-brain ADC value is plotted versus age for all of the patients showing an increasing trend over time. Serial studies are connected by lines, and the CNS disability scale is shown in the legend. Previously published whole-brain ADC values from age-matched control subjects are plotted for comparison.
A single-factor ANOVA test with a 95% confidence interval compared the mean of the whole-brain ADC histogram with the modified CNS disability scale. The ANOVA analysis yielded F > Fcrit (3.8 > 2.7) and a P value of .01, confirming differences in the means of the whole-brain ADC values between patients grouped by LINCL scale. A linear regression confirmed that the whole-brain ADC values increased with disease severity (R2 = 0.27; P = .002).
Discussion
A number of noninvasive imaging approaches have been applied to the brains of subjects with various forms of neuronal ceroid lipofuscinosis. Conventional MR imaging and CT have been used to demonstrate the presence of cerebral atrophy in multiple forms of neuronal ceroid lipofuscinosis.13–16 However, atrophic grading using conventional MR imaging is only a subjective measure of disease severity. A diffuse hyperintensity of cerebral white matter has been reported in LINCL patients.2,13 Postmortem studies of LINCL and juvenile neuronal ceroid lipofuscinosis patients confirm a loss of myelin and gliosis in periventricular white matter.2 Consistent with these findings, our patients presented with enlarged sulci and ventricles in both the supratentorial and infratentorial compartments of the brain consistent with marked atrophy. In addition, high signal intensity on T2-weighted images was observed in the periventricular white matter. A previously published CT study also showed increased subarachnoid and ventricular spaces, which were correlated with patient age.16 However, CT findings were usually normal in patients younger than 10 years of age, and these findings did not correlate with onset or severity of the abnormalities, possibly reflecting the diverse forms of neuronal ceroid lipofuscinosis in this study before genetic testing.16
MR spectroscopic imaging (MRSI) has also been used to noninvasively assess brain metabolism in various neurodegenerative diseases, such as Alzheimer and Parkinson diseases.7,17 1H-MR spectroscopy has used single voxel techniques to determine abnormal metabolic changes in patients with LINCL within specific regions, such as the white matter of the parietal lobe.18 MRSI is a sensitive though nonspecific method for assessing metabolic changes in patients with LINCL compared with normal control subjects. Multivoxel chemical shift imaging may provide further information about metabolic degradation in specific regions of the brain.19
Traditionally, DWI has been used to assess isotropic restriction of water molecules in stroke or white matter diseases of the brain, such as multiple sclerosis or ischemic leukoaraiosis.20,21 DWI has rarely been used to examine neurodegenerative diseases of the brain, which primarily affect gray matter. One study examined patients with Huntington disease with DWI and found a correlation (P = .05) between disease stage and the mean of the whole-brain ADC histograms.22 Our study showed a strong correlation between whole-brain ADC values and age along with both disease severity and duration in patients with LINCL.
This study examined the water diffusivity of the entire brain through the use of DWI. Whole-brain ADC histograms were created that included all of the voxels in the brain having signal intensities greater than a predefined threshold. This method eliminated user subjectivity required to place regions of interest on the images. The reproducibility of whole-brain ADC histograms has been confirmed as an accurate method to quantify water diffusion in a robust and objective manner.23 The whole-brain histogram was fitted using dual Gaussian functions in addition to a partial volume function to characterize brain parenchyma while excluding partial volume and CSF contamination. The global maximum of this function yielded an estimate of the whole-brain ADC value. As expected, compartments identified as brain parenchyma, partial volume, or CSF corresponded with those specific locations in the brain. The fitted Gaussian function with the lowest mean ADC corresponded with that of parenchyma containing both gray and white matter regions. Voxels labeled as containing partial volume fractions in the model were found to correspond with those regions at the boundary between gray and white matter and CSF. As the ADC value increased, voxels along the gray matter boundary were seen to migrate toward regions of CSF. Similarly, the voxels with high ADC were associated with the CSF compartment. Voxels having higher ADC values than CSF were also observed, most likely because of CSF flow artifacts in the region.
A significant correlation between increased whole-brain ADC values and patient age was found for all of the patients. Deviation of whole-brain ADC values from the control subjects became significant at 5 years of age, suggesting a common age of disease onset. This is consistent with the uniform age of manifestation of LINCL clinical symptoms. Because of the progressive increase of ADC values with age and the uniform age at diagnosis, it follows that the ADC values also correlate with time since diagnosis. Similarly, because severity increases with age, it would be expected that ADC values correlate with severity, which is indeed the case, though this correlation is less strong.
Changes in the ADC values were likely the result of a combination of physiologic mechanisms that primarily alter the restrictive nature of gray matter and, to a lesser degree, that of white matter. A study found that calcium-binding proteins linked to GABAergic interneurons in the cortex and cerebellum were disrupted in patients with LINCL.24 An additional postmortem study of 13 case subjects with LINCL found a moderate-to-severe loss of myelin and mild-to-moderate gliosis in the periventricular white matter of 10 of 13 case subjects.2 Increased signal intensity in the periventricular white matter on T2-weighted MR images in patients with LINCL was correlated with histology confirming atrophy. These findings implied a loss of neuronal integrity in gray matter and decreased myelination in white matter. This is consistent with the increased whole-brain ADC values found in this study showing the progressive nature of the disease.
Whole-brain ADC values correlated better with patient age than the modified CNS disability scale. Whole-brain ADC values may, thus, provide a more accurate physiologically based indicator of disease progression and severity. The objective acquisition and analysis criterion of whole-brain ADC histograms is an attractive feature of this technique. In addition, ADC measures provide a more continuous scale with which to assess severity in comparison with the discrete characterization of patient disability.
Conclusions
This study was conducted to evaluate whether quantitative data derived by DWI techniques can supplement clinical disability scale information to provide a quantitative estimate of neurodegeneration, as well as disease progression and severity. The results presented are consistent with known conventional MR imaging findings but suggest an objective and complementary technique to monitor disease progression. Increased whole-brain ADC values agree with imaging results characteristic of LINCL. Whole-brain ADC values were significantly correlated with patient age, disease severity as assessed with the modified CNS disability scale, and disease duration. DWI has been shown to detect variances in cerebral water diffusion abnormalities in patients with LINCL and may have the potential to monitor disease progression and severity in conjunction with the clinical characterization of patient disability.
Footnotes
This work was supported by grants 8R01EB002070-09, 5U01NS047458-02, and Nathan's Battle Foundation, Greenwood, Ind.
References
- Received October 10, 2006.
- Accepted after revision December 11, 2006.
- Copyright © American Society of Neuroradiology
In this issue


Jump to section
Related Articles
Cited By...
- Global and Widespread Local White Matter Abnormalities in Juvenile Neuronal Ceroid Lipofuscinosis
- Volumetric Description of Brain Atrophy in Neuronal Ceroid Lipofuscinosis 2: Supratentorial Gray Matter Shows Uniform Disease Progression
- Gray Matter Growth Is Accompanied by Increasing Blood Flow and Decreasing Apparent Diffusion Coefficient during Childhood
- Differential Diagnosis of Normal Pressure Hydrocephalus by MRI Mean Diffusivity Histogram Analysis
- Assessment of Disease Severity in Late Infantile Neuronal Ceroid Lipofuscinosis Using Multiparametric MR Imaging
- Arterial spin labeling and altered cerebral blood flow patterns in the minimally conscious state