
Abstract
BACKGROUND AND PURPOSE: By calculating T2 relaxation times for intervertebral disks, we tested the hypothesis that disk water concentration increases between the first and second decades of life.
MATERIALS AND METHODS: In subjects younger than 10 years old (group 1) and subjects between 19 and 20 years old (group 2), a sagittal MR image of the lumbar spine was obtained with a modified 3D fast spin-echo (FSE) multi-echo sequence. T2 relaxation times for each voxel were calculated by fitting a logarithmic regression to the signal intensity in images at 16 different echo times. T2 times were averaged for each spinal disk in each group and differences tested for statistical significance by analysis of variance (ANOVA). T2 times along the vertical axis of the disk at the midline were plotted and inspected for evidence of a central lower signal intensity region (CLSIR) in the 2 groups. We tested the differences between groups for significance with the Student t test.
RESULTS: Maps of T2 relaxation times showed different patterns in groups 1 and 2. The mean T2 relaxation times in each disk level in group 1 ranged from 74–95 ms and in group 2, from 91–119 ms. Differences between the 2 groups were significant (P < .001, ANOVA, P = .0002, Student t test of means); differences between levels were not. In group 2, development of a CLSIR was significantly more common than in group 1 (P = .0001, Student t test).
CONCLUSIONS: T2 increases in the intervertebral disk between the first and second decades of life.
Maturation of human intervertebral disks has been studied in anatomic specimens. Disks in the neonate have a translucent mucoid matrix that contains notochordal cells,1–3 whereas disks in the second decade of life have a semiopaque matrix that contains chondrocytes. Fiber content increases in the intervertebral disk during this period of life, especially in the most central region of the disk.4
MR imaging reveals changes in the intervertebral disk in the first 2 decades of life.5–9 The intervertebral disk in the neonate is characterized by high signal intensity in T2-weighted images except in the peripheral annulus fibrosus, which has a low signal intensity sharply demarcated from the region of higher signal intensity. 5 In the adult, the disk has a less homogeneous region of high signal intensity that is less well differentiated from the surrounding outer annulus fibrosus. The adult disk has another feature not seen in the juvenile intervertebral disk. This feature is a region of higher fiber content, which in T2-weighted MR images is distinguished as a central lower signal intensity region (CLSIR), popularly called the “intranuclear cleft,” despite the absence of a true cleft in histologic studies.6 Disks in young children typically conform to stage I, and those in young adults that lack evidence of degenerative change typically conform to stage II in the Priffmann classification on the basis of the appearance on MR images.10
The relative concentration of water has been used to measure the changes in the disk as a result of aging and degeneration. Disk water decreases with aging and degeneration. The effect of disk maturation on water content has not been characterized as thoroughly. On the basis of studies on intervertebral disks in cadavers, Coventry2 claimed that water content increased in the disk during the first 2 decades of life, though the exact water concentrations were not reported.
An MR-based method for estimating water content in the intervertebral disk has been described11 and applied to the study of disk degeneration.12–16 With multi-echo sequences, T2 relaxation times can be calculated from the change in signal intensity as a function of echo time (TE). The purpose of this study was to measure disk T2 relaxation times in young subjects and compare relaxation times in the first and second decades of life. We attempted to confirm Coventry's conclusions2 that water increases in the disk between the first and second decades of life. We requested and received approval to perform a pilot study in pediatric subjects younger than 10 years old and in adult subjects between 19 and 20 years old.
Materials and Methods
Subjects
We asked the parents of 4 subjects younger than 10 years old who were scheduled for MR imaging of the spine to consent to their child's participation in the study. Exclusion criteria for this group (group 1) included any suggestion in the clinical history of abnormal spinal development, birth defect, spinal deformity, or acquired spinal disease. One child was female and three children male. One of the children was treated previously for an intracranial tumor but had no spinal radiation, and the tumor did not spread. Three were children who had complete spinal studies for evaluation of the spinal cord in a Chiari I malformation. We also recruited 5 asymptomatic volunteers between 19 and 20 years old (group 2) for the study. These volunteers were recruited from the community without any attempt at randomization. For the older subjects, contraindications to MR, claustrophobia, and symptoms referable to the spine were exclusion criteria.
MR Imaging
Localizer images were used to identify a midline sagittal image plane. A single-section multiple spin-echo sequence that was developed for measurement of T2 was used. We used manual shimming to minimize the effect of different patient sizes on the radio-frequency pulses. The sequence incorporated a series of rectangular composite 180° pulses to refocus the spins at each echo time to compensate for the effects of pulse length errors as a result of spatial inhomogeneity of the radio-frequency field. A series of crusher gradients with alternating sign and descending amplitude bracketed each 180° refocusing pulse to eliminate the contributions from stimulated echoes and signals from outside the selected section.17,18 For acquisition parameters, we used a 3000-ms TR, 7.6-mm section thickness, 32 echo-train length, and 9.3-ms interecho spacing. Images were reconstructed for each TE. These parameters resulted in 32 images with increasing T2 weighting in a 6 minute and 30 second scan time (Fig 1). The precision of the measurement in a phantom study was 2.4%.12
Four selected images at TE of 19, 38, 56, and 75 ms from the modified FSE sequence illustrate the loss of signal intensity from the spinal tissues and L4-L5 disk with increasing TE. Disk tissue loses signal intensity less rapidly than vertebrae. The T2 relaxation time, the length of time required for the signal intensity to diminish by 50%, is calculated for each voxel from 16 such images.
A neuroradiologist inspected the fast spin-echo (FSE) images for evidence of vertebral anomalies or pathologic changes in the disks. For each disk, we selected a region of interest that included the disk and adjacent vertebral endplates and excluded CSF (Fig 2). We calculated T2 pixel by pixel from the multi-echo FSE by fitting the signal intensity at each TE to a single- or multiexponential function by least squares.12 We applied a threshold (less than 100 U in the ninth image) to eliminate regions with very low signal intensity that were inconsistent with disk material. After T2 relaxation times were calculated for each voxel in the regions of interest, they were displayed as an anatomic image with a color-coded 3D contour plot. For each disk, the mean T2 relaxation times were calculated.

Sagittal MR image showing the placement of a region of interest (dotted line) and the line superior to inferior in the intervertebral disk along which T2 values were sampled and plotted as a function of distance to calculate the effect of the central region of low signal intensity on the T2 relaxation times.
To objectively evaluate the presence of a CLSIR, we displayed the T2 relaxation times along a vertical line (Fig 2) through the midline of the disk. An investigator identified the T2 value in the middle of that vertical line (or the lower of the 2 middle relaxation times if the line had an even number of voxels). If there was a higher value on both sides of the middle value, the disk was determined to have a CLSIR. The magnitude of the CLSIR (in ms) was reported as the difference between the relaxation time in the middle of the disk and the average of the maxima above and below. If there was not a higher value on either side of the middle value, the CLSIR was reported as “0.”
Statistical Analysis
Differences in T2 relaxation times between levels and between groups were tested for significance by ANOVA without replication and with significance set at P < .05. We tested the differences in average T2 relaxation times between groups 1 and 2 with the Student t test of the means, with significance set at 0.5. We then tested the differences in the CLSIR between group 1 and group 2 by comparing the means for significance with the Student t test.
Results
The average age in group 1 was 3 years (1 subject, 6 years; 2 subjects; 3 years; and 1 subject, 0.75 years), and in group 2 was 20 years (3 subjects, 20 years; 2 subjects; 19 years). Image quality was considered excellent throughout the lumbar spine in 8 of 9 subjects, and T2 relaxation times were calculated for each of these 40 disks. The disks in group 1 were classified as stage I and those in group II as stage 2, by Pfirrmann's10 classification paradigm. In 1 adult, the signal intensity from the upper lumbar spine and the L1-L2 disk seemed diminished as a result of suboptimal placement of the coil, and only the 4 lower disks were included in the analysis. For the study, 20 disks in the subjects younger than 10 years old and 24 disks in the subjects between 19 and 20 years old were analyzed. No abnormalities were detected in the spinal cords, spinal canals, or vertebral columns in any of the subjects. All disks in both groups had a normal appearance on MR images.
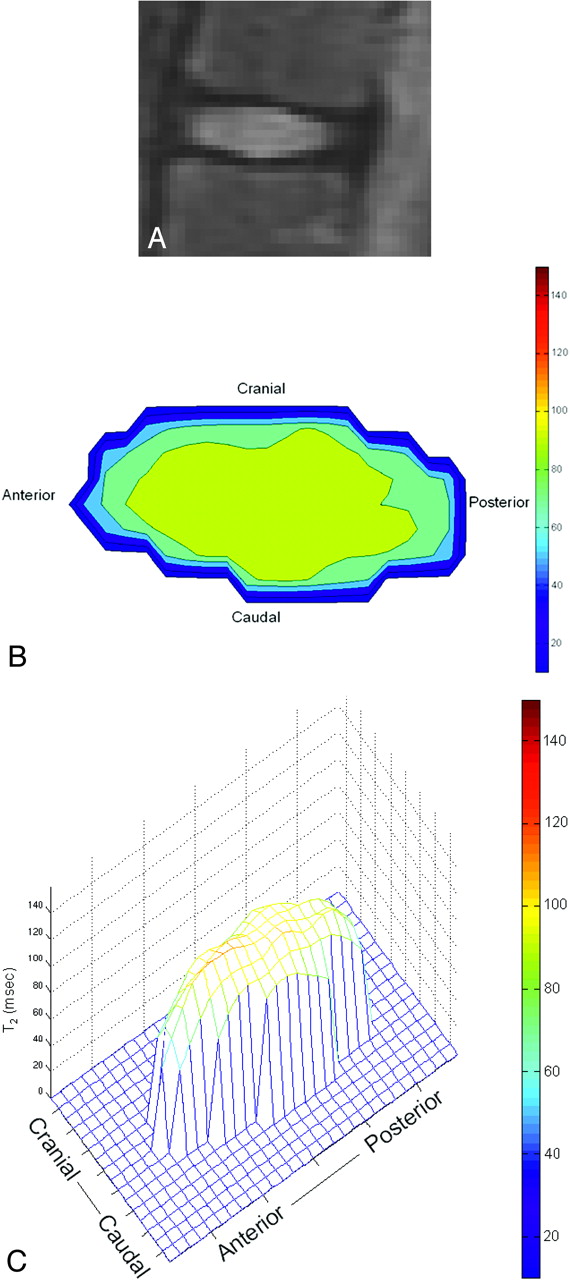
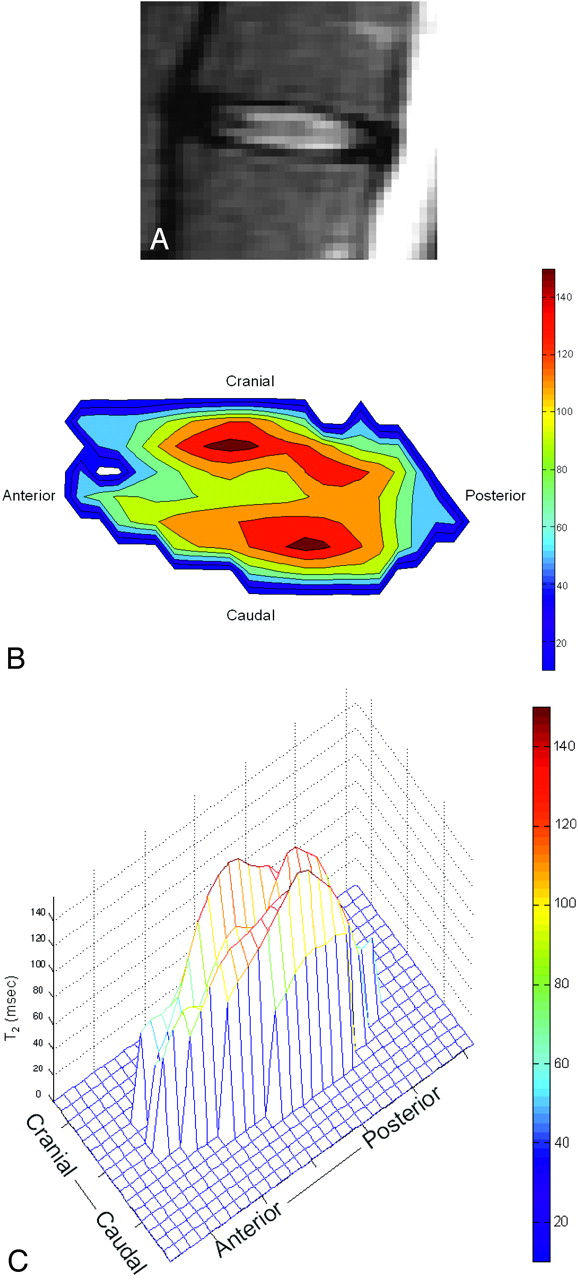
Contour plots of T2 relaxation times in the intervertebral disks revealed marked inhomogeneity of the relaxation times. T2 relaxation times were lower in the peripheral annulus fibrosus than in the nucleus pulposus or inner annulus fibrosus in both groups (Figs 3 and 4). The relaxation times decreased gradually between the midline and the anterior and posterior margins of the disk. They dropped abruptly near the superior and inferior endplates. In the disks of the younger subjects (group 1), the T2 relaxation times peaked near the middle of the disk; in the older group (group 2), the T2 relaxation times peaked near the superior and inferior endplates of the disk. In group 2 but not in group 1, a CLSIR was frequently evident on inspection of the T2 maps. The CLSIR in group 2 had generally higher T2 relaxation times than the peak T2 relaxation times in group 1 (Figs 3 and 4).

Sagittal T2-weighted MR images (A), color map of the T2 relaxation times in a sagittal section (B) and surface contour plot of T2 relaxation times in a sagittal section (C) for an L2-L3 disk in a 6-year-old subject (group 1). The plot shows the anterior edge of the disk to the reader's left and the posterior edge to the reader's right. The upper margin of the disk is toward the top of the page and the lower margin, toward the bottom. The plot shows highest values of T2 near the central portion of the disk. In the central region, the T2 values are relatively uniform.

Sagittal T2-weighted MR images (A), color map of the T2 relaxation times in a sagittal section (B), and surface contour plot of T2 relaxation times in a sagittal section (C) for an L2-L3 disk in a 19-year-old subject, displayed in the same manner as Fig 3. This plot shows a band of diminished T2 values in the central portion of the disk, where fibrous tissue content increases during maturation of the disk. This band is found commonly in the 19- and 20-year-olds in this study and rarely in the younger subjects.
The mean T2 relaxation times in the disks varied from 63.0 to 123.0 (Table). For the disks in groups 1 and 2, the average T2 relaxation times were 88.6 and 108.8, respectively. The disks in group 2 had significantly higher T2 relaxation times than the disks in group 1 (P < .001, ANOVA; P = .0002, Student t test of means). For comparison of groups 1 and 2 for each of the 5 levels separately, the significance for the differences in the means varied from P = .013 to P = .13 (Student t test). Differences between disk levels were not statistically significant (ANOVA, P = .55).
T2 relaxation times for intervertebral disks of subjects in group 1 and group 2
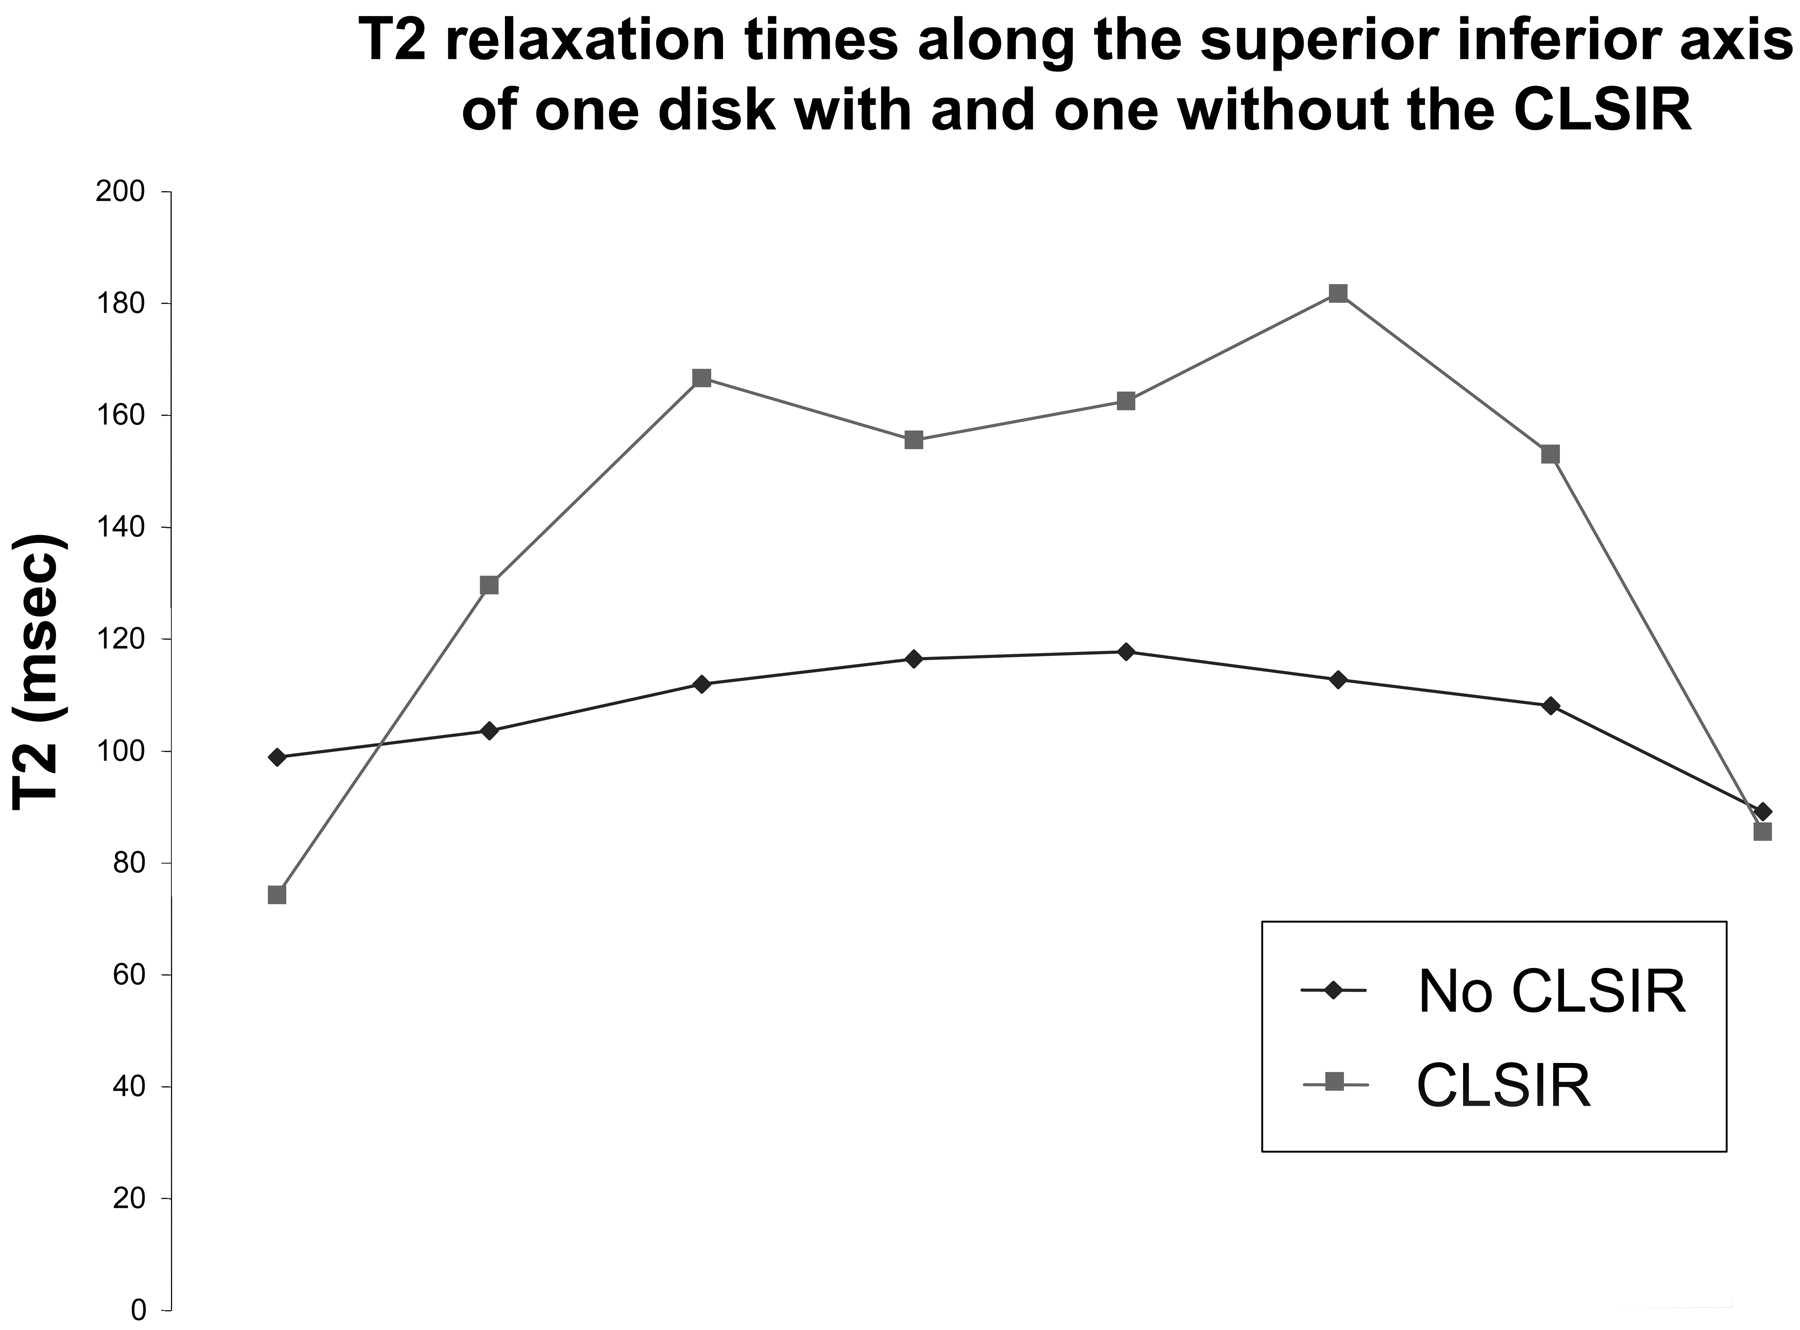
Analysis of relaxation times across the vertical line through the midline of the disks also revealed different patterns in the 2 experimental groups. The disks in group 1 usually showed longer relaxation times in the center of the disk than in the upper and lower disk margins, or only a small drop (Fig 5). The maximum drop in T2 values between the CLSIR and the higher intensity region was 30.2 ms, and the average was 3.1 ms. The disks in group 2 showed shorter relaxation times near the middle of the section than on either side of the middle (Fig 5). The maximum drop in T2 in the CLSIR was 87.5 ms, and the average was 28.5 ms. The difference between the means for the 2 groups was statistically significant at P = .0001 (Student t test assuming unequal variances).

T2 relaxation times on a line superior to inferior through the center of an L4-L5 disk in a 6-year-old subject and of an L2-L3 disk in a 19-year-old. This plot shows the CLSIR as a dip in the T2 relaxation times along the superior-inferior axis of the disk in the older subject. It also shows the relatively greater relaxation times of T2 in the older group. T2 relaxation times are shown on the vertical axis, and the distance from the superior endplate is shown along the horizontal axis.
Discussion
Our results showed a significant increase in T2 relaxation times in the nucleus pulposus of the intervertebral disk in subjects between the first and second decades of life. The increase in T2 hypothetically results from an increase in glycosaminoglycans and water content in the disk. The development of a central region of low signal intensity between the first and second decades of life accompanies a general increase in the T2 relaxation times of the disk.
Our data were consistent with the previously reported observation that human lumbar intervertebral disks gain water with maturation in the first 20 years of life.2 Actual water concentrations were not reported in that study. In general, the T2 relaxation times that we measured agreed well with those in previous studies. In one published study, the average T2 relaxation time for disks in a group between 11 and 20 years old was 114 ms.15 In a group of adults between 28 and 38 years old, T2 relaxation times in normal-appearing disks averaged 84.7 ms.12 Kerttula et al16 described mean T2 relaxation times for volunteers aged 8–22 years to be 80 ms. It was not reported how their region of interest was selected, and it has been shown that the selection of a region of interest is a significant variable when T2 relaxation times are measured. If their region of interest was below threshold, this fact would account for the lower mean T2. In contrast to our results, Antoniou et al19 reported a greater percentage of disk water content in a 2- to 5-year-old group than in a 15- to 25-year-old group. Their study differed from ours in that some degenerated disks were included in the older group.
This pilot study had limitations. A small number of subjects were enrolled in the study and no subjects between the ages of 6 and 19 years were recruited. To determine when T2 in the disk peaks, a longitudinal study is required. Further validation of the T2 measurement is needed. A report by Nightingale et al11 suggests that T2 relaxation times, measured with a relaxometer, predict disk water content accurately. The accuracy and precision of T2 measurements in a clinical scanner to estimate glycosaminoglycans and water content in the disk need additional testing, but initial results suggest that the accuracy is 2.4%.12 The larger body size of the subjects in group 2 than in group 1 may introduce some error, but we minimized error by performing manual shimming in each subject. Because our calculations to approximate the CLSIR were based on a single midline section and a single line, the relaxation times may not represent the entire disk. In our study, we obtained only 1 section, which resulted in some sampling errors. We chose 1 section to minimize subjectivity and the effects of partial volume averaging on the comparative relaxation times. Because of restrictions in MR scheduling, 2 of our group 1 subjects were studied in the morning, and all other subjects were studied in the afternoon. If diurnal changes in the disks did affect our results, it would not have diminished the differences in T2 between adults and children and therefore would not have weakened our conclusions.20
Conclusion
T2 mapping can be used to monitor changes in the disk as a result of maturation. This study suggests that T2 increases in the intervertebral disk between the first and second decades of life. The increase occurs when fibrous tissue is developing in a central region of the disk. The study suggests that tissue water increases during the maturation of the intervertebral disk.
References
- Received September 15, 2006.
- Accepted after revision November 11, 2006.
- Copyright © American Society of Neuroradiology


