
Abstract
SUMMARY: Distinguishing propagated epileptic activity from primary epileptic foci is of critical importance in presurgical evaluation of patients with medically intractable focal epilepsy. We studied an 11-year-old patient with complex partial epilepsy by using simultaneous magnetoencephalography (MEG) and electroencephalography (EEG). In EEG, bilateral interictal discharges appeared synchronous, whereas MEG source analysis suggested propagation of spikes from the right to the left frontal lobe.
In the presurgical work-up, magnetoencephalography (MEG) and electroencephalography (EEG) can be used to noninvasively localize and characterize epileptic activity. Propagation of epileptic activity, however, can lead to mislocalization of the primary epileptic locus. Here we show that by using advanced MEG source analysis, it is possible to identify the origin of spike propagation that appears synchronous on standard clinical EEG.
Case Report
The patient was an 11-year-old girl with refractory complex partial seizures since the age of 4. The seizures consisted of an abrupt onset of intense fear, shouting, laughing, clapping, or limb thrashing lasting 15–40 seconds. Her neurologic findings and developmental milestones were normal except for a slightly delayed age of walking. The previous interictal EEG revealed right dominant bilateral frontal independent interictal discharges (IIDs) as well as occasional right occipital IIDs. The first video EEG captured her ictal discharges (IDs) over the right frontal region with her habitual seizure at 6 years of age. The recent ictal EEG at 11 years of age revealed right and left frontal onset IDs with right frontal predominance. She was referred for an MEG evaluation and a 3T MR imaging as part of a presurgical evaluation.
A 306-channel whole-head MEG with simultaneous EEG (Vector View Elekta Neuromag, Helsinki, Finland) with a passband of 0.01–270 Hz and a sampling rate of 600 Hz was used for the measurements. EEG consisted of 19 electrodes to approximate a 10- to 20-electrode system during the 48-minute measurement. Coregistration between MEG/EEG and the MR imaging was performed by using anatomic fiduciary points and a high-resolution 3T MR imaging scanner (Siemens Medical Solutions, Erlangen, Germany) with a magnetization-prepared rapid acquisition of gradient echo sequence (TI/TR/TE, 2530/3.45/1100 ms; 1.3-mm thickness).
We visually identified the IIDs on MEG and EEG raw data and classified them according to a standard clinical classification.1 For the EEG, a neurologist blinded to the MEG data and analysis detected spikes by using the transverse bipolar, banana bipolar, and monopolar montages. EEG showed synchronous bilateral frontal lobe monospikes or polyspikes. Specifically, no definite spike propagation was suggested by the EEG recording.
A neurophysiologist with special training in MEG epilepsy analysis analyzed the MEG waveforms and performed the source analysis. The data were high-pass filtered at 7 Hz and low-pass filtered at 40 Hz, the standard clinical values used at our institution for searching for spikes and the clinical definition of epileptic activity.2,3 The first peak of activity was identified in each MEG IID, and the source was estimated with equivalent current dipoles (ECDs) by using a spheric head conductivity model.4 Twenty-four ECDs met our statistical evaluation criteria (goodness-of-fit >80%; 100 nAm < dipole moment <400 nAm) and were used for further analysis. The ECD inclusion criteria were derived from the experience in our laboratory and used in an article by authors from our laboratory.5
Two major ECD clusters with consistent dipole orientations were found in the right and the left frontal lobes (Fig 1). Seven of the spikes were classified as right frontal, and 17, as left frontal on the basis of the ECD locations for subsequent spike averaging. Three of 7 recorded right frontal spikes showed clear propagation to the left frontal lobe with a 15- to 30-ms peak-to-peak latency. A representative spike with both EEG and MEG recording is shown in Fig 2. The other 4 right frontal spikes did not explicitly show propagation. This observation suggested the hypothesis that left frontal spikes were propagated from the right frontal lobe. However, we cannot draw a conclusion due to the low signal-to-noise ratio (SNR) of individual spikes. To test this hypothesis, we performed the subsequent spike localization and spike averaging.

ECDs for visually detected MEG spikes coregistered with anatomic MR imaging. The dots and lines indicate the locations (green, right frontal region; yellow, left) and orientations of the ECDs, respectively..

Recorded MEG and EEG signals for 1 representative spike. In MEG, the latency between the peak signal intensity in the right and left frontal sensors was 21 ms. It was more difficult to characterize the spikes in EEG. The latency between the peak signals in the right frontal MEG sensors and the right frontal bipolar EEG-derivation (FP2-F8) was approximately 12 ms. The EEG channel names follow the International Federation of Clinical Neurophysiology (IFCN) standard..
We performed a dynamic statistical parametric mapping (dSPM)6 source analysis on each individual spike and averaged spikes for the right and left frontal clusters. dSPM is a distributed source-modeling technique using the minimum-norm estimate4 and noise normalization to obtain time-varying statistical significance maps of neuronal activity. The MEG sensors are distributed all over the whole brain including the frontal lobe. We note that in Fig 2, a few MEG channels in the left hemisphere appear synchronous with the right hemisphere. However, due to the spatial topology of all sensors, the inverse of MEG recording can suppress such ambiguous synchronous spike activity and yield clear propagation.
Because it is difficult to determine the onset of a spike, we averaged spikes by aligning the peak of the individual spike waveform to increase SNR. After we aligned and averaged all left frontal lobe spikes, dSPM for the left frontal averaged spikes showed a higher magnitude in the left than in the right frontal lobe, and the right frontal lobe spike activity peaked 21 ms before the peak of left frontal activity (Fig 3, top). The averaged right frontal lobe spike showed no preceding left frontal lobe activity (Fig 3, bottom). This validated the spike propagation hypothesis. The source locations in the left and right frontal lobes were consistent with the single- spike dSPMs: both single spikes and averaged spikes propagated from the right to the left frontal lobe. No activity preceding the right frontal averaged spikes was observed in the dSPM analysis. The estimated source locations in the left and the right frontal lobes were separated more than 50 mm, making cross-talk of dSPM unlikely, as supported by our previous calculation.7

Top: The lateral views of the dSPM obtained by temporally aligning the peak of all left frontal lobe spikes (A) and labeling the peak as time 0 ms. Activity in the right frontal lobe (B) can be seen at 21 ms before the left frontal activity (A) at 0 ms. Bottom: The dSPM obtained by temporally aligning the peaks of all right frontal lobe spikes (C). No preceding left frontal lobe activity was found. The white arrowhead indicates the location of cortical dysplasia lesion..
Further examination of structural MR imaging at 3T after the MEG measurement delineated a cortical dysplasia and developmental venous anomaly at the right frontal lobe (Fig 4) in agreement with the propagation diagnosis. The location of the lesion is also marked in Fig 3.
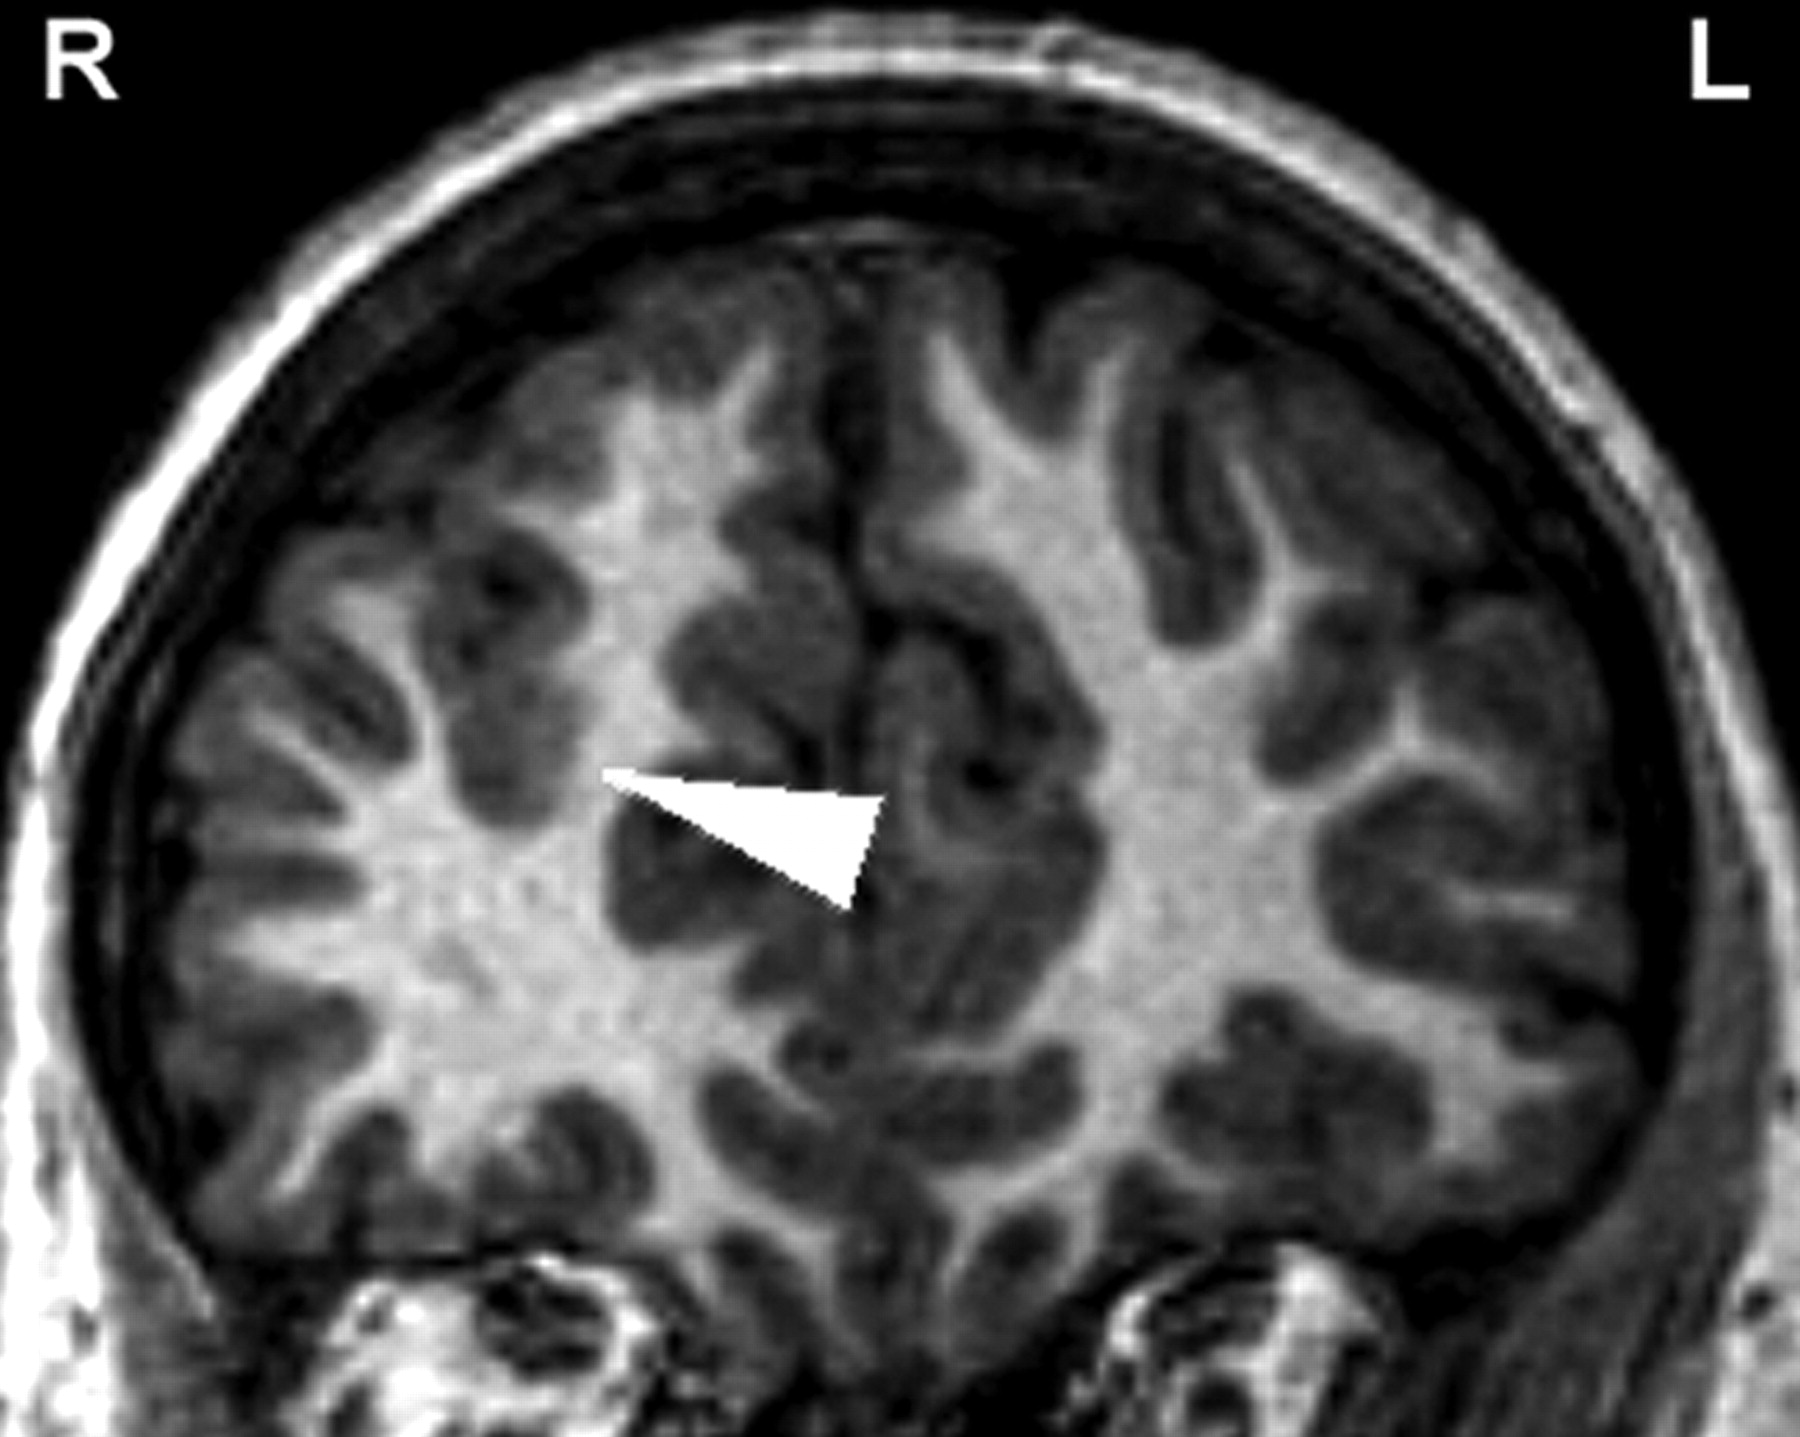
3T MR imaging shows the location of cortical dysplasia in the right frontal lobe (arrowhead).
Discussion
MEG is a noninvasive method of using an array of a superconductive quantum interference device to monitor the extracranial magnetic field elicited by the electrophysiology of the human brain. Biologically, the sources for MEG and EEG are identical: the postsynaptic currents.4 Here, we report that spatiotemporal analysis of neuromagnetic activity in a patient with complex partial seizures could improve the ability to lateralize IIDs. On the basis of standard clinical analysis of simultaneously recorded EEGs, we observed apparent synchronous spikes bifrontally, without spike propagation. This matched the prior history of the patient's multiple-surface EEG, suggesting bifrontal activity. Nevertheless, the combination of MEG ECD and dSPM analyses showed spike propagation from the right frontal lobe to the left frontal lobe. Moreover, a focal cortical dysplasia was found in the primary epileptic locus. The advantage of using MEG to detect lesions, as reported here, has also been suggested in other laboratories.8 These MEG source analyses suggested that the right frontal lobe was the primary epileptic region. We concluded that patients with apparently synchronous frontal spike activity may benefit from MEG examination to differentiate propagated-versus-nonpropagated discharges.
MEG and EEG have similar temporal and spatial resolutions. In contrast to EEG, however, MEG is principally sensitive to nonradial sources and less sensitive than EEG to deep sources.4,9 These differences in source sensitivities lead to regional differences in the SNR of sources in MEG and EEG.10 Specifically, it has been reported that frontal lobe sources can have higher SNR in MEG compared with EEG.11 Thus, MEG may provide additional information to differentiate primary epileptogenic regions that are not apparent on EEG. Even though MEG may not always be able to localize correctly epileptic activity in the medial temporal lobe, there is evidence that MEG can help to localize accurately frontal lobe epileptic foci12 and to identify the source of secondary bilateral synchrony.13
In this report, we found that EEG showed synchronous whereas MEG showed propagated spike activity. There are 2 reasons to explain this finding. We used a standard clinical 20-channel EEG, which has fewer sensors compared with the 306-channel MEG; thus, EEG may fail to have sufficient spatial sensitivity to detect minor activation at the onset of the spike. However, the more biophysically plausible reason is that MEG is only sensitive to tangential cortical current sources,4 and the spatial distribution of MEG sensitivity is different from that of EEG.10 Such a selective sensitivity can help MEG to distinguish further between synchronous-versus-propagated epileptic activity. Both may account for the advantage of MEG detection over EEG in particular cases.
The dSPM method complements the more conventional ECD source analysis of MEG and EEG signals. This distributed source model is convenient for the analysis of time courses of brain activity in multiple regions. Recently, the dSPM has been reported to be useful in the analysis of epileptic activity.2,5 In epilepsy diagnosis, dSPM is a method providing dynamic t statistics or F statistics with respect to baseline, which is the interval showing no epileptic activity. Brain spontaneous activity exceeding this baseline, such as an epileptic event, makes the source estimates significant. In our case, the spike propagation may be visible in the ECD source. However, the dSPM gives statistical maps so that we can objectively determine significant activity above background. This cannot be easily done with the ECD analysis. When we compare ECD and dSPM analyses, dSPM does not need to specify the number of sources, as required by ECD analysis. dSPM can also use anatomic constraint to improve the localization accuracy.7 Using dSPM, we can localize both single spikes and averaged spikes. In cases of low SNR, such as single-spike recording reported here, the spike averaging can mitigate the SNR limit to provide credible source estimates.
In conclusion, the combination of MEG ECD and dSPM source analyses appears useful for delineating the primary source of propagated interictal spikes. Therefore, patients with bilateral MEG/EEG IIDs are good candidates for evaluation with MEG recording and dSPM analysis to help detect spike propagation and localize the primary epileptogenic region.
Footnotes
This work was supported by the National Institutes of Health (grant # P41 RR14075), the Mental Illness and Neuroscience Discovery Institute, and the Partners Radiology Collaboration Grant.
References
- Received October 27, 2006.
- Accepted after revision February 12, 2007.
- Copyright © American Society of Neuroradiology


