
Abstract
BACKGROUND AND PURPOSE: Our aim was to compare different field strengths monitoring physiologic changes due to oral stimulation of parotid glands by using diffusion-weighted (DW) echo-planar imaging (EPI).
MATERIALS AND METHODS: Twenty-seven healthy volunteers were examined with a DW-EPI sequence at 1.5T and 3T before and after oral stimulation with commercially available lemon juice. The b factors used were 0, 500, and 1000 s/mm2. Apparent diffusion coefficient (ADC) maps were evaluated with a manually placed region of interest including the entire parotid gland. For comparison of results, a Student t test was used on the basis of the mean of the volunteer median values. To compare both field strengths, we calculated the Pearson correlation coefficient (r).
RESULTS: DW-EPI MR imaging visualized the parotid glands of all volunteers. With 1.5T, the mean ADC before stimulation was 1.12 × 10⁻³ mm2/s ± 0.08 × 10⁻³ mm2/s. After stimulation with lemon juice, the ADC increased to 1.18 × 10⁻³ mm2/s ± 0.09 × 10⁻³ mm2/s. For 3T, the ADC before stimulation was 1.14 × 10⁻³ mm2/s ± 0.04 × 10⁻³ mm2/s, with an increase to 1.17 × 10⁻³ mm2/s ± 0.05 × 10⁻³ mm2/s after stimulation. For both field strengths, the increase in ADC after stimulation was significant (P < .001). High correlations between both field strengths were found pre- and poststimulation (r = 0.955, and 0.936, respectively).
CONCLUSION: DW-EPI MR imaging allows monitoring of physiologic changes due to oral stimulation of parotid glands by using DW imaging with high correlation between 1.5T and 3T.
Diffusion-weighted MR imaging (DWI) is sensitive to the visualization of the random thermal motion of molecules, known as Brownian motion, causing incoherent phase shifts that result in signal-intensity attenuation.1,2 The diffusion can be quantified in MR imaging by using the apparent diffusion coefficient (ADC).
The most important clinical application of DWI is the detection and characterization of cerebral ischemia.3,4 Among other applications are tumor studies to distinguish cystic and edematous from solid tumors.5–8
The salivary glands represent secretory organs in which various molecules are conveyed into acinar cells. Primary saliva is secreted by acinar cells and conveyed via small terminal ducts into the external ductal system. Within the glands, alterations of blood flow occur in response to variable physiologic stimuli and pathologic disorders, such as infection, Sjögren syndrome, or ductal lithiasis. Also, radiation therapy alters the function of the salivary glands if they are not excluded from the radiation field.
A few studies were published to determine the value of DWI in healthy parotid glands and associated disorders by measuring ADC values under physiologic and pathologic conditions or after irradiation.9–12 Recently, we published a study in which different functional conditions of parotid glands were monitored by using DWI, showing a statistically significant difference of ADC values before and after oral stimulation with lemon juice by using 1.5T.13 Among the cited studies, the ADC values for a healthy nonstimulated parotid gland vary from 0.28 to 1.12 × 10⁻³ mm2/s.11,13
Besides those for DWI in the cerebrum, reported ADC values vary widely, depending on the manufacture used, the b-values, and other sequence parameters.9,11–14 These incoherent values seem to be the major drawback of using this technique in a routine clinical setting. Therefore, the purpose of the present study was to compare different field strengths monitoring physiologic changes due to oral stimulation of parotid glands by using DWI.
Materials and Methods
Twenty-seven healthy volunteers (7 women and 20 men; age range, 26–40 years; average age, 31 years) were examined. All volunteers were nonsmokers, and none of them had a history of salivary gland disease or related clinical symptoms. Additionally, to exclude subclinical disease, we performed sonography before MR imaging examinations, and acquired T1-weighted images were observed with regard to pathologic changes in every volunteer.
All examinations were performed at the same time of day, and every volunteer had to drink 1.5 L of tap water within 4 hours before the examination to create comparable circumstances, as far as possible. Before stimulation, a diffusion-weighted (DW) sequence was performed. Then 5 mL of a commercially available lemon juice was given orally, and exactly 30 seconds later, the DW sequence was repeated. The lemon juice was administered with a 5-mL syringe and had to be kept in the mouth for exactly 10 seconds before swallowing. The measurements were performed after swallowing to avoid swallowing artifacts.
This procedure was performed by using 1.5T and 3T MR imaging systems. To prevent potential dehydration, there was a 30–45 minute break between the 2 examinations, in which every volunteer drank 250 mL tap water. In volunteers, 1.5T or 3T was alternated as the first examination; thus, 13 volunteers were examined by 1.5T first and 14 volunteers, by 3T first.
The study protocol was approved by the institutional review board, and informed consent was obtained from all volunteers.
MR Imaging
We performed 1.5T examinations by using a superconducting system with a 30 mT/m maximal gradient capability and a maximal slew rate of 125 mT/m per millisecond (Magnetom Symphony; Siemens, Erlangen, Germany). The lower part of the circularly polarized (CP) head coil and a standard 2-element CP neck array coil were used. The flexibility of the neck array coil allowed positioning the N1 element (upper part of the coil) right next to the parotid gland. Initially, for anatomic localization of the parotid gland, an axial T1-weighted spin-echo sequence (TR/TE, 500/14 msec) was performed by using a matrix of 192 × 512, FOV of 210 × 280 mm (pixel size, 1.09 × 0.55 mm), a section thickness of 5 mm with an intersection gap of 1.25 mm, and 3 signals averaged. The images extended from the skull base to the undersurface of the submandibular glands, including the full volume of the parotid gland. Then, an axial DW echo-planar imaging (EPI) sequence (TR/TE, 1500/77 msec) was performed with a matrix of 119 × 128, FOV of 250 × 250 mm (pixel size, 2.10 × 1.95 mm), 6 excitations, and a section thickness of 5 mm with an intersection gap of 1 mm. A parallel imaging technique (modified sensitivity encoding algorithm [SENSE]) with an acceleration factor of 2 with 12 additional lines for self-calibrating was applied. A bandwidth of 1502 Hz/pixel was used, and 12 sections were acquired. The automatic 3D-shim routine of the magnet used the section block as the shim volume. The total acquisition time of this sequence was 1:14 minutes.
We performed 3T examinations by using an Intera (Philips, Best, the Netherlands) with a 33 mT/m maximal gradient capability and a maximal slew rate of 150 mT/m per millisecond. A 6-channel SENSE head coil was used. For localization of the parotid glands, an axial T1-weighted spin-echo sequence (TR/TE, 500/10 msec) was performed by using a matrix of 256 × 256, FOV of 230 × 184 mm (pixel size, 0.9 × 1.12 mm), a section thickness of 4 mm with an intersection gap of 1 mm, and 1 signal intensity averaged. This sequence also covered the area from the skull base to the undersurface of the submandibular glands. To obtain ADC values, we performed an axial DW-EPI sequence (TR/TE. 2000/68 msec) with a matrix of 112 × 90 (interpolated to 256 × 256), FOV of 230 × 230 mm (pixel size, 2.05 × 2.62 mm; interpolated to 0.9 × 0.9), 4 excitations, and a section thickness of 5 mm with an intersection gap of 1.85 mm. SENSE as a parallel imaging technique was also used at 3T with an acceleration factor of 2. A bandwidth of 1830 Hz/pixel was used, and 5 sections were acquired. The total acquisition time of this sequence was 2:12 minutes.
For both field strengths, fat suppression was achieved by placing a frequency-selective pulse before the pulse sequence. The b factors used were 0, 500, and 1000 s/mm2. These were applied in each of the 3 orthogonal directions to minimize the effects of diffusion anisotropy and were combined to create a trace dataset. ADC maps were generated by using a pixel-by-pixel calculation as referenced by Wang et al (Fig 1A, -B).15 ADC was defined by the following equation: ADC = [ln (SI1/SI2)]/(b2 − b1), where b1 and b2 were gradient factors of sequences S1 and S2, and SI1 and SI2 were signal intensities by the sequences S1 and S2, respectively.
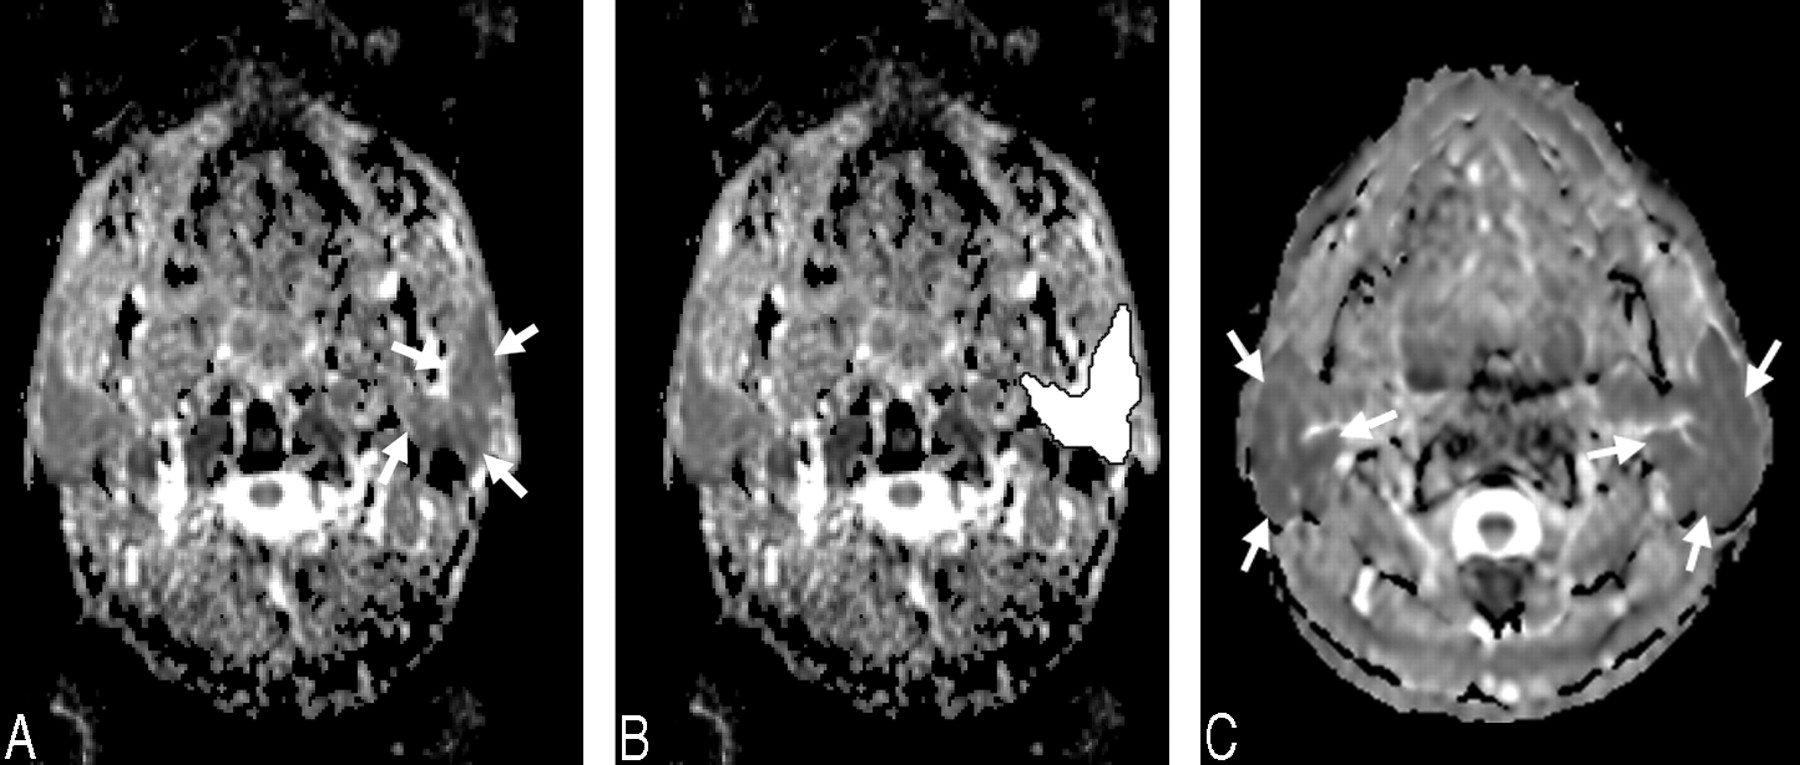
ADC image of a 29-year-old male volunteer before stimulation with lemon juice by using 1.5T (A). B, ADC measurement by placing a region of interest that contains the entire parotid gland. C, ADC image acquired by using 3T. Arrows in A and C show the left parotid gland.
Image and Data Analysis
A region of interest enclosing the entire parotid gland was placed on the ADC map, excluding the retromandibular vein (Fig 1). These procedures were performed on all ADC sections of each volunteer where left and right parotid glands were visible pre- and poststimulation. In addition, a circular region of interest containing 100–200 pixels was placed in the CSF next to the spinal cord in every volunteer. All measurements were performed by 2 investigators (C.R.H. and P.G.) in consensus by using the analyzing software MRIcro (Chris Rorden, University of Nottingham, UK), which lists every pixel intensity of each ADC section in a single region-of-interest output file per volunteer. To minimize potential misplacement due to poor resolution on ADC maps, we validated all regions of interest on axial T1-weighted spin-echo sequences for every single volunteer and region of interest in consensus. We compared the right parotid gland, the left parotid gland, and both glands, pre- and poststimulation. Combined values for both glands were achieved by taking the mean of the separate median values of each gland per volunteer.
All statistical analyses were computed with SPSS 11.5 (SPSS, Chicago, Ill). For comparison of the results, the Student t test was used, and a 2-tailed P value of less than .05 was determined for statistical significance. To compare both measurement approaches, we calculated the Pearson correlation coefficient (r), and a value of r > 0.8 was considered to represent a high correlation.
Results
In none of the 27 volunteers could pathology be detected either by sonography or by T1-weighted MR images. Consequently, images of all 27 volunteers were included in the analysis. DW-EPI successfully visualized the parotid glands of all volunteers. In none of the volunteers’ skull bases was bone or dental amalgam susceptibility or both observed, and consequently no interference with region-of-interest placements occurred. First, the median ADC values per region of interest and per person were computed. After oral stimulation, an increase of median ADC value was obtained for each measurement and field strength in every volunteer. The following analyses are based on the mean of each volunteer's median values.
For 1.5T, the ADC for the right, the left, and both glands is given in Table 1. For both sides before stimulation, the ADC value was 1.12 × 10⁻³ mm2/s ± 0.08 × 10⁻³ mm2/s (95% confidence interval [CI], 1.09 × 10⁻³ mm2/s to 1.16 × 10⁻³ mm2/s), whereas after stimulation with lemon juice, the ADC value increased to 1.18 × 10⁻³ mm2/s ± 0.09 × 10⁻³ mm2/s (95% CI, 1.15 × 10⁻³ mm2/s to 1.22 × 10⁻³ mm2/s) (Fig 2). The increase in ADC value after stimulation proved to be significant (P < .001) for the right, left, and both parotid glands.

Box plots demonstrate the increase of ADC at 1.5T after stimulation with lemon juice for the right and left parotid gland and the consumption by both glands by using a region of interest that contains the entire parotid gland visible on every section.
Mean ADC values pre- and poststimulation of parotid glands with commercially available lemon juice using 1.5T*
For 3T, the ADC for the right, the left, and both glands is given in Table 2. For both sides before stimulation, the ADC value was 1.14 × 10⁻³ mm2/s ± 0.04 × 10⁻³ mm2/s (95% CI, 1.12 × 10⁻³ mm2/ to 1.16 × 10⁻³ mm2/s), whereas after stimulation with lemon juice, the ADC value increased to 1.17 × 10⁻³ mm2/s ± 0.05 × 10⁻³ mm2/s (95% CI, 1.15 × 10⁻³ mm2/s to 1.19 × 10⁻³ mm2/s) (Fig 3). The increase in ADC value after stimulation proved to be significant (P < .001) for the right, left, and both parotid glands. As a reference tissue, the CSF was also measured in all volunteers. The ADC value for CSF was 2.55 × 10⁻³ mm2/s ± 0.2 × 10⁻³ mm2/s at 1.5T and 2.61 × 10⁻³ mm2/s ± 0.3 × 10⁻³ mm2/s by using 3T.

Box plots demonstrate the increase of ADC at 3T after stimulation with lemon juice for the right and left parotid glands and the consumption by both glands by using a region of interest that contains the entire parotid gland visible on every section.
Mean ADC values pre- and poststimulation of parotid glands with commercially available lemon juice using 3T*
When comparing ADC values achieved by 1.5T and 3T pre- and poststimulation for parotid glands, we computed a high correlation (r = 0.955 and 0.936, respectively) (Fig 4).

Box plots demonstrate the high correlation of compared field strengths pre- and poststimulation (r = 0.955, and 0.936 respectively).
Discussion
Several studies have shown the possibility of visualizing the parotid glands with DWI.9–13 Most of the cited studies dealing with functional MR imaging of salivary glands were conducted with the glands at rest, comparable with the technetium Tc99m pertechnetate uptake, which is described as parenchymal function.9–12,16 The major advantage of salivary gland scintigraphy as the method of choice for functional imaging of the salivary glands is that both parenchymal function and excretory fraction of all major salivary glands can be quantified simultaneously with a single intravenous injection of the radiotracer technetium Tc99m pertechnetate.16,17
Different approaches for evaluating the parotid glands were performed in the few studies published on this topic. Yoshino et al10 had placed circular regions of interest, which consisted of 100–200 pixels, whereas Sumi et al11 had included as much of the parotid gland as possible in their regions of interest. In contrast, Patel et al12 created regions of interest measuring approximately 74 mm2 in a relatively homogeneous area in each parotid gland. In an earlier study, we proved that there is no statistically significant difference whether measuring the whole gland or using a region of interest of a certain size, even though we decided to measure the whole parotid gland in the present study.13
The value of DWI of the parotid glands at rest showed a wide variety, ranging from 0.28 × 10⁻³ mm2/s by using an EPI sequence with 2 b factors (b = 500 and 1000 s/mm2) to 1.12 × 10⁻³ mm2/s also by using an EPI sequence with 3 b factors (b = 0, 500, and 1000 s/mm2).11,13 Thoeny et al18 proved that ADC values of the parotid glands calculated from low b values are significantly higher than those calculated from high b values, assuming that not only true diffusion but also perfusion may contribute to the ADC.
The mean ADC in the present study for parotid glands by using 1.5T and 3T before stimulation was 1.12 × 10⁻³ mm2/s and 1.14 × 10⁻³ mm2/s, respectively. The measured ADC for nonstimulated parotid glands was much higher in our study, in comparison with the cited studies. Sumi et al11 reported an ADC value for the parotid gland in a resting state of 0.28 × 10⁻³ mm2/s. In this study, a single-shot spin-echo type of echo-planar MR imaging with a neurovascular array coil was used. The TR was longer (10,000 ms) than that used in our study (1500 ms). Considering this difference, one should have expected a slightly higher ADC in the study by Sumi et al, 11 compared with our results. The mean ADC evaluated by Patel et al12 was 0.50 × 10⁻³ mm2/s ± 0.25 × 10⁻³ mm2/s by using DW-EPI. The volunteers in this study had a comparable mean age (39 years versus 31 years). The difference between this and our studies was a single acquisition parameter: the TR used by Patel et al was also longer (10,000 ms) than that used in our study. Unfortunately, Patel et al did not refer to the coil setting and detailed sequence parameters they had used, but showing an SD of almost 50% of the reference value for parotid glands seems to decrease the value of these results. Yoshino et al10 presented no ADC values for DW-EPI due to artifacts leading to no analyzable data for this technique.
Thoeny et al14 used 4 different b factors in their study (400, 600, 800, and 1000 s/mm2), also dealing with the evaluation of different functional conditions of the parotid glands. For the parotid glands at rest, the mean acquired ADC value was 0.88 × 10⁻³ mm2/s ± 0.09 × 10⁻³ mm2/s. After stimulation with a 500-mg tablet of ascorbic acid, which dissolved after a mean time of 23 minutes, a significant decrease of ADC was measured (0.81 × 10⁻³ mm2/s ± 0.06 × 10⁻³ mm2/s), followed by a significant increase after 20 minutes (0.93 × 10⁻³ mm2/s ± 0.1 × 10⁻³ mm2/s). Thoeny et al explained their observations by an emptying of stored saliva in the glands, causing the decrease, followed by an active production of new saliva and an increase of free water in the extra cellular space.14 These results are in marked contrast to the presented data in our study; with a significant instantaneous increase of ADC after short-time stimulation with lemon juice for 10 seconds. In contrast, these findings may be explained by an instantaneous increase of free water after stimulation, leading to an increase of ADC within the first 3 minutes. Presenting as well lower ADC values for parotid glands at rest, Theony et al reported observations after gustatory stimulation that were completely different from the values observed in the presented study at 1.5T and 3T. At this point, the type of stimulation may have a major impact regarding the different results, which should be evaluated in a prospective study comparing the different stimulation methods.
It seemed worthwhile for the authors to evaluate different field strengths and different manufacturers to prove the varying data published for 1.5T. The ADC values for the parotid glands at rest by using dual field strength and another manufacturer showed comparable results with the high correlation in our study. Even after oral stimulation, the computed values showed a high correlation, therefore minimizing the possibility of a methodic error in the presented study. Additionally, CSF measurements in the upper area of the neck performed in our study were consistent with the measurements made by other authors, ranging from 2.1 to 3.36 × 10⁻³ mm2/s.10,19 Thus, we can exclude a methodic error in our study, showing an ADC for CSF by using 1.5T and 3T of 2.55 × 10⁻³ mm2/s ± 0.2 × 10⁻³ mm2/s and 2.61 × 10⁻³ mm2/s ± 0.3 × 10⁻³ mm2/s, respectively.
At first sight, a limitation of the present study is an overlap of the ADC pre- and poststimulation in our population. To establish this technique in a routine clinical setting, one must gain data from a larger population to determine reference values and to gain further experience in patients with pathologic functional changes such as Sjögren syndrome.13,14 Nevertheless, the present study is a feasibility one, and its intention was not to present standard values at this time.
Some studies proved possible applications of functional imaging of the parotid gland by using ADC imaging, such as differentiation between recurrent unspecific infections (eg, sialadenitis or pyogenic parotitis) and the early stages of systemic disorders involving the salivary glands such as sarcoidosis, Sjögren syndrome, or Mikulicz disease.11,12,20 At present, the diagnosis of these important salivary gland diseases still remains difficult with the clinical imaging tests and techniques available. Furthermore, our results offer valuable practical perspectives, which eventually could replace salivary gland scintigraphy as a diagnostic feature in evaluating pathologic functional salivary gland changes. Additionally, DW-EPI might deliver more precise data in regard to monitoring functional gland changes caused by radiation therapy. Perhaps the change of functional conditions can become an additional diagnostic tool differentiating systemic disorders effecting parotid glands. These identifiable changes, in perspective, could facilitate diagnosis of underlying parotid gland disease and, therefore, have a significant impact on further nonoperative or operative treatment.
Conclusion
DW-EPI seems to be a reliable noninvasive technique for measuring parotid gland functional changes, representing its excretory function with high correlation between 1.5T and 3T.
References
- Received September 20, 2006.
- Accepted after revision January 20, 2007.
- Copyright © American Society of Neuroradiology


