
Abstract
BACKGROUND AND PURPOSE: The association of MR imaging abnormalities with clinical disability in multiple sclerosis (MS) has been disappointing. This association might be improved by imaging specific functional systems in the central nervous system—for example, the motor system in a patient with weakness. Our aim was to assess the relationship between muscle strength in MS and corticospinal tract (CST) abnormalities detected with multimodality MR imaging of the brain.
MATERIALS AND METHODS: In 47 individuals with MS, diffusion tensor imaging (DTI) at 3T was used to reconstruct the intracranial CSTs. Tract profiles depicted the variation in T2 relaxation time, magnetization transfer ratio (MTR), and DTI-derived indices (fractional anisotropy and diffusivity) as a function of normalized position along the tract. Brain parenchymal fraction was calculated as a normalized measure of brain volume. Stepwise linear regression modeling was used to determine the MR imaging indices most closely related to ankle dorsiflexion and hip flexion strength assessed with quantitative dynamometry.
RESULTS: Individuals with MS were significantly weak: Average ankle strength fell 1.7 SDs below the age-, handedness-, and sex-corrected healthy mean. Brain parenchymal fraction was not associated with weakness. A parsimonious model that includes MTR in the brain stem and MS clinical subtype explained 30%–45% of the variance in ankle and hip strength. The model was successfully applied to scans and strength data from the same individuals at an earlier time point.
CONCLUSION: MR imaging abnormalities specific to the motor tract are associated with clinical dysfunction related to that tract. The relevant abnormalities are found in the brain stem, distant from the periventricular inflammatory lesions that are common in MS. This suggests that neurodegeneration, rather than primary inflammation, at least partially explains the findings.
The heterogeneity of multiple sclerosis (MS) implies that different functional systems within the central nervous system are affected to different extents across individuals, and even that individuals with lesions in similar locations may exhibit different degrees of neurologic disability. MR imaging is capable of detecting many aspects of pathologic change in MS with high accuracy,1 but association of those changes with disability has been disappointing. One partial explanation for this difficulty is that global imaging measures are commonly related to whole-patient disability scales, such as the Expanded Disability Status Scale (EDSS),2 without separation into individual functional systems.
MS lesions have a heterogeneous appearance on MR imaging, but some general features are reproducible.3 Lesions are typically described on the basis of their increased signal intensity on T2-weighted or fluid-attenuated inversion recovery (FLAIR) sequences. Signal intensity on T1-weighted images is often, but not always, decreased (approximately 30% of lesions on T2-weighted images are associated with “black holes”), corresponding to prolonged T1 recovery time. In the presence of a gadolinium-based contrast agent, acute lesions may demonstrate increased signal intensity on T1-weighted images. The magnetization transfer ratio (MTR) is decreased, often markedly, within MS lesions.4 Finally, among the indices derived from diffusion tensor imaging (DTI) sequences, fractional anisotropy (FA) is typically decreased within lesions, whereas diffusivity is increased.5,6
Such signal-intensity abnormalities allow detection of MS lesions by MR imaging. Many times, the anatomic location of the observed signal-intensity changes makes it possible to draw inferences regarding the functional systems involved in patients with new clinical deficits. However, although lesion appearance can correspond to the onset of disability, many of the MR imaging abnormalities persist during or after clinical recovery.3 Indeed, lesions seen on T2-weighted images are pathologically heterogeneous and may correspond to inflammation, demyelination, remyelination, and gliosis.7 This reduces the ability of conventional MR imaging to track recovery following a relapse. Nonetheless, it remains possible that some MR imaging features correlate with persistent functional loss; such features could be used to guide the type of therapy prescribed and, in particular, to determine whether agents that provide neuroprotection or neuronal regeneration might be useful.
DTI with fiber tracking8–10 is a noninvasive tool for delineating the approximate locations and courses of individual white matter tracts within the brain and, as more recent work has demonstrated, the spinal cord.11 Specifically, it can identify which voxels in an MR imaging dataset should be considered part of a specific white matter tract, such as the corticospinal tract (CST). When restricted to those voxels, abnormal values of MR imaging indices (derived from both the DTI acquisitions and additional acquisitions coregistered to the DTI dataset) are highly associated with the presence or absence of MS.12 For example, MTR is generally decreased throughout the intracranial portion of the CST, whereas diffusivities are more focally increased in the periventricular white matter.
A number of studies have addressed the correlation between MR imaging abnormalities restricted to a specific tract and functional disability associated with that tract. In patients with stroke, reduction in diffusion anisotropy within the CST is associated with chronic hemiparesis13 and is apparent within a few months after the stroke.14 The specific portion of the CST affected by a stroke, as assessed by DTI with fiber tracking, is associated with the anatomic localization of weakness.15 In amyotrophic lateral sclerosis, motor disability is associated with decreased anisotropy throughout the intracranial CST, and worsening disease corresponds to further reductions in anisotropy.16 In MS, both anisotropy and the length of the reconstructed tract may be correlated with the pyramidal functional score, one of the motor portions of the EDSS.17
In this study, in individuals with MS, we examined the relationship between MR imaging indices and quantitative assessment of ankle dorsiflexion and hip flexion strength. Our hypothesis was that MR imaging indices along the motor tract can predict weakness in the relevant muscle groups, which indirectly receive input from neurons within that tract. We made no a priori assumptions about associations with specific MR imaging indices. Therefore, we used stepwise linear regression modeling to determine the MR imaging indices most strongly associated with weakness, and we assessed the validity of the model by predicting strength in the same individuals at different time points.
Methods
Demographics
As part of an ongoing study of quantitative multimodality MR imaging and disability in MS, we report results from an analysis of the 47 individuals who had both imaging and strength assessment. Disease subtype was relapsing remitting (RRMS) in 26 individuals, secondary progressive (SPMS) in 13, and primary progressive (PPMS) in 8. Twenty-seven subjects were women, and 44 subjects described themselves as right-handed. Median age was 43 years (range, 25–67 years). The protocols were approved by the institutional review boards at our institutions, and signed informed consent was obtained before examination.
In 34 individuals, EDSS was measured by the patient's treating physician within 3 months, and usually within 1 month, of the MR imaging examination. These treating physicians were not blinded to the patient's MR imaging, but they were unaware of the CST analysis described here. Median EDSS was 4 (range, 1–7) among all subjects, between 2 and 2.5 in subjects with RRMS, 6 in subjects with SPMS, and 5.5 in subjects with PPMS. Disease duration was obtained by retrospective chart review; median disease duration was 9.6 years (range, 1–38 years) among all subjects, 5.5 years in subjects with RRMS, 15 years in subjects with SPMS, and 4 years in subjects with PPMS. The mean interval between scanning and strength assessment was 0 ± 3 days. Comparison was with a group of 29 healthy controls, whose imaging results were described previously.12
MR Imaging
Full details of our scanning protocols are given elsewhere.12,18 Briefly, on an Intera 3T scanner (Philips Medical Systems, Best, the Netherlands), we obtained and coregistered19 the following MR imaging sequences, covering the brain from just below the vertex through the medulla: DTI, magnetization transfer, absolute T2, FLAIR, and magnetization-prepared rapid gradient echo, the last of which was obtained before and approximately 5 minutes after the administration of 0.1 mmol/kg of a gadolinium-based contrast agent (Magnevist; Berlex Imaging, Montville, NJ).
Tract Reconstruction
We used the method of Fiber Association by Continuous Tracking (http://cmrm.med.jhmi.edu)10 implemented in DTIStudio20 to reconstruct the whole-brain CSTs.18 One of us (D.S.R.) performed all of the tract reconstructions. At the time of reconstruction, he was aware of the disease subtype but unaware of the detailed strength measurements or EDSS score associated with that scan.
After reconstructing the CSTs, we normalized them by interpolating among a set of 7 landmarks identifiable in every brain on axial sections from the DTI color maps. This allowed us to define the distribution of the MR imaging indices at every position along the intracranial CSTs, within each of 6 segments (corresponding roughly to subcortical white matter, corona radiata, internal capsule, midbrain, pons, and medulla). We refer to plots of the MR imaging indices, parametric in tract position, as “tract profiles.”12,16,21,22 In MS, these profiles differ significantly in shape, magnitude, and asymmetry from profiles derived from healthy controls.12 Due to inconsistencies in placement of the MR imaging FOV, as well as image distortion and artifact in the lower brain stem, we were only able to obtain data from the entire medulla in 72 of 94 tracts.
Scan Selection
Up to 5 sets of scans and strength assessments were obtained per subject. For subjects with more than 1 scan, we selected, for further analysis, the latest scan, reserving the penultimate scan for model validation (see “Statistical Modeling”).
Volumetric Measurements
To quantify brain volume in our subjects, we used the SIENAX routines,23 part of FSL (http://www.fmrib.ox.ac.uk/fsl/).24 Because a variable amount of brain parenchyma near the vertex was not included on some of the scans, to ensure that a uniform volume of brain was included for all patients, we analyzed only the supratentorial brain below the Montreal Neurological Institute standardized coordinate z = 50 mm. From the SIENAX results, we selected for further analysis normalized volumes of brain, gray matter, white matter, and CSF. We calculated the brain parenchymal fraction as (gray matter + white matter) / (gray matter + white matter + CSF).25
Strength Measurement
We measured dorsiflexion strength in 92 of 94 ankles and flexion strength in 89 of 94 hips. We chose ankle and hip strength because they could be reliably quantified and because they assess both proximal (hip) and distal (ankle) lower extremity strength, both of which are important for function. We quantified strength as the average of 2 measurements at each joint taken with a MicroFET2 handheld dynamometer (MicroFET, Draper, Utah), with the subject resting supine. Technique and reference values, accounting for age, handedness, and sex, were taken from published work.26 In cases in which the examiner could not overcome the subject's strength, no result was recorded. The minimum score recorded was 0, which indicated that the limb could not overcome the force of gravity. z-scores were calculated for each ankle measurement, but absolute strength was used in the modeling described in the following section. Strength examiners were unaware of the MR imaging results at the time of examination.
Statistical Modeling
To assess the degree to which the MR imaging results can be used to predict strength, we performed stepwise linear regression modeling in Stata (StataCorp LP, College Station, Tex). Strength measurements from each joint were related to MR imaging indices from the contralateral CST.
Initially, multiple variables were entered into the analysis and were tested in various combinations. These included median MR imaging indices in each segment of the CST and across the entire tract; volume measures; and patient descriptors, including age, sex, MS clinical subtype, disease duration, and correspondence of a tract to the dominant or nondominant limb. We did not consider tract volumes because we have found these to be too variably estimated to be useful in the CST.18 Analysis was performed separately on the right and left tracts as well as on a merged dataset consisting of data from both sides. Ankle and hip strength were assessed separately.
To enter the model, we required variables to have a significant (P < .05) correlation with the residual value of the dependent variable (ankle or hip strength) at the stage of entry into the model. From the stepwise regression results, we carefully examined the selected variables to assure that they were selected in multiple scenarios (right and left tracts, ankle, and hip strength). We then selected, by hand, a subset of variables to include in the final model. No adjustments were made for multiple comparisons due to the small sample size and exploratory nature of this study. Separate models were built for tracts that included the medulla and for tracts that were only reconstructed through the pons (tracts that included the medulla were included in both models).
Although we did not have an adequate number of subjects or statistical power to perform traditional model validation on a distinct group, we examined the performance of the model on prior scans and strength data from the same subjects used to generate the model. We calculated the correlation coefficient between actual and predicted strength for both the training and prior datasets. We also assessed the fraction of predicted strength values that fell within 10% of the actual strength values, as well as the median fractional difference between actual and predicted strength.
Results
Population Results
In our cohort, normalized ankle mean dorsiflexion strength (corrected for age, handedness, and sex and reported as z-scores) was significantly low in MS (−1.7 ± 1.4, P ≪ .01). Forty ankles (43%) had strengths below the fifth percentile of controls, 47 ankles (51%) had strengths in the fifth to fiftieth percentile, and only 5 ankles (5%) had barely above-average strength. Ankle strength was lowest in SPMS and highest in RRMS (Fig 1A; RRMS, −1.2 ± 0.9; SPMS, −2.9 ± 1.6; PPMS, −1.9 ± 1.1). One-way analysis of variance demonstrated a significant effect of MS subtype on average normalized ankle strength (P ≪ .01). Unadjusted median hip flexion strength (41.5 lb) was significantly greater than median ankle dorsiflexion strength (36.5 lb) in the same individuals (P ≪ .01, Wilcoxon signed rank test). Hip flexion strength was significantly correlated with ankle dorsiflexion strength (Fig 1B; Spearman rank correlation, r = 0.70, P ≪ .01), indicating that individuals who were weak at 1 joint tended to be similarly weak at the other.

A, Box plots showing the distribution of normalized ankle dorsiflexion strength across our population of individuals with MS (92 ankles). Ankle strengths are reported as z-scores, corrected for age, handedness, and sex. Red indicates RRMS; green, SPMS; purple, PPMS. For each box-and-whisker plot, the central line represents the median, the box represents the interquartile range, and the whiskers represent the fifth and ninety-fifth percentiles. The dotted horizontal line denotes the fifth percentile of healthy controls. B, Correlation between ankle dorsiflexion and hip flexion strength in the same individuals (87 ankles and hips). The best-fitting linear regression line is shown in red.
Comparing CSTs associated with the weakest half of ankles with those associated with the strongest half, we found a few small differences in median MR imaging indices within the various segments of the intracranial CST (Fig 2). Specific differences included lower MTR among weaker patients in the pons and medulla. Surprisingly, absolute T2 was significantly lower in the midbrain among weaker patients, despite the fact that T2 tends to be increased in MS lesions. In the corona radiata and subcortical white matter, where diffusivity and T2 are significantly increased in MS on average and where MTR is significantly decreased,12 we found no differences between weaker and stronger subjects.
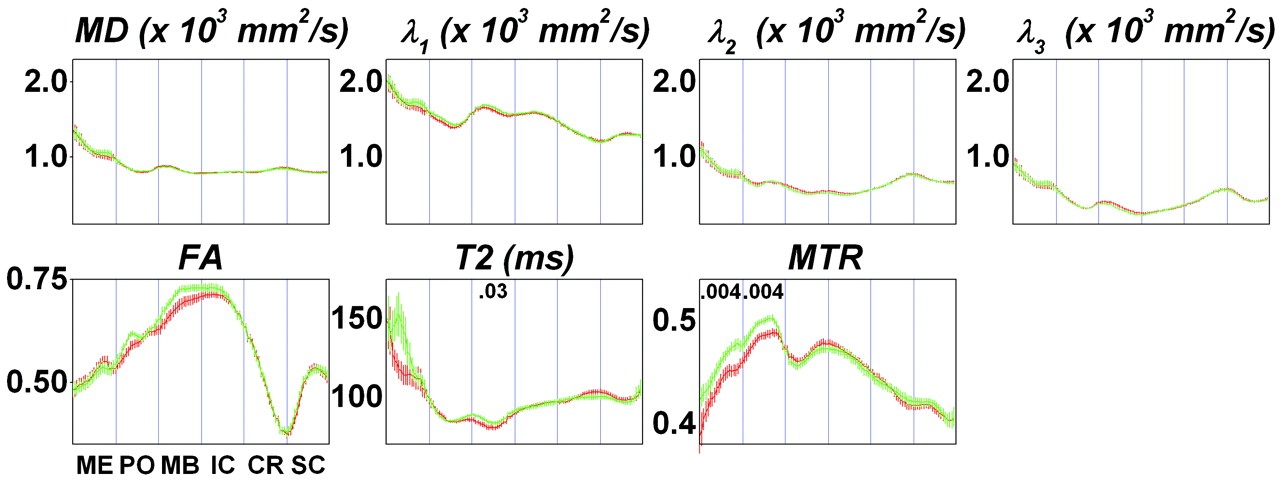
CST profiles depicting the average MR imaging index at each tract position for the stronger half (green) and weaker half (red) of our MS cohort. Strength assessment was based on ankle dorsiflexion power. The 6 segments of the CST are demarcated with vertical lines and abbreviated as follows: ME indicates medulla; PO, pons; MB, midbrain; IC, internal capsule; CR, corona radiata; SC, subcortical white matter. Error bars show 1 standard error of the mean in each tract subsegment. Each plot corresponds to a different MR imaging index, labeled as the following: MD; λ1, λ2, and λ3 (the major, medium, and minor diffusion tensor eigenvalues); FA; T2 relaxation time; and MTR. Where there was a significant difference between median MR imaging indices for stronger and weaker subjects, the P value is given within the corresponding segment at the top of the plot. Significance was determined by multiple linear regression analysis, accounting for age, sex, and number of reconstructed fibers in the CST.
Individual Patients
Analysis of individual patients illustrates the reasons we found only small differences in the group analysis of Fig 2. Figure 3A shows data from a 33-year-old man with RRMS, who had a relapse affecting the CST in the left corona radiata (arrows). Quantitative ankle dorsiflexion strength was not measured at the time of the first scanning, but on confrontational testing, he was nearly hemiplegic on the right. Mean diffusivity (MD) was elevated at the site of the lesion (right panel, red curve). One year later, he had recovered some of his power: Ankle dorsiflexion strength was 53 lb on both the right (1.5 SDs below the age-, sex-, and handedness-adjusted control mean) and the left sides (−1.9 SDs). However, the corresponding tract profile (green curve) remained essentially unchanged; if anything, the spatial extent of the abnormality increased.

Sample axial sections from MD maps (left) and CST profiles (right) from 3 individuals with MS at 2 different time points (red, earlier; green, later). The mean (black) and 90% confidence intervals (gray), derived from a collection of healthy controls, are also displayed. The CST segments are abbreviated as follows: ME indicates medulla; PO, pons; MB, midbrain; IC, internal capsule; CR, corona radiata; SC, subcortical white matter. A, Left tract: A 33-year-old man with RRMS. B, Right tract: A 40-year-old woman with RRMS. C, Left tract: A 49-year-old man with SPMS.
The data in Fig 3B come from a 40-year-old woman with RRMS, who was initially scanned during a relapse that caused bilateral lower extremity weakness; these symptoms were ultimately attributed to a lesion in her thoracic spinal cord (not shown). Left ankle dorsiflexion strength was 32 lb (−2.1 SDs) at the time of the relapse and 44 lb (−1.0 SDs) 6 months later. MD images demonstrated multiple lesions in the subcortical white matter. One of the lesions on the right (cyan arrow) clearly affected the CST, as seen in the accompanying tract profiles. The tract profiles and MR imaging maps did not change appreciably during 6 months as the patient recovered. These data also demonstrate the relatively minor artifacts induced by imperfect tract coregistration (slight misalignment of the peaks in the corona radiata and subcortical white matter) and partial volume averaging with CSF in the midbrain (dark blue arrow). Note that partial volume averaging in this region occurred among controls as well, as evidenced by the slight peak in the control profile.
Finally, Fig 3C shows results from a 49-year-old man with SPMS. He was unable to move his ankles against gravity at either time point, but the intracranial CST profiles remained normal, suggesting that his weakness was due to a diseased spinal cord (separate imaging revealed a high lesion load in the cervical cord).
Statistical Modeling
We performed stepwise multiple linear regression modeling to assess the degree to which MR imaging abnormalities can predict ankle dorsiflexion and hip flexion strength in MS. For the final model, we included variables that were reliably selected by the stepwise regression procedure in multiple scenarios, as described in “Methods.” These variables were MTR in the midbrain, pons, and medulla, as well as MS clinical subtype. The model coefficients are listed in the Table.
Characteristics of the multiple linear regression model for predicting limb strength from clinical and MR imaging data
The strongest predictor of ankle strength was MS clinical subtype—whether a subject has SPMS or not. Of the MR imaging variables, MTR in the brain stem accounted for the largest portion of the remaining explainable variance, with the final model explaining between 30% and 45% of the overall variance in hip and ankle strength. No variable relating to MR imaging abnormalities in the supratentorial CST was found to relate significantly to strength. T2 relaxation time did not enter the model nor did measures of brain volume, including brain parenchymal fraction and normalized volumes of gray matter, white matter, and CSF. Additional clinical variables, including age, sex, tract dominance, and disease duration, were not reliably and independently associated with strength. Partial correlation analysis indicated that though both EDSS and disease duration were significantly associated with clinical subtype (P < .001), there was no independent association between brain stem MTR and EDSS and only a weak association between MTR in the medulla and disease duration (P = .04).
To assess the performance of the model, we calculated the median percent difference between actual and predicted strength as well as the percentage of patients in whom strength was predicted within 10% of the actual value (Table). We then used the same model coefficients to predict ankle and hip strength in the same individuals on the basis of brain scans obtained at a median of 188 days (range, 78–464 days) before the ones used for model generation (strength testing was also performed with the earlier scans). As expected, the overall performance of the model was slightly worse on these earlier scans, explaining 17%–38% of the variance in strength, depending on the muscle group being tested and whether the medulla was included in the model. However, predicted strength remained significantly correlated with actual strength. Moreover, the median percent difference between actual and predicted strength and the percentage of strength values that were predicted within 10% of actual strength were comparable with the results from the model training dataset.
Discussion
Our results demonstrate a statistically significant predictive association between imaging abnormalities in a specific functional tract and neurologic dysfunction related to disruption of that tract. The overall association of ankle and hip strength with MR imaging abnormalities along the intracranial CST is moderate: The model presented here explains between 30% and 45% of the variance in strength. Compared with other examples of MR imaging–disability correlation in MS,27 these are respectable results. Possible explanations for the lack of stronger association are discussed in the following section.
Relationship Between CST Abnormalities and Weakness
The association between intracranial CST abnormality and weakness is complicated. For example, as in Fig 3A, weakness can be associated with abnormal tract profiles, but the tract profile abnormalities may persist even after strength is recovered. This might occur if the tract-specific MR imaging indices used here, though abnormal in MS, are not sensitive to functionally relevant aspects of recovery, such as recruitment of nondamaged fibers from the same or nearby tracts.28 Alternatively, there might be specific recovery of the small percentage (probably <20%) of CST fibers that subserve ankle and hip strength, with persistent damage to the remaining fibers. Because the tractography method does not have the resolution to separately select groups of fibers corresponding to different muscle groups, the persistently damaged fibers would then dominate the overall tract profile results. However, this explanation seems unlikely on physiologic grounds.
Perhaps surprisingly, some individuals with profound weakness had entirely normal intracranial CST profiles, as in Fig 3C. In this case, there are at least 3 explanations, which are not mutually exclusive: Our MR imaging indices may not be sensitive to tract abnormalities that are related to disability; the primary source of the weakness may be elsewhere in the brain, or, more likely, within the spinal cord; or the weakness may be related to tract atrophy, with the few remaining axons being relatively healthy. As we have shown previously,18 the number of reconstructed fibers and tract volume are highly variable, so addressing the third hypothesis will require further refinement of techniques for measuring tract-specific atrophy.
Across the entire study population, average tract profiles in MS are most abnormal in the rostral brain (subcortical white matter and corona radiata), where MS lesions commonly occur.12 However, the significant differences in tract profiles that arise from comparison of stronger and weaker subjects are not found in that portion of the tract, but rather more distally in the brain stem. This is consistent with the observation that similar CST properties in the periventricular zone can be associated with different levels of weakness in individuals.
Modeling Results and Limitations
We found that the most important variable for predicting ankle and hip strength is MS clinical subtype—whether a subject is classified as having SPMS or not—rather than a variable related to one of the MR imaging indices investigated here. It is not surprising that progressive MS is associated with weaker muscles, and this clinical variable may be a surrogate for pathologic abnormalities elsewhere in the neuraxis—most prominently, the spinal cord. This is not to say that MR imaging variables alone cannot be used to predict strength, though the prediction is not as good. For example, stepwise multiple linear regression modeling using only MR imaging variables and an inclusion criterion of P < .1 yields a collection of variables that explain 21% of the variance in ankle dorsiflexion strength. In this model, 5 MR imaging variables are required: T2 in the internal capsule, the medium (second) diffusion eigenvalue in the midbrain, MTR in the midbrain and pons, and the minor (third) diffusion eigenvalue in the corona radiata. Such a hodgepodge of different variables is difficult to interpret, and we chose to adopt a more parsimonious model with only 3 to 4 variables, even if one of those variables is not derived from the MR imaging data.
Among the MR imaging variables, MTR in the brain stem is most consistently associated with weakness. Inspection of tract profiles and scans from individuals suggests that this association is not simply due to brain stem lesions in the weaker individuals. Rather, we hypothesize that the link arises from axon loss downstream from active lesions, probably due, in part, to wallerian degeneration. The presence of these abnormalities in the brain stem suggests that even tighter correlations with disability and consequent increased predictive power for an MR imaging–based model of disability will be found in the spinal cord. The hypothesis that weakness may be related to spinal cord abnormalities is supported by pathologic findings of reduced CST area in the spinal cord29 and cord atrophy not related to local lesions.30
We also investigated the relationship of brain volume loss with strength. Brain volume loss has been associated with disability in the brain,31 and volume loss in the brain stem and spinal cord, in particular, has been specifically associated with motor weakness.32 Although brain volume was reduced in our subjects with MS (data not shown), we could not specifically relate that reduction to ankle or hip weakness. This might be due to relative sparing of the CST in the process that causes volume loss. Alternatively, factors other than motor weakness might drive the observed association between volume loss and disability in MS.
One additional reason for the lack of stronger association may be that the linear model used here is inadequate. For example, there might be significant nonlinear interactions between some of the MR imaging indices that we examined or between different segments of the CST. However, empirical modeling of these interactions, without specific mechanistic hypotheses to drive such modeling, does not seem warranted.
Value and Limitations of Quantitative Strength Measurement
In this study, quantitative isometric measurements of ankle and hip strength were obtained. These measurements are standardized and reliable, unlike some of the more traditional disability scales in MS,33,34 and can, therefore, be compared across individuals and with time.35 This feature makes quantitative dynamometry attractive for use in clinical practice and clinical trials.36
A drawback of quantitative strength measurement is that examiners must be specifically trained in proper testing technique. Positioning is critical, and the examiner must also provide sufficient resistance to fix the handheld dynamometer against the forces produced by the subject. In this study, 1 examiner (K.M.Z.) performed nearly all the strength tests; a second examiner, who was trained by the first examiner and obtained consistent results, performed the remainder.
A second drawback is that the testing method has threshold effects at both the strong and weak extremes. A few very weak subjects could not hold their legs in the appropriate position for proper testing and were all given strength scores of 0, blurring distinctions among them. Given that nearly all patients with MS in this study were weaker than age-, handedness-, and sex-matched controls, the other extreme—where subjects were able to overcome the examiner's resistance—was not a problem here.
Conclusion
These results provide a direct demonstration that tract-specific MR imaging abnormalities are quantitatively associated, albeit modestly, with particular neurologic functions. The major weakness of the study is the lack of spinal cord imaging, which, if it was available, might tighten the association between MR imaging abnormalities and clinical dysfunction. Overall, however, the results point the way toward using imaging of specific functional systems as a surrogate objective standardized method of assessing disease-related damage that can be used in the clinical setting and in the context of clinical trials.
Acknowledgments
We thank Terri Brawner, Paul Cheney, Jonathan Farrell, Kathleen Kahl, Michael Kraut, Ivana Kusevic, Susumu Mori, Marc Schieber, Michael Shteyman, and Peter van Zijl for their assistance with this project.
Footnotes
This work was supported by the National Multiple Sclerosis Society Center Award and Tissue Repair Grants: NIH RR15241, AG20012, and EB000991; and the Nancy Davis Center without Walls.
Previously presented in part at: Annual Meetings of the American Neurological Association, October 8–11, 2006; Chicago, Ill; Radiological Society of North America, November 25–December 1, 2006; Chicago, Ill; and Annual Meeting of the American Society of Neuroradiology, June 9–14, 2007; Chicago, Ill.
References
- Received March 2, 2007.
- Accepted after revision June 21, 2007.
- Copyright © American Society of Neuroradiology
In this issue


Jump to section
Related Articles
Cited By...
- Identification of posterior visual pathway lesions and MRI burden in people with Multiple Sclerosis
- Diffusional Kurtosis Imaging of the Corticospinal Tract in Multiple Sclerosis: Association with Neurologic Disability
- Longitudinal changes in diffusion tensor-based quantitative MRI in multiple sclerosis
- T2 lesion location really matters: a 10 year follow-up study in primary progressive multiple sclerosis