
Abstract
BACKGROUND AND PURPOSE: Only a few case reports and small series of intralabyrinthine schwannomas (ILSs) have been reported. The purpose of this study was to assess prevalence, MR characteristics, location, clinical management, and growth potential/patterns of ILSs in the largest series reported.
MATERIALS AND METHODS: Lesion localization, MR characteristics, lesion growth, and clinical management were reviewed in 52 patients diagnosed with an ILS between February 1991 and August 2007 in 2 referral centers. The number of ILSs and vestibulocochlear schwannomas in the cerebellopontine angle/internal auditory canal was compared to assess the prevalence.
RESULTS: ILSs most frequently originate intracochlearly, are hyperintense on unenhanced T1-weighted images, enhance strongly after gadolinium administration, and are sharply circumscribed and hypointense on thin heavily T2-weighted 3D images. The scala tympani is more frequently or more extensively involved than the scala vestibuli. Follow-up MR imaging, available in 27 patients, showed growth in 59% of subjects. Growth was seen from the scala tympani into the scala vestibuli and from the scala vestibuli to the saccule and vice versa. Twelve lesions were resected, and the diagnosis of ILS histopathologically confirmed.
CONCLUSION: ILSs can account for up to 10% of all vestibulocochlear schwannomas in centers specializing in temporal bone imaging, grow in more than 50%, and are most frequently found intracochlearly, often anteriorly between the basal and second turn. Cochlear ILSs most often originate in the scala tympani and only later grow into the scala vestibuli. Growth can occur from the cochlea into the vestibule or vice versa through the anatomic open connection between the perilymphatic spaces in the scala vestibuli and around the saccule.
Intralabyrinthine schwannomas (ILSs) are benign tumors arising de novo from the perineural Schwann cell sheath of the intralabyrinthine branches of the vestibulocochlear nerve (VCN) and initially have no component in the internal auditory canal (IAC).1 Intracochlear schwannomas develop on the intracochlear branches of the cochlear branch of the VCN. Intravestibular schwannomas develop on the end branches of the vestibular branches of the VCN. They can develop on the saccular nerve, utricular nerve, lateral, superior, or posterior ampullary nerve and are then found in the corresponding part of the vestibular system. The first ILSs were found during autopsy in 1917.2 During the 1970s, ILSs were found during labyrinthectomy performed for intractable vertigo or Menière disease.3,4 Diagnosis of ILSs was difficult on CT, and only isolated cases were described.5,6 With the advent of gadolinium (Gd)-enhanced MR imaging, an increasing number of ILSs were detected during screening for hearing loss and/or vertigo.7
The use of heavily T2-weighted images for the detection of these lesions was reported a few years later.8 Further optimization of these MR techniques has gradually increased the number of reported ILSs and has made them more accessible in the clinical work-up of patients with ILS-related symptoms, such as hearing loss, vertigo, and tinnitus. A limited number of reports, mainly case reports and small series of less than 10 subjects, described the imaging findings of ILSs.9–22 One larger series of 28 cases published by Kennedy et al23 focused on management and classification of these lesions. However, only 15 cases of this series met the above-described stringent criteria of ILS.
Little is known still about the prevalence of ILSs. In an extensive autopsy series, only 1 case in 893 petrous bone examinations was described (prevalence of 0.1%).24 A more recent MR imaging study including 800 patients with Menière-like symptoms revealed 3 cases of ILS (prevalence of 0.4%).17 Even less is known about its occurrence and patterns of growth.
Only a few studies reported on growth in ILSs and considered that growth is rare.23 Tumor growth can result in progressive hearing loss and intractable tinnitus or symptoms due to involvement of other cranial nerves caused by extension toward the cerebellopontine angle (CPA). In these cases, surgery can be considered. Hence, detection of growth is helpful in triaging patients to treatment. In the series published by Kennedy et al,23 only 3 (15%) of the 20 cases that had MR follow-up (FU) showed increase in size. These 3 lesions had an IAC component at presentation and, therefore, did not match the above-described stringent criteria of ILS.
Fast improvement in MR technology led to increased image resolution, which made more precise localization of very small ILSs possible and resulted in a higher sensitivity to detect tumor growth. It is, therefore, probable that, with the use of these more sensitive MR techniques, the prevalence of tumor may be higher than reported previously.
In this article, 52 cases of ILS, detected on MR, represent the largest series of ILSs reported. The clinical symptoms at presentation, lesion location, growth potential, growth pattern, and clinical management were evaluated.
Materials and Methods
Patients (25 female and 27 male; age range: 24–78 years; mean: 53.1 years) were recruited between February 1991 and August 2007 from 2 reference centers for MR imaging of the temporal bone. All of the patients were evaluated by a senior radiologist with more than 20 years of experience in MR of the head and neck area (J.W.C.) and by a senior resident (A.T.). Presenting symptoms and number of MR FU examinations, as well as the elapsed period of time between the first and last MR study, were noted. The MR-systems, sequences,25,26 and sequence parameters used are listed in Table 1.
Summary of sequence parameters of the 6 MR units used
Only lesions that enhanced strongly (0.1 mmol/kg of intravenous Gd administration), had sharply delineated edges on the enhanced T1-weighted images, and had sharply delineated signal intensity loss in the high-intensity intralabyrinthine fluid on the heavily T2-weighted images (Fig 1–3) were included. When available, the signal intensity of the lesions on the unenhanced T1-weighted images was compared with the signal intensity of normal fluid.
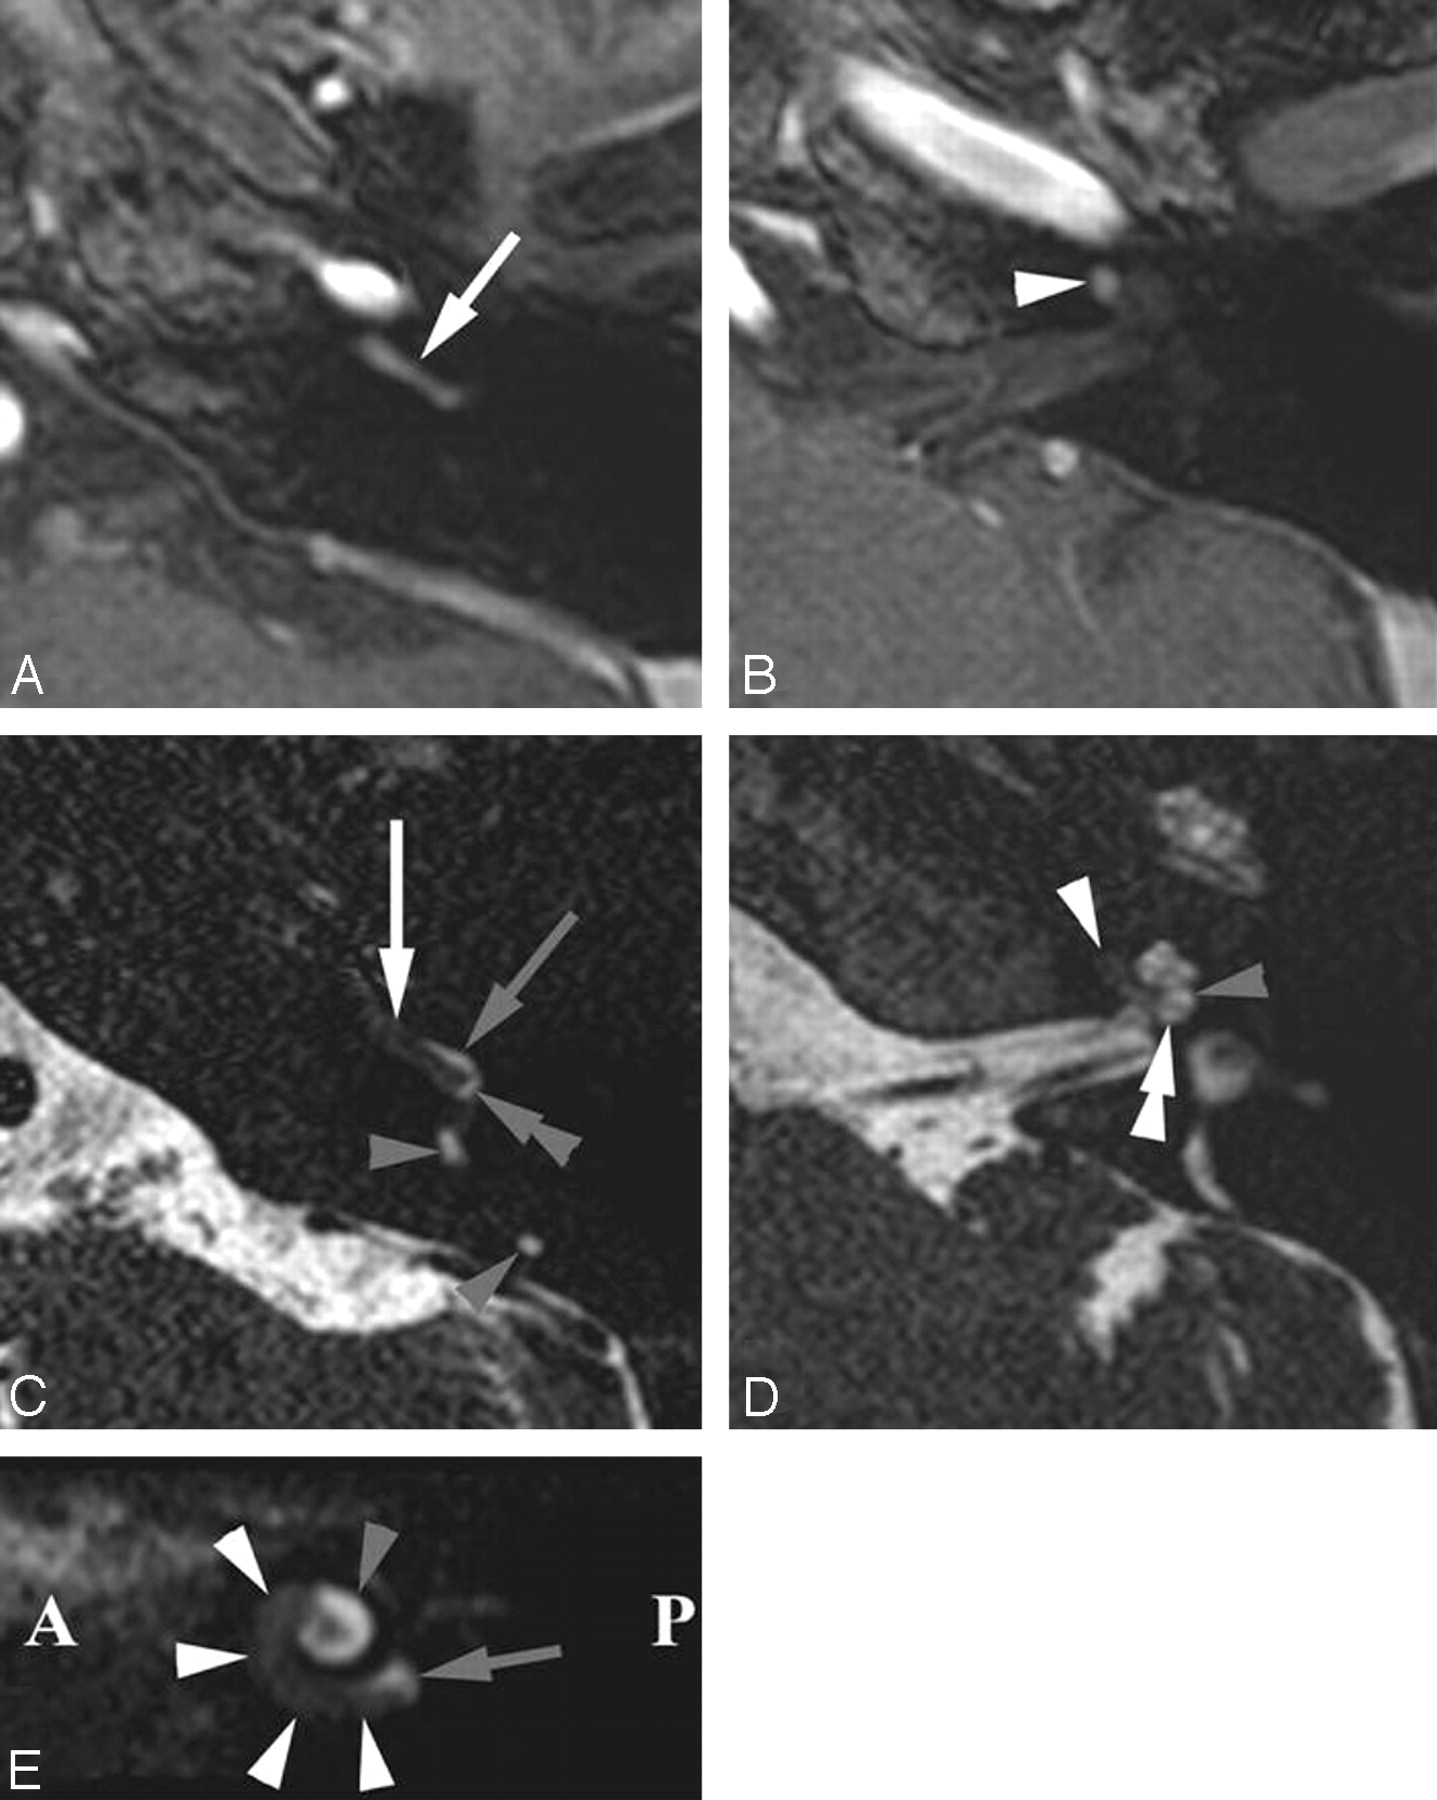
Intracochlear schwannoma in the BT and anterior SecT of the left cochlea. Axial Gd-enhanced T1-weighted images (A and B) and heavily T2-weighted DRIVE images (C and D) through the BT (A and C) and ST (B and D) and parasagittal DRIVE reconstruction (E). A, Enhancing schwannoma in BT (white arrow). B, Extending into anterior part of SecT (white arrowhead). C, Schwannoma anteriorly in both scalae of the BT (white arrow) and posteriorly in the ST of the BT (double gray arrowhead). Normal fluid in posterior SV (gray arrow): schwannoma occupies ST more than SV. Normal fluid in posterior semicircular duct (gray arrowheads). D, Anterior parts of both scalae of SecT were occupied (white arrowhead). Normal fluid in SV (gray arrowhead) and ST (double white arrowhead) of posterior SecT. E, Schwannoma in BT and anterior part of SecT (white arrowheads). Fluid signal intensity still present near the round window (gray arrow) and posterior part of ST (gray arrowhead). A indicates anterior; P, posterior; SecT, second turn of cochlea; BT, basal turn of cochlea; ST, scala tympani; SV, scala vestibuli.
For every included intralabyrinthine lesion the exact location was assessed (Table 2), including the following: left or right side, basal turn/basal and second turn/second turn/second turn and apical turn/apical turn of the cochlea, utricle or saccule of the vestibule, and lateral/superior/posterior semicircular duct. On the heavily T2-weighted images, it was also noted whether the lesion was involving the scala tympani, scala vestibuli, or both.
Intralabyrinthine distribution of the 52 intralabyrinthine schwannomas at initial MR imaging
Tumors with a component inside the IAC on the initial MR were excluded from the study. Tumor growth and growth patterns were evaluated in the patients who had FU. The management of the lesions, serial MR FU, or surgical removal was reviewed. In case of surgical removal, the reason for removal was checked.
Results
Fifty-two ILSs were detected on MR imaging with 22 lesions on the right side, 29 on the left side, and 1 bilateral case. Forty-two ILSs were found in one center (AZ St-Jan Brugge AV [AZB]), and in the same time period 388 CPA and/or IAC schwannomas were detected in that same center.
Clinical data were available in 49 of 52 patients. The main presenting symptoms were sensorineural hearing loss in all of the patients except 1. The hearing loss was progressive in 41 patients and sudden in 7 patients. Ten patients had vertigo; in 3 of them this was the initial symptom and in 2 the vertigo was acute. Twenty-nine patients presented with tinnitus, which was nonpulsatile in 21 of them and pulsatile in 8 of them. Of the 52 ILSs, 42 were found in the cochlea (80.7%), 7 were found in the vestibulum and/or semicircular canals (13.5%), and 3 were found in both the cochlea and vestibular labyrinth (5.8%; Table 2).
All of the lesions enhanced strongly on Gd-enhanced T1-weighted images and caused a loss of the high signal intensity of the intralabyrinthine fluid on heavily T2-weighted images. The lesions showed sharp edges on both T1- and T2-weighted images. Unenhanced T1-weighted images were available in 23 patients showing slightly higher signal intensity than the intralabyrinthine fluid in 21 of these cases.
In 27 patients, 1–5 FU MR examinations were available (mean: 3 FU MRs). The FU period ranged between 2.0 and 192.0 months (mean: 39.5 months). Tumor growth was seen in 16 of these patients (59.3%; Fig 2–5; Table 3). At presentation, 11 of these lesions were located in the cochlea. Eight of them increased in size inside the cochlea (Figs 2 and 4), 2 progressed to the vestibule (Fig 4), and 3 extended in the IAC (Fig 4). Two lesions initially involved the cochlea and vestibule, one further increased in size inside the vestibule and the other extended further in the vestibule and extended into the semicircular canals (SCCs). Of the 3 ILSs that initially were found in the vestibular labyrinth, 2 showed further growth in the vestibular labyrinth but also extended in the scala vestibuli of the basal turn of the cochlea (Fig 3), and 1 increased in size and further extended in the semicircular canals.

Intracochlear schwannoma gradually occupying entire ST and growing into the SV. Axial heavily T2-weighted DRIVE images through the basal turn (BT) (A, C, and E) and second turn (SecT) (B, D, and F). A and B, At presentation, obliteration of entire ST of the BT (gray arrowheads). Normal signal intensity inside SV of BT (gray arrows). Normal hyperintense fluid signal intensity inside SV (white arrowhead) and ST (white arrow) of the SecT. C and D, Six months later, loss of fluid signal intensity in SV posteriorly in BT (double gray arrowhead), confirming extension from ST (gray arrowheads) into the posterior SV. Anterior part of SV was still open (gray arrow). Invasion of the ST in anterior part of SecT (white arrow), confirming further growth inside the ST. E and F, After 15 months, further growth inside SV of BT (double gray arrowheads). ST of BT is still completely obliterated (gray arrowheads). No further growth in ST of SecT (white arrow). SV remained open (white arrowhead).

Intravestibular schwannoma growing inside the right vestibular system and into the basal turn (BT). Axial DRIVE images through the midcochlea (A and C) and upper part of the SecT (B and D) and axial DRIVE image through the BT. A and B, Intravestibular schwannoma inside the anterior vestibule (white arrows) and ampulla of the lateral SCC (white arrowhead). C and D, 2 years later, schwannoma extended more posteriorly in the vestibule (white arrows) and occupied a larger part of the ampulla of the lateral SCC (white arrowheads). E, The schwannoma also grew back into the cochlea. Because of the open anatomic connection between the saccular perilymphatic space and perilymph inside the SV, the schwannoma will first grow into the SV of the posterior BT (double white arrowhead). Normal signal intensity still present in anterior part of SV (white arrowhead) and entire ST (white arrows).
Patterns of lesion growth (n = 16)
In 12 patients (23.1%), the lesion was surgically removed. Preoperative symptoms included hearing loss in all (100%), tinnitus in 10 (83%), and vertigo in 6 (50%). Surgical removal was complete in all of the patients but sacrificed any residual hearing (100%). Tinnitus remained in 8 (67%) of 10 patients and vertigo in 5 (43%) of 6 patients. Gustatory trouble appeared in 3 patients (25%). The indications for surgery and the surgical approach for lesion resection are summarized in Table 4. The diagnosis of benign schwannoma was histologically confirmed in all of the operated patients. Postoperative MR imaging performed in all of the patients depicted no residual tumor or tumor reoccurrence.
Rationale and radical surgical approach for lesion resection (n = 12; 23%)
Discussion
ILSs develop from the Schwann cells of the intralabyrinthine branches of the VCN. Tumors first developing from branches in the IAC and later growing into the labyrinth are not considered as primary ILSs and were, therefore, excluded from this study.
This study confirmed that ILSs have a slightly higher signal intensity than normal intralabyrinthine fluid on unenhanced T1-weighted image. Twenty-one of the 23 available unenhanced T1-weighted images showed a clear signal increase. In both remaining cases the schwannoma was very small and partial volume averaging probably caused the somewhat lower signal intensity. Hence, high signal intensity on unenhanced T1-weighted images can be used to support the diagnosis of ILS.
The ILSs present as strongly enhancing, sharply circumscribed lesions on the Gd-enhanced T1-weighted images. The resolution of the T1-weighted images does not permit one to distinguish involvement of the different scalae inside the cochlea, though the resolution of these images is constantly increasing. In the early 1990s, 3-mm- and later 2-mm-thick Gd-enhanced T1-weighted SE images were used. Even with the current 1.2-mm-thick T1-weighted images obtained every 0.6 mm and in-plane resolution of 0.5 × 0.5 mm or less, it remains difficult to distinguish in which scala the lesion is situated.
The resolution of T2-weighted 3D-sequences is greater than standard 2D sequences. The excellent contrast between the high signal intensity of the intralabyrinthine endolymphatic and perilymphatic fluid on the one hand and the hypointense signal intensity of the surrounding bony labyrinth, osseous spiral lamina, and basilar membrane of the cochlear duct on the other hand makes it possible to distinguish in which scala the ILS is located (Figs 1 and 2). Isotropic imaging with voxel sizes down to 0.35 × 0.35 × 0.35 mm are state of the art today. The currently most-used sequences are constructive interference in steady state, driven equilibrium (DRIVE), fast imaging employing steady-state acquisition (FIESTA), 3D-turbo spin-echo and 3D-fast spin-echo sequences. On these T2-weighted images, ILSs appear as hypointense lesions with sharp borders, replacing the high signal intensity fluid (Figs 1–3).
Other diseases can also cause intralabyrinthine enhancement.27 The most important differential diagnosis is labyrinthitis. In labyrinthitis, the enhancement is often pronounced and less sharp than in ILS. Often the complete cochlea and/or vestibular system are enhancing, and the enhancement becomes weaker and eventually disappears on FU MR studies. In ILSs, however, the enhancement is most often restricted to a part of the cochlea or vestibular system, the enhancement persists, and the lesion keeps the same size or increases in size as the ILS grows. In acute labyrinthitis the high signal intensity of the intralabyrinthine fluid remains visible, whereas in subacute or chronic labyrinthitis, fibrosis or calcification can replace the fluid, but the edges of the regions with signal intensity loss are most often unsharp.
The diagnosis was confirmed with FU MR studies in 27 patients. In 12 patients the diagnosis was confirmed after resection of the ILS, which is a histologic confirmation in 23% (5 of these patients only had 1 preoperative MR examination). This is a limitation of this study, because the other 77% of ILSs could not be confirmed with 100% certainty. However, available FU MR examinations in 27 (52.0%) of the patients (7 of these cases were also histologically confirmed) and stringent MR imaging characteristics in the remaining 20 patients (38.5%) and correlation with the clinical findings make the diagnosis of ILS in these patients very probable.
In this study, 52 ILSs were discovered over a period of 16.5 years, thus, at a rate of 3 per year. To assess the prevalence of ILSs, the number of ILSs detected was compared with the number of VCN schwannomas found in the IAC and CPA over the same 16.5 years in 1 of the 2 participating centers (AZB). Over this period, 388 IAC/CPA schwannomas and 42 ILSs were found, and, therefore, in this center, 10.8% of the schwannomas were ILSs. This high prevalence is certainly biased by the special referral pattern in the 2 specialized centers. The prevalence of ILSs in this study is much higher than in the autopsy2 and Menière3,4 studies. However, in these studies the patients had no clinical symptoms or only vertigo, which explains the lower prevalence.
Eighty percent of the ILSs were confined to the cochlea, and 17 (40.5%) of the 42 intracochlear schwannomas were situated anterior in the cochlea in the transition area between the basal and second turn (Fig 1). Thin, high-resolution T2-weighted sequences allowed exact location of the ILS. Twenty- six of 42 intracochlear schwannomas were situated in the scala tympani (Fig 2), and the other 16 cases involved both scalae (Figs 1 and 2). Not one ILS was located purely in the scala vestibuli, proving that most intracochlear schwannomas develop from the scala tympani, which can be explained by the anatomic relationship of the nerve branches with the 2 scalae. Preferential growth in the scala tympani is thought to be due to the proximity of the nerve to the scala tympani in the region where it leaves the osseous spiral lamina, called the habenula perforate, which runs toward the organ of Corti28 (Fig 6). From the scala tympani, these lesions may then extend into the scala vestibuli17,29 (Fig 2).

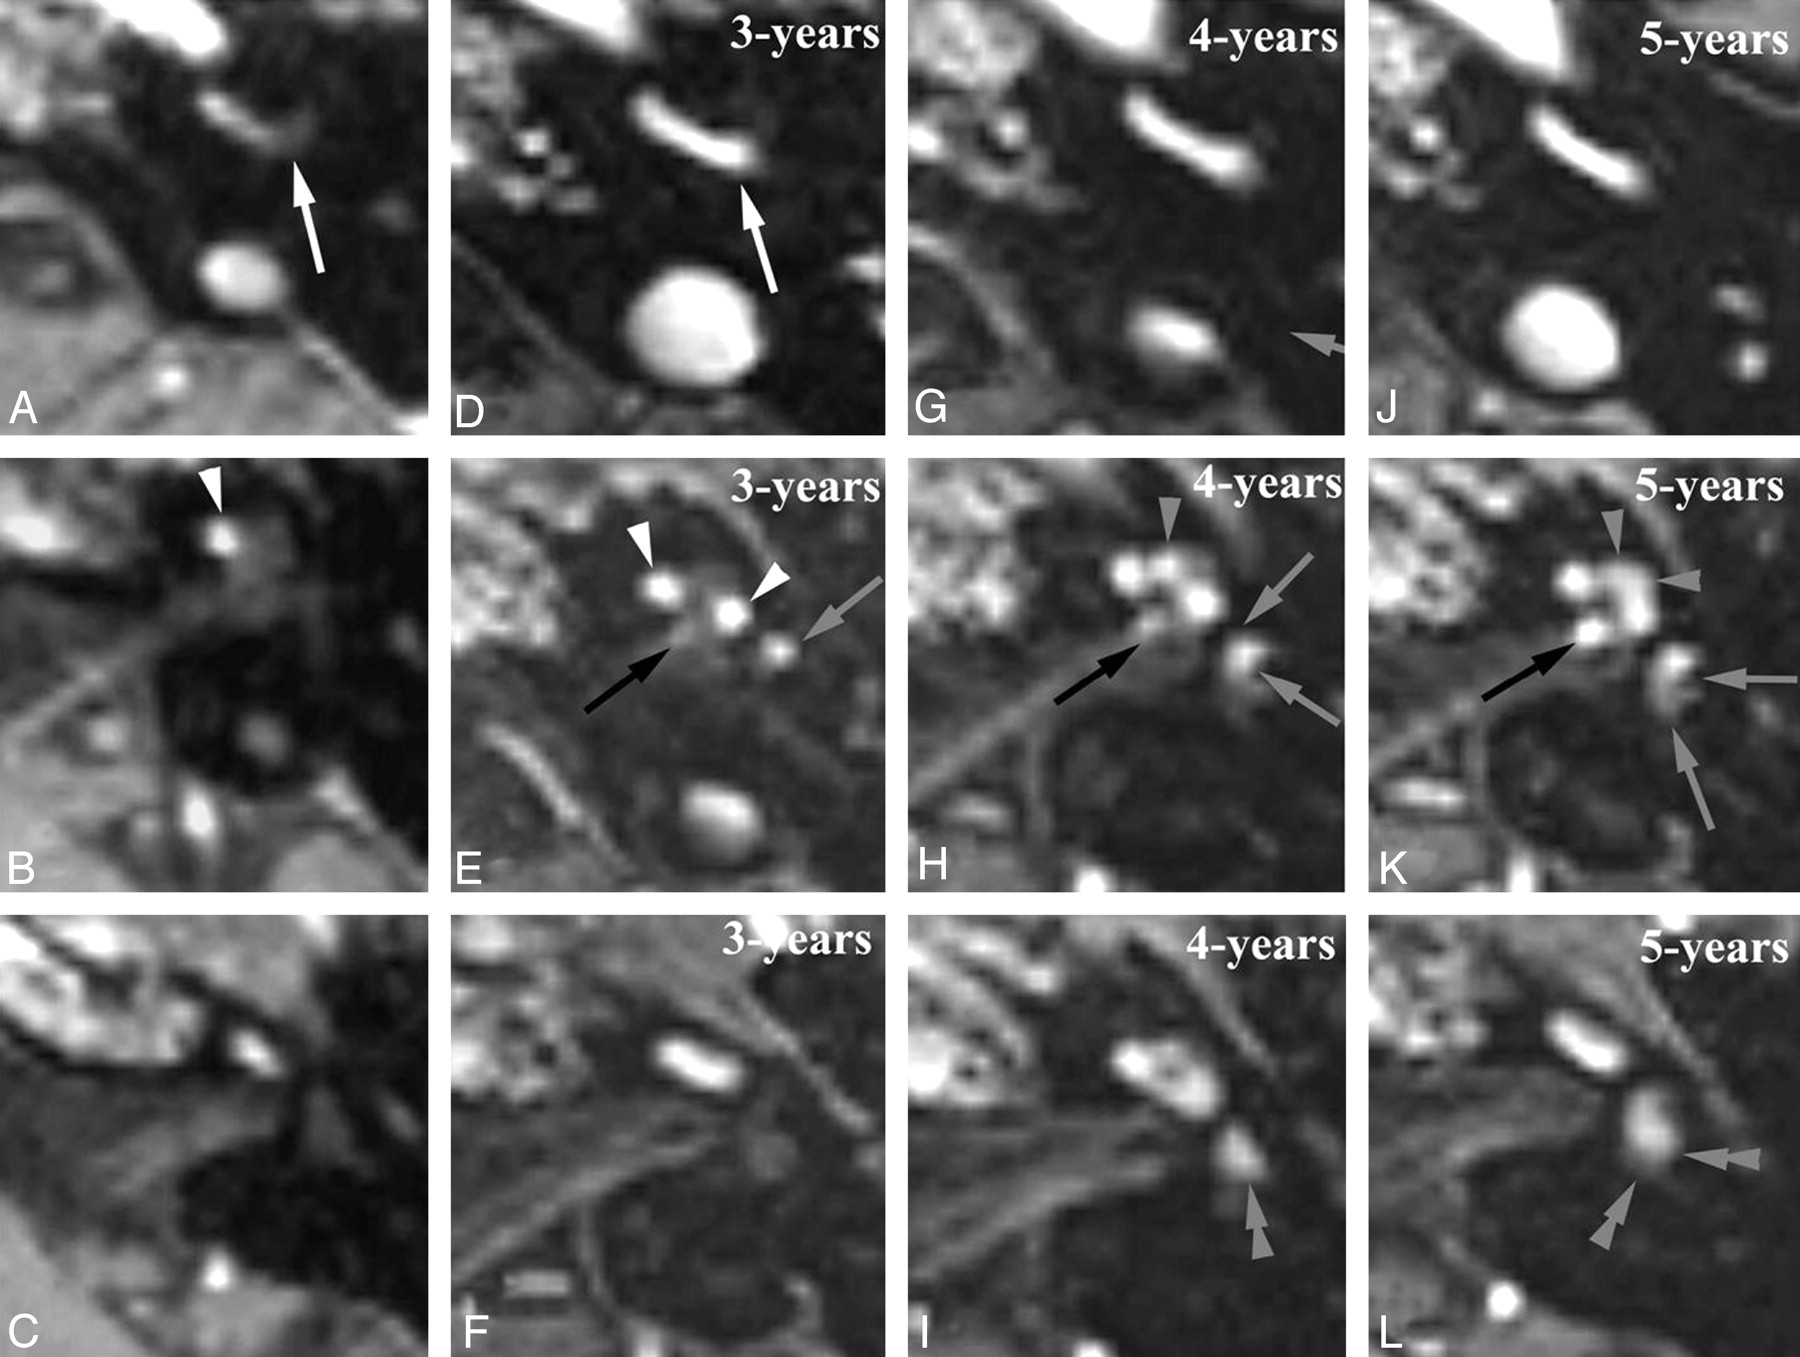
Intracochlear schwannoma with a 5-year MR FU showing growth into the vestibule and IAC. Axial Gd-enhanced T1-weighted images through the basal turn (BT) (A, D, G, and J), second turn (SecT), and apical turn (AT) (B, E, H, and K) and the upper part of the SecT and vestibule (C, F, I, and L). A–C, At presentation: enhancing schwannoma anteriorly in BT (white arrow) and SecT (white arrowhead). D–F, 3-years later, growth into posterior part of both BT (white arrow) and ST (white arrowheads) and into anteroinferior part of the vestibule (gray arrow). Subtle enhancement near the IAC fundus (black arrow) suspicious for extension into the IAC. G–I, After 4-years, enhancement at IAC fundus became nodular (black arrow), confirming growth into the IAC. Enhancement in AT (gray arrowhead) and the anteroinferior part (gray arrows) and also in the superior part of the vestibule (double gray arrowhead), indicating further growth. J–L, After 5 years, further growth with complete enhancement of AT (gray arrowheads), larger extension in IAC (black arrow), and involvement of posterior-inferior (gray arrows) and superior parts (double gray arrowheads) of the vestibule.

Flow chart illustrating the initial location (A) and the patterns of growth (B). SSC indicates semicircular canal; sv, scala vestibuli.
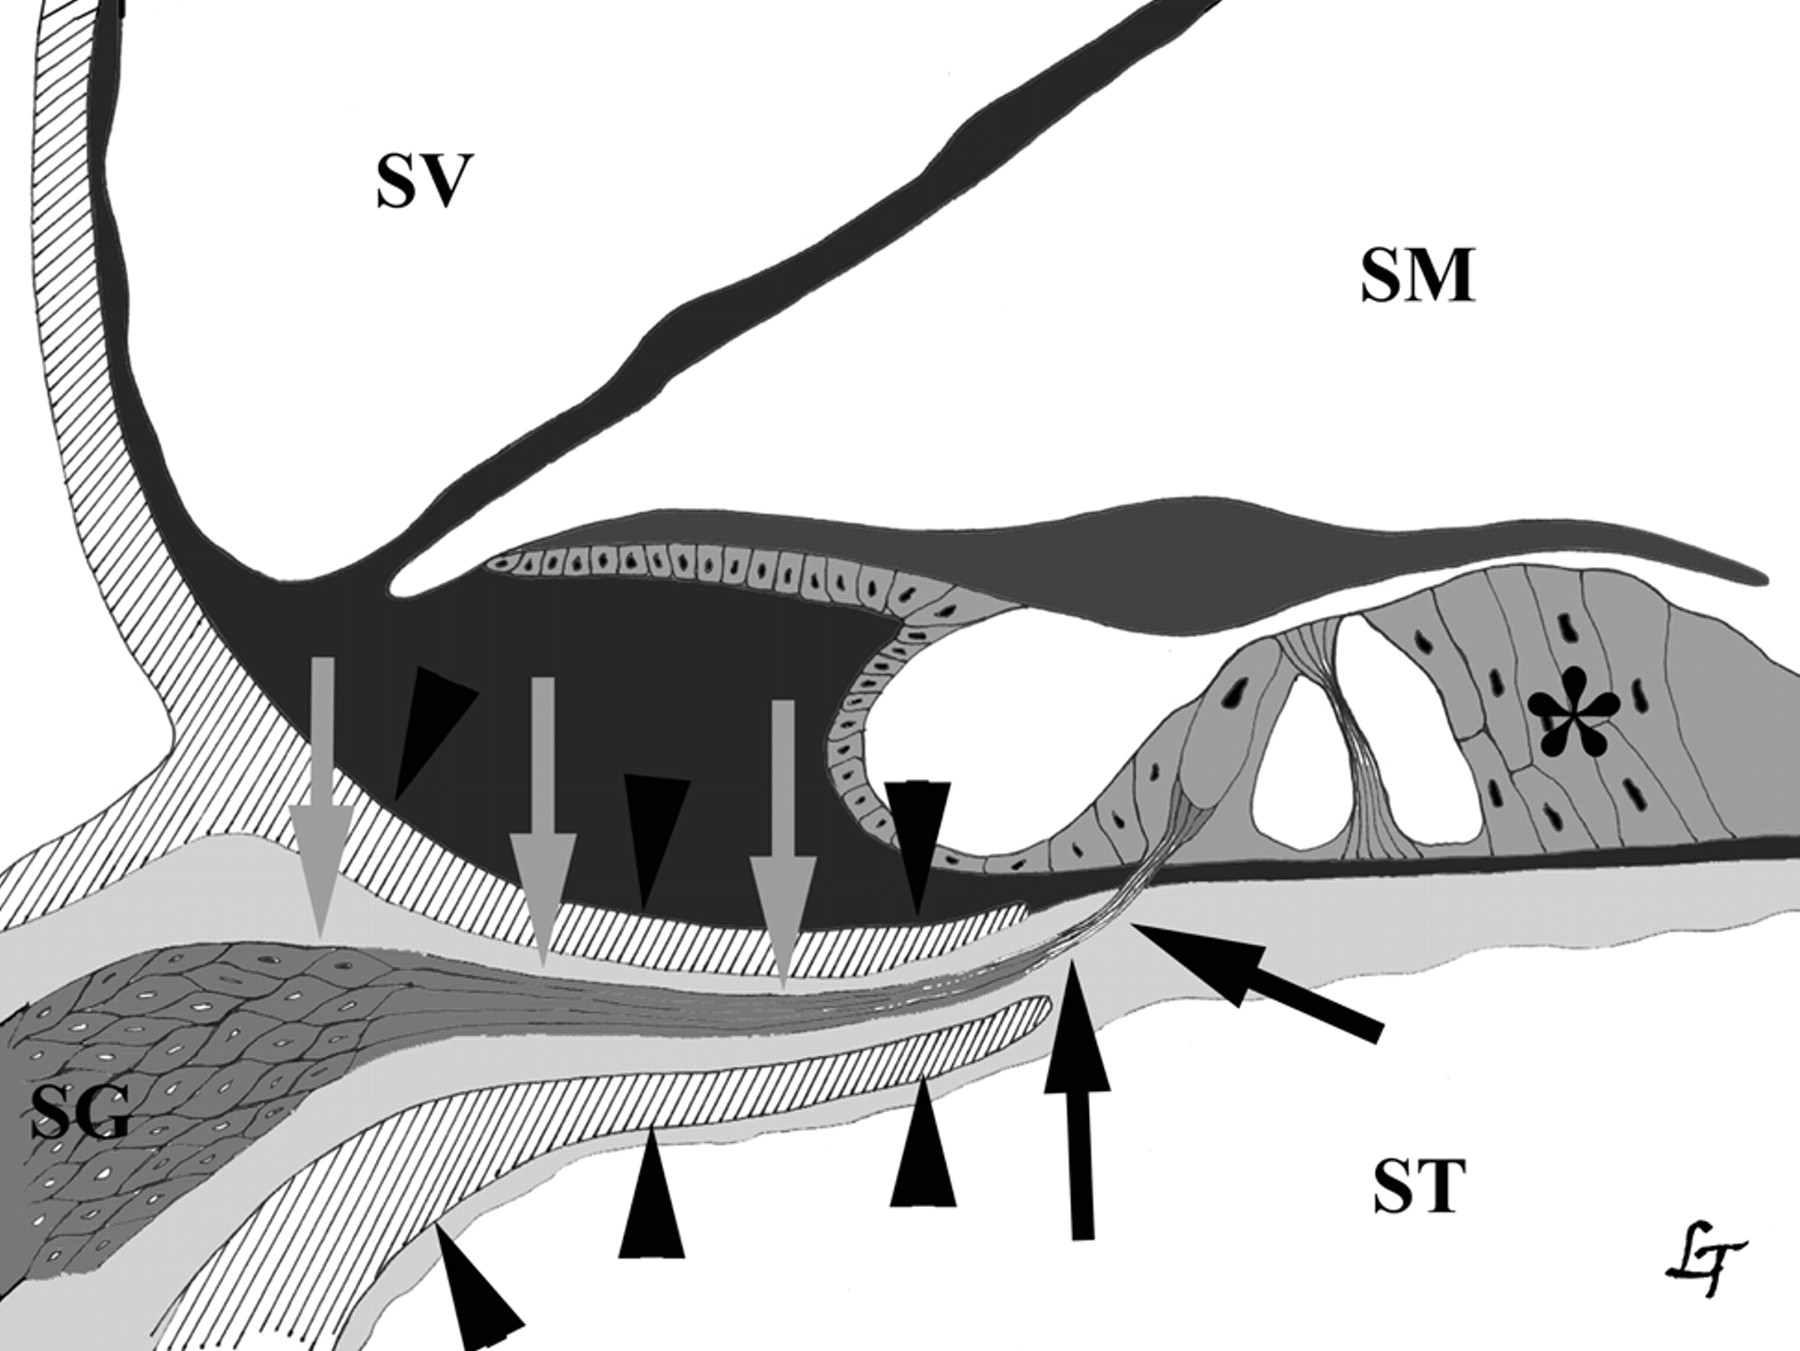
Anatomic relationship between cochlear nerve and scala tympani (ST). Cochlear nerve (gray and black arrows), organ of Corti (*), osseous spiral lamina (black arrowheads). SG indicates spiral ganglion; SM, endolymph in scala media; SV, perilymph in scala vestibuli.
In 8 of the 16 ILSs involving both scalae, the scala tympani component was larger than the scala vestibuli (Figs 1 and 2) component; in 7 other cases, the scala tympani and scala vestibuli component had the same size. Only 1 ILS had a larger component in the scala vestibuli than in the scala tympani; this lesion was located in the apical turn of the cochlea, near the helicotrema, with extension in the distal part of the second turn. In 3 cases, an ILS initially situated in the scala tympani was on FU MR seen in both the scala tympani and vestibuli (Fig 2), indicating that intracochlear schwannomas probably have their origin in the scala tympani and later on grow into the scala vestibuli.
Involvement of only the vestibular labyrinth, vestibule, and SCCs is far less frequent and was found in 7 patients (13.5%). Most frequently the ILS involved both the vestibule and SCCs (4 of the 7 cases; Fig 3). In our series, only 3 patients had neurofibromatosis type 2. One had 2 ILSs involving the posterior and lateral SCC of the left inner ear, the second had an ILS in the cochlea and a schwannoma in the ipsilateral IAC, and the third presented with a cochlear schwannoma and a schwannoma in the contralateral IAC.
Three ILSs had both a cochlear and vestibular component with obliteration of all 3 of the cochlear turns of the cochlea and only the anterior part of the vestibule, whereas the posterior vestibule and SCCs were spared (Fig 4). This could indicate that once the ILS has occupied all of the available spaces in the cochlea, it will grow into the closest part of the vestibule, the anterior saccular part, which has an anatomic open connection with the scala vestibuli of the cochlea (Fig 7). The scala tympani ends at the round window and therefore has no connection with the saccule. Consequently, schwannoma, originating in the scala tympani, first fills up the entire scala vestibuli before it grows freely from the scala vestibuli into the perilymphatic space of the saccule (Fig 8).

Coronal histologic section through the transition area of the basal turn of the left cochlea and the anteroinferior part of the left vestibule. Perilymph inside scala vestibuli (black arrow) is continuous with perilymphatic space around the saccule (double black arrowhead). No connection between the perilymph inside the scala tympani (black arrowhead) and perilymph inside vestibule. Macule of the saccule (gray arrow) and utricle (gray arrowhead), stapes with footplate inside the oval window (double gray arrowhead). Permission to publish obtained from Prof Dr F. Veillon and Prof Dr H. Sick, CHU Strasbourg, Hôpital Hautepierre, France.

Drawing of the intralabyrinthine perilymph (light gray) and endolymph (dark gray) spaces with indication of ILS extension routes. Intracochlear growth from scala tympani (ST) to scala vestibuli (SV; black arrowheads). ST ends at round window (white arrowheads). Growth from cochlea into vestibule and vice versa through the anatomic open connection between perilymphe in ST and perilymphatic space around the saccule (black arrows). ME indicates middle ear cavity; S, endolymph in saccule, stapes (double black arrowhead); U, endolymph in utricle.
The 8 ILSs involving the vestibule all occupied the anterior part of the vestibule; only 3 occupied both the anterior and posterior part; none was found in the posterior part alone. This suggests that ILSs originate more frequently in the anterior vestibule. The ILS also involved the SCCs in 3 of these patients, and in 2 others the schwannomas were restricted to the SCCs. In 1 of these patients 2 separate schwannomas were found in 2 ampullae of the left vestibular system, confirming the diagnosis of neurofibromatosis. Hence, isolated involvement of a SCC in nonneurofibromatosis patients could only be found in 1 patient (2% of the cases) and seems to be very rare. In 16 (59.3%) of the 27 patients with available FU examinations, tumor growth could be detected, which is similar to the behavior of CPA and IAC schwannomas.30
Eleven of these growing ILSs were initially located in the cochlea. Intracochlear enlargement of the ILS was seen in 9 of them (Figs 2 and 4), growth into the saccular part of the vestibule in 2 (Fig 4), and growth into the IAC in 3 (Fig 4). In 4 of the 9 patients with intracochlear growth, initially the ILS was only present in the scala tympani, and on FU involvement of the scala vestibuli occurred (Fig 2). This supports our impression that most of the intracochlear ILSs start in the scala tympani and only after growth involve the scala vestibuli. In 2 patients the ILS grew from the cochlea into the anterior or saccular part of the vestibule (Fig 4), confirming the extension route from the perilymphatic space in the scala vestibuli to the perilymphatic space around the saccule, through the anatomic opening between these 2 spaces (Figs 4, 7, and 8). In these patients scalae of the basal turn, second turn, and apical turn were completely occupied by the ILS. This suggests that ILSs, originating in the scala tympani, cannot directly grow into the anterior vestibule, because the scala tympani is sealed at the level of the round window. Therefore, these lesions first have to grow into the scala vestibuli, and growth toward the anterior vestibule or saccular vestibule will only occur once the scala vestibuli is almost completely filled with ILS. In 3 patients the ILS grew from the cochlea into the IAC (Fig 4), again after the nearly complete cochlea was occupied by the ILS. Hence, in only 3 of the 27 ILS patients with serial MR imaging or in 11.1% of these patients growth into the IAC could be noticed. Therefore, the higher frequency of IAC involvement in other series of ILSs23 can probably be explained by inclusion of schwannomas originating in the IAC and growing into the labyrinth.
In 2 patients the lesion grew from the vestibule into the cochlea, and in both patients the most posterior part of the scala vestibuli of the basal turn became involved (Fig 3). This illustrates again that the anatomic connection between the anterior vestibule and scala vestibuli of the basal turn is used as an extension route for ILSs not only from the cochlea to the vestibule but also vice versa. Involvement of only the scala vestibuli of the basal turn was only seen when an ILS grew from the vestibule into the cochlea and never occurred in initially intracochlear ILSs.
In 2 patients the initial ILS was located in both the cochlea and vestibule. In these patients the tumor enlarged inside the vestibule in one of them and enlarged inside the vestibule and also grew into the SCCs in the other patient. In both patients the scala tympani and vestibuli of all of the cochlear turns were almost completely filled and, therefore, we were probably dealing with an initially cochlear schwannoma that grew into the vestibule and that, on our FU studies, further enlarged inside the vestibule and SCCs.
The most frequent reason to remove the ILS was “prevention” because of growth and consequent fear of involvement of the facial nerve, extension into vestibule, and IAC, which can eventually result in more morbidity and/or more extensive or difficult surgery. However, the decision to remove these ILSs can be questioned, because there were no real data available on ILS growth at that time, and it was the surgeon's personal experience that often led to the decision to operate or to observe. In 4 patients there was MR confirmed “tumor growth,” which led to surgery. With the present data on tumor growth of ILSs and the results of our series of operated cases, we would now advocate surgical removal only for those tumors that have invaded or are obviously on the way to invade the IAC and are thereby placing the facial nerve at risk for injury.
In conclusion, ILSs can account for up to 10% of all 8 of the nerve schwannomas found in centers specializing in temporal bone imaging. These lesions grow in more than 50% of the patients. They are most frequently found in the cochlea and are often located anteriorly in the cochlea in the area between the basal and second turn. The close relationship between the intracochlear nerve branches and the scala tympani anatomically, the preferential location of ILSs inside the scala tympani, and growth of the ILSs from the scala tympani into the scala vestibuli all support the hypothesis that cochlear ILSs most often originate in the scala tympani and only later, when the ILS grows, involve the scala vestibuli. ILSs can grow from the cochlea into the vestibule or vice versa and will use the anatomic connection between the perilymphatic spaces in the scala vestibule and anterior vestibule (saccule) to do so. The growth pattern of ILSs is now predictable, which makes it easier to recognize tumor growth.
Acknowledgments
We kindly thank Lut Timmerman for the artwork.
References
- Received October 20, 2007.
- Accepted after revision December 16, 2007.
- Copyright © American Society of Neuroradiology


