
Abstract
SUMMARY: Acute encephalopathy with biphasic seizures and late reduced diffusion (AESD) is a recently described clinicoradiologic syndrome. MR spectroscopy in 3 patients with AESD revealed decreased N-acetylaspartate (NAA) and elevated glutamine/glutamate complex (Glx) during the week of presentation. Afterward, Glx normalized, whereas NAA remained low in 2 patients with neurologic sequelae but nearly normalized in the third patient without neurologic sequelae. These findings support the hypothesis that excitotoxic neuronal damage plays an important role in the pathogenesis of AESD and suggest that MR spectroscopy might be predictive of outcome.
An acute encephalopathy syndrome characterized by biphasic seizures and late reduced diffusion (AESD) was recently reported in 17 Asian children. The syndrome is characterized by a prolonged (>30 minutes) febrile seizure as the initial neurologic symptom on day 1, followed by secondary seizures (most often in a cluster of complex partial seizures) at days 4–6; affected children display variable levels of neurologic sequelae.1,2 MR imaging shows no acute abnormality during the first 2 days; reduced diffusion appears in the frontal or frontoparietal subcortical white matter, with sparing of perirolandic region, during days 3–9, then disappears between days 9 and 25. Ultimately, patients develop cerebral atrophy. Other reports have described patients with closely related entities, such as acute encephalopathy with febrile convulsive status epilepticus (AEFCSE).3 Recently, a mild form of AESD with a brief initial febrile seizure (non-status epilepticus) and the absence of permanent neurologic sequelae has also been reported,2 suggesting that AESD has a wider spectrum than AEFCSE.
The exact pathogenesis of AESD is uncertain; excitotoxic injury with delayed (or apoptotic) neuronal death is hypothesized as a possible mechanism.3 Elevated glutamine (Gln)/glutamate (Glu) complex (Glx, at 2.1–2.5 and 3.8 ppm on MR spectroscopy) was reported in 1 patient with AESD.1 We performed MR spectroscopy in 3 additional patients with AESD to evaluate metabolites in vivo and to test the hypothesis that excitotoxicity is the mechanism of pathogenesis.
Case Reports
Patient 1
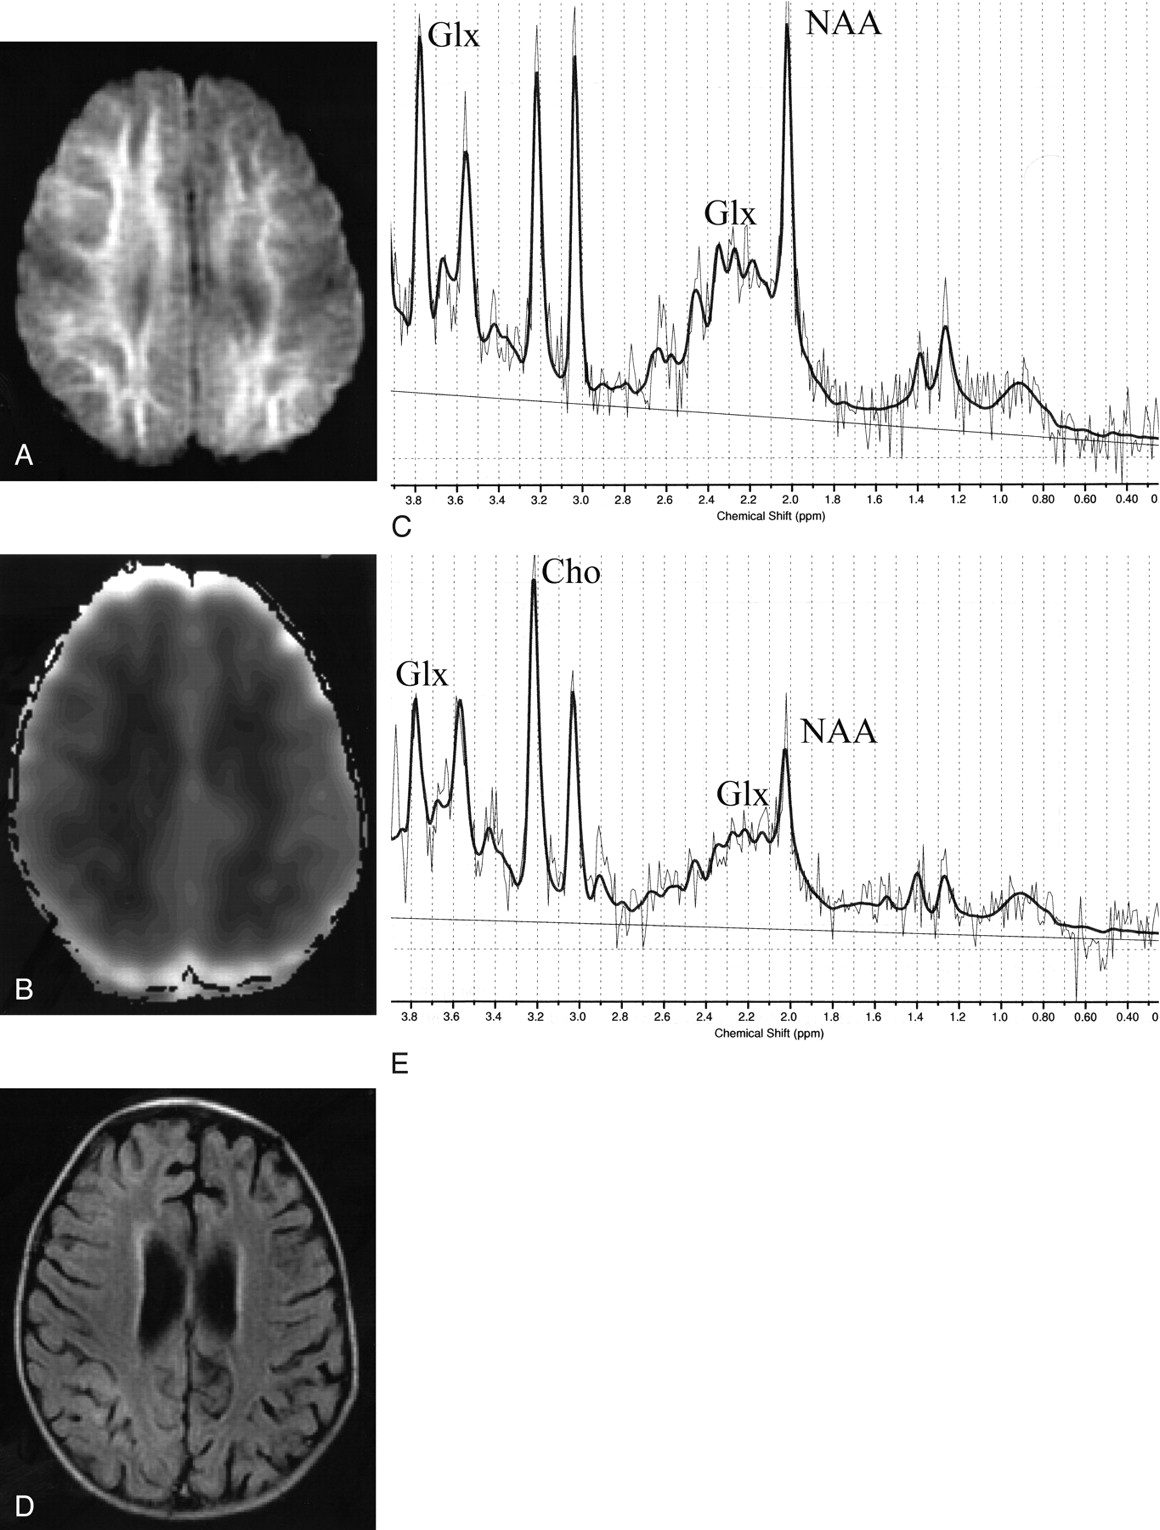
A previously healthy 2-year-old Japanese girl presented with a generalized tonic-clonic seizure, lasting an hour, following a 7-hour prodromal illness consisting of a high fever, cough, and rhinorrhea. Blood and CSF examinations findings were normal. Electroencephalography (EEG) showed diffuse high-voltage slow waves. A rapid antigen-detection assay from a nasopharyngeal swab revealed influenza A. She became comatose after cessation of the initial seizure. On day 5, she manifested a cluster of partial seizures, each lasting a few minutes. MR imaging on day 6 revealed reduced diffusion (Fig 1A, B) and T2 and T1 prolongation diffusely in the subcortical white matter with sparing of the perirolandic region; follow-up MR imaging on day 20 showed mild cortical T2 prolongation with mild cerebral atrophy (Fig 1D). On the basis of the clinical and radiologic features, a diagnosis of AESD associated with influenza A was made. Her clinical condition improved gradually, but severe mental retardation and epilepsy remained as neurologic sequelae.

MR imaging and proton MR spectroscopy of patient 1 on days 6 (A–C) and 20 (D, E). A. Axial diffusion-weighted image (SE-EPI: TE = 103, b = 1000) shows a high-signal-intensity lesion in the subcortical white matter, with sparing of the perirolandic region. B, Axial apparent diffusion coefficient map reveals extensive hypointensity, indicating reduced diffusivity, in the subcortical white matter. C, MR spectroscopy (point-resolved spectroscopy sequence [PRESS]: TR/TE/NEX, 5000/30/64; analyzed by LCModel) shows elevated Glx at 2.1–2.5 and 3.8 ppm of 9.2 mmol/L (6.4 ± 0.6 mmol/L) with decreased NAA at 2.0 ppm of 2.5 mmol/L (6.6 ± 0.4 mmol/L). D, Follow-up fluid-attenuated inversion recovery image (TR/TE/TI, 8000/140/2000) shows slight hyperintensity in the periventricular white matter and cerebral cortex with enlarged ventricles and subarachnoid spaces, indicative of mild cerebral atrophy. E, MR spectroscopy (PRESS: TR/TE/NEX, 5000/30/64) at follow-up shows normal Glx of 5.5 mmol/L, markedly decreased NAA of 1.7 mmol/L, and elevated Cho at 3.2 ppm of 1.5 mmol/L.
Proton MR spectroscopy were acquired from the frontal white matter on a 1.5T scanner (Signa EXCITE X1; GE Healthcare, Milwaukee, Wis) at 3 time points (6 [Fig 1C], 12, and 20 days [Fig 1E]). Point-resolved spectroscopy were obtained by using a TR of 5000 ms and a TE of 30 ms, with voxel size of 4.5 cm3. Quantification of metabolite concentrations was performed by using the LCModel as previously described.4 MR spectroscopic data were compared with those from 8 age matched patients (1–2 years of age), acquired between 2 and 5 days after prolonged febrile seizures alone (no encephalopathy or sequelae), and with those from 10 controls, 1–5 years of age (mean age, 2.8 years), who were studied to evaluate disorders such as psychomotor retardation or enlarged head circumference and had no MR imaging abnormality identified. Metabolite concentrations were considered abnormal if they differed from those of the controls by more than 2 SD. The protocol was approved by the institutional review board of our hospital. The concentrations of metabolites are shown in the Table.
MR spectroscopic data
Patient 2
A previously healthy 1-year-old Japanese girl presented with a generalized tonic-clonic seizure, lasting 45 minutes, following a 12-hour high fever. Rapid antigen-detection assay from a nasopharyngeal swab revealed influenza A. Blood and CSF examination findings were normal. EEG showed diffuse high-voltage slow waves. She became comatose after cessation of the initial seizure. On day 4, a cluster of partial seizures was noted. MR imaging on day 7 revealed reduced diffusion with T1 and T2 prolongation in the frontoparietal subcortical white matter; the perirolandic region was spared. Follow-up MR imaging on day 16 showed cortical T2 prolongation with cerebral atrophy. On the basis of the clinical and radiologic features, a diagnosis of AESD associated with influenza A was made. At follow-up, she was noted to have severe quadriplegia and mental retardation. Proton MR spectroscopy was performed at 2 time points (7 and 16 days), by using the same techniques as in patient 1, and the concentrations of metabolites are shown in the Table.
Patient 3
A previously healthy 1-year-old Japanese girl presented with a generalized tonic-clonic convulsion, lasting 5 minutes, following a 1-day prodromal illness consisting of a high fever and rhinorrhea. She was alert after the initial seizure. Her fever had disappeared by day 5, but she then developed a skin eruption, leading to a clinical diagnosis of exanthema subitum. On day 6, she developed 2 tonic convulsions, each lasting a few minutes. Blood and CSF and EEG findings were normal. MR imaging on day 6 revealed reduced diffusion in the frontal subcortical white matter (Fig 2A), which normalized on day 14 (Fig 2C). Positive immunoglobulin G and M of human herpesvirus-6 lead to the diagnosis of a mild form of AESD associated with this virus. Her clinical condition improved rapidly, with complete recovery. Proton MR spectroscopy was performed at 2 time points (6 and 14 days [Fig 2B, -D]), by using the same techniques as in patient 1, and the concentrations of metabolites are shown in the Table.

MR imaging and proton MR spectroscopy of patient 3 on days 6 (A, B) and 14 (C, D). A, Axial diffusion-weighted image shows high signal intensity, indicating reduced diffusivity, in the frontal subcortical white matter. B, Proton MR spectroscopy (point-resolved spectroscopy sequence [PRESS]: TR/TE/NEX, 5000/30/64) shows elevated Glx (8.6 mmol/L) with decreased NAA (4.2 mmol/L). C, Follow-up axial diffusion-weighted image shows normalization of diffusion abnormality. D, Follow-up proton MR spectroscopy (PRESS: TR/TE/NEX, 5000/30/64) shows normal Glx of 7.4 mmol/L and near normalization of NAA (5.6 mmol/L).
Discussion
Glx was elevated in the subacute stage during the first week and normalized afterward in all 3 patients. NAA was decreased in the 3 patients by the end of the first week. In the follow-up study, NAA remained low in patients 1 and 2 with typical AESD but nearly normalized in the patient 3 with mild AESD. The 2 patients with typical AESD had elevated choline (Cho) on the follow-up study. Creatine levels were within the normal range in all 3 patients. Metabolite concentrations in the 8 patients with prolonged febrile seizures (but no encephalopathy) were not different from those in the controls.
The most significant finding of this study is that Glx increased in subacute stage of AESD. The fact that normal Glx concentrations were found in patients with prolonged febrile seizures but that elevated Glx was seen in all patients with AESD, even the one who had a brief febrile seizure, suggests that the increase in Glx does not result from prolonged seizures per se; other factors must be involved. Most excitatory neurons in the human cerebral cortex release Glu, an excitatory neurotransmitter that is taken up from the synaptic cleft by surrounding astrocytes and is metabolized into a relatively harmless compound, Gln. If Glu is released in quantities that cannot be processed by astrocytes or if the astrocytes are not functioning properly, the excessive Glu binding to N-methyl- D-aspartate (NMDA) receptors allows entry of calcium into the postsynaptic neuron, causing necrotic cell death or apoptosis; this condition is referred to as excitotoxicity.5 Elevated Glx during the first week suggests that excitotoxic neuronal damage is likely to play an important role in the pathogenesis of AESD, though separation of Glu from Gln is impossible by MR spectroscopy at 1.5T. Neuronal apoptosis in AESD is also suggested by the serial change in CSF cytochrome c level, which increases in the subacute period.6,7
Cytokine profiles of CSF may also support the hypothesis of an excitotoxic pathogenesis of AESD. CSF cytokine analysis in AESD showed elevated interleukin (IL)-6 without elevated IL-10 (an anti-inflammatory cytokine) or soluble tumor necrosis factor (TNF) receptor 1 (sTNFR1, reflecting the true biologic activity of inflammatory cytokine, TNF-α).8 This profile is distinct from that of a cytokine storm, seen in inflammation and showing elevated IL-6, IL-10, and sTNFR1.3,8 IL-6 protects neurons from Glu-induced excitotoxic damage9 and, in ischemia, exerts neuroprotective effects on NMDA-receptor-mediated excitotoxicity in the brain.10 Therefore, IL-6 may be elevated in AESD to protect against Glu-induced excitotoxic damage. Apparently, it is not elevated enough to protect the brain completely, because considerable damage often ensues in AESD. It will be interesting to study further Glu and Gln levels with MR spectroscopy (preferably with a higher field strength magnet that allows separation of the 2 peaks) and CSF cytokine levels in patients with AESD and encephalopathies caused by a cytokine storm (such as acute necrotizing encephalopathy and Reye-like syndromes).3
Under excitotoxic conditions, astrocytes are thought to be neuroprotective due to their ability to clear and metabolize extracellular Glu.11 Excessive Glu uptake induces an increase in astrocytic cell volume with a resulting decrease in the size of the extracellular space in primary cultures from the cerebral cortex of neonate rats.12 Glu-induced astrocytic swelling and edema may play a part in the reduced diffusion seen in the subcortical white matter of affected patients.1,2 Normalization of the Glx concentration on MR spectroscopy after 8 days, if associated with reversal of Glu-induced astrocytic swelling and edema, may explain the transient nature of the reduced diffusion in AESD.
Another possible mechanism by which Glx may increase in patients with AESD might be the direct result of secondary seizures. In this scenario, one might suppose that Glx may increase as a result of the secondary seizures that were seen on days 4–6 (the MR spectroscopy was performed after the secondary seizures). However, this hypothesis seems unlikely because in a previously reported patient with AESD, MR spectroscopy showed increased Glx on day 3 before the onset of the secondary seizures.1
The persistently decreased NAA observed in our 2 patients with typical AESD (patients 1 and 2) suggests permanent neuronal damage, which is likely related to the neurologic sequelae and the cerebral atrophy observed on follow-up MR imaging. In contrast, a much smaller decrease in NAA improved to a nearly normal level in the patient with mild AESD and was accompanied by clinical recovery and no persistent abnormality on MR imaging. Thus, we tentatively suggest that the concentration of NAA on the follow-up MR spectroscopy may help to predict clinical outcome in AESD, though, clearly, further proton MR spectroscopy studies of patients with AESD will be necessary to determine this connection.
The Cho peak on MR spectroscopy largely reflects the amount of membrane turnover; therefore, Cho rises in the process of increased membrane breakdown. Elevated Cho has been used as a marker for demyelination in patients with white matter lesions on MR imaging.4 Elevated Cho in patients with AESD may also reflect myelin or cell membrane disruption, because either could lead to T2 prolongation in the subcortical white matter reported on follow-up MR imaging in AESD.1 The normal Cho on day 14 in the patient with mild AESD most likely reflected minimal damage to myelin with no permanent damage to underlying neurons, as reflected in normalization of NAA and the favorable outcome.
Conclusion
MR spectroscopic findings in patients with AESD support the hypothesis that excitotoxic neuronal damage plays an important role in the pathogenesis of AESD. It is suggested that MR spectroscopy might be predictive of neurologic outcome.
Footnotes
This work was supported in part by the Research Grant (20A-14) for Nervous and Mental Disorders from the Ministry of Health, Labor and Welfare of Japan, and by the Japan Epilepsy Research Foundation.
References
- Received April 11, 2008.
- Accepted after revision June 10, 2008.
- Copyright © American Society of Neuroradiology
In this issue


Jump to section
Related Articles
Cited By...
- ALERD: acute leukoencephalopathy with restricted diffusion--a newly emerging diagnosis
- Unusual presentation of acute encephalopathy with biphasic seizures and late reduced diffusion in Miller-Dieker syndrome
- Familial striatal degeneration: New mutation and neuroimaging clues
- ADORA2A polymorphism predisposes children to encephalopathy with febrile status epilepticus
- Differences of Clinical Manifestations According to the Patterns of Brain Lesions in Acute Encephalopathy with Reduced Diffusion in the Bilateral Hemispheres