
We read with great interest the article by Boukobza et al1 reporting the usefulness of the T2 gradient-echo (T2*) sequence in making the diagnosis of isolated cortical vein thrombosis. In substance, the authors claim that magnetic susceptibility effect (MSE) is always visible, regardless of the age of the thrombi in the veins. Therefore, after reading this article, one can understand that cerebral vein thrombosis always appears with abnormal low signal intensity on T2* sequences. Although there is no doubt in our minds that T2* sequences and MSE are fundamental at the early stage of cerebral vein thrombosis, they seem less useful during the subacute stage. In fact, in agreement with the authors' Fig 5 follow-up, this sign appears at least tricky and can be misinterpreted. The legends and arrows in Fig 5 can even be controversial because the authors described the thrombosed vein at the surface of the cortex as hypointense on T2*. On the contrary, one can see this cord sign as hyperintense on all sequences, including the T2* image. Indeed, T1-, T2-, and T2* images demonstrate identical findings: a thrombosed vein with central high signal intensity (partially veiled by the tip of the arrow on T2*) separated from the cortical surface by a thin hypointense line without evident MSE (indicated by the arrow on the T2* image but visible as well on the T1- and T2-weighted images).
However, signal-intensity heterogeneity and dark contour are frequently observed on normal venous structures on T2* images2 and can even be seen in the normal superior sagittal sinus of the authors' Fig 5 follow-up. Therefore, for daily practice and didactic purposes, we would have recommended that the authors warn radiologists not to rely on this T2* hypointensity at the subacute stage, and they should inform radiologists that due to extracellular methemoglobin,2,3 venous thrombosis becomes obviously hyperintense on all sequences, including T2* images.2 This is of major importance because although this hyperintense subacute thrombosis is easily diagnosed by a bright signal intensity on T1- and T2-weighted spin-echo sequences, it can be missed on the T2* sequence because it may mimic normal circulating veins, which may appear with such a signal intensity on this sequence.
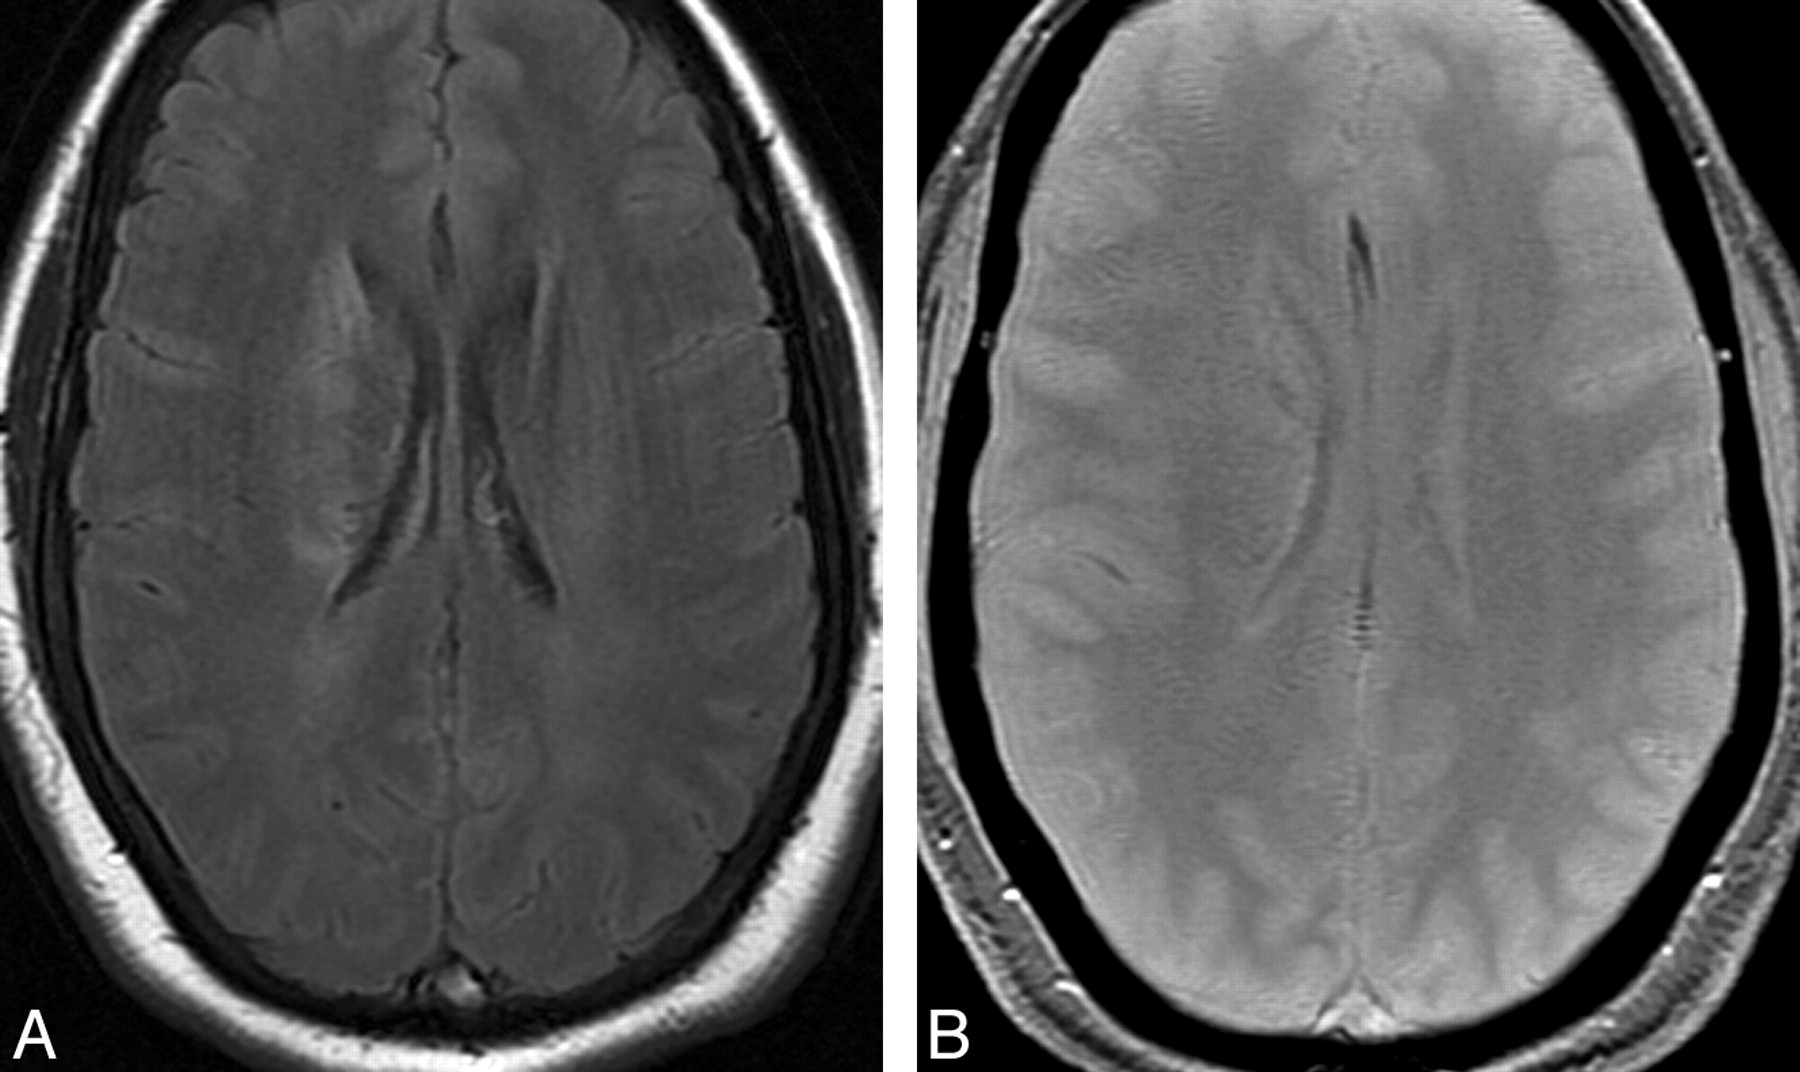
For reinforcement, we illustrate here the case of a 34-year-old woman with headache and demonstrative evolution of MR signal intensities of cerebral venous thrombosis. Initial MR imaging performed 2 days after neurologic symptom onset revealed thrombosed superior sagittal sinus and cortical veins diagnosed only by means of MSE on the T2* image (Fig 1). Follow-up MR imaging performed exactly 7 days after the first examination (Fig 2) demonstrates how the T2* sequence becomes almost useless compared with spin-echo sequences that demonstrate abnormal high signal intensities within the thrombosed venous structures.
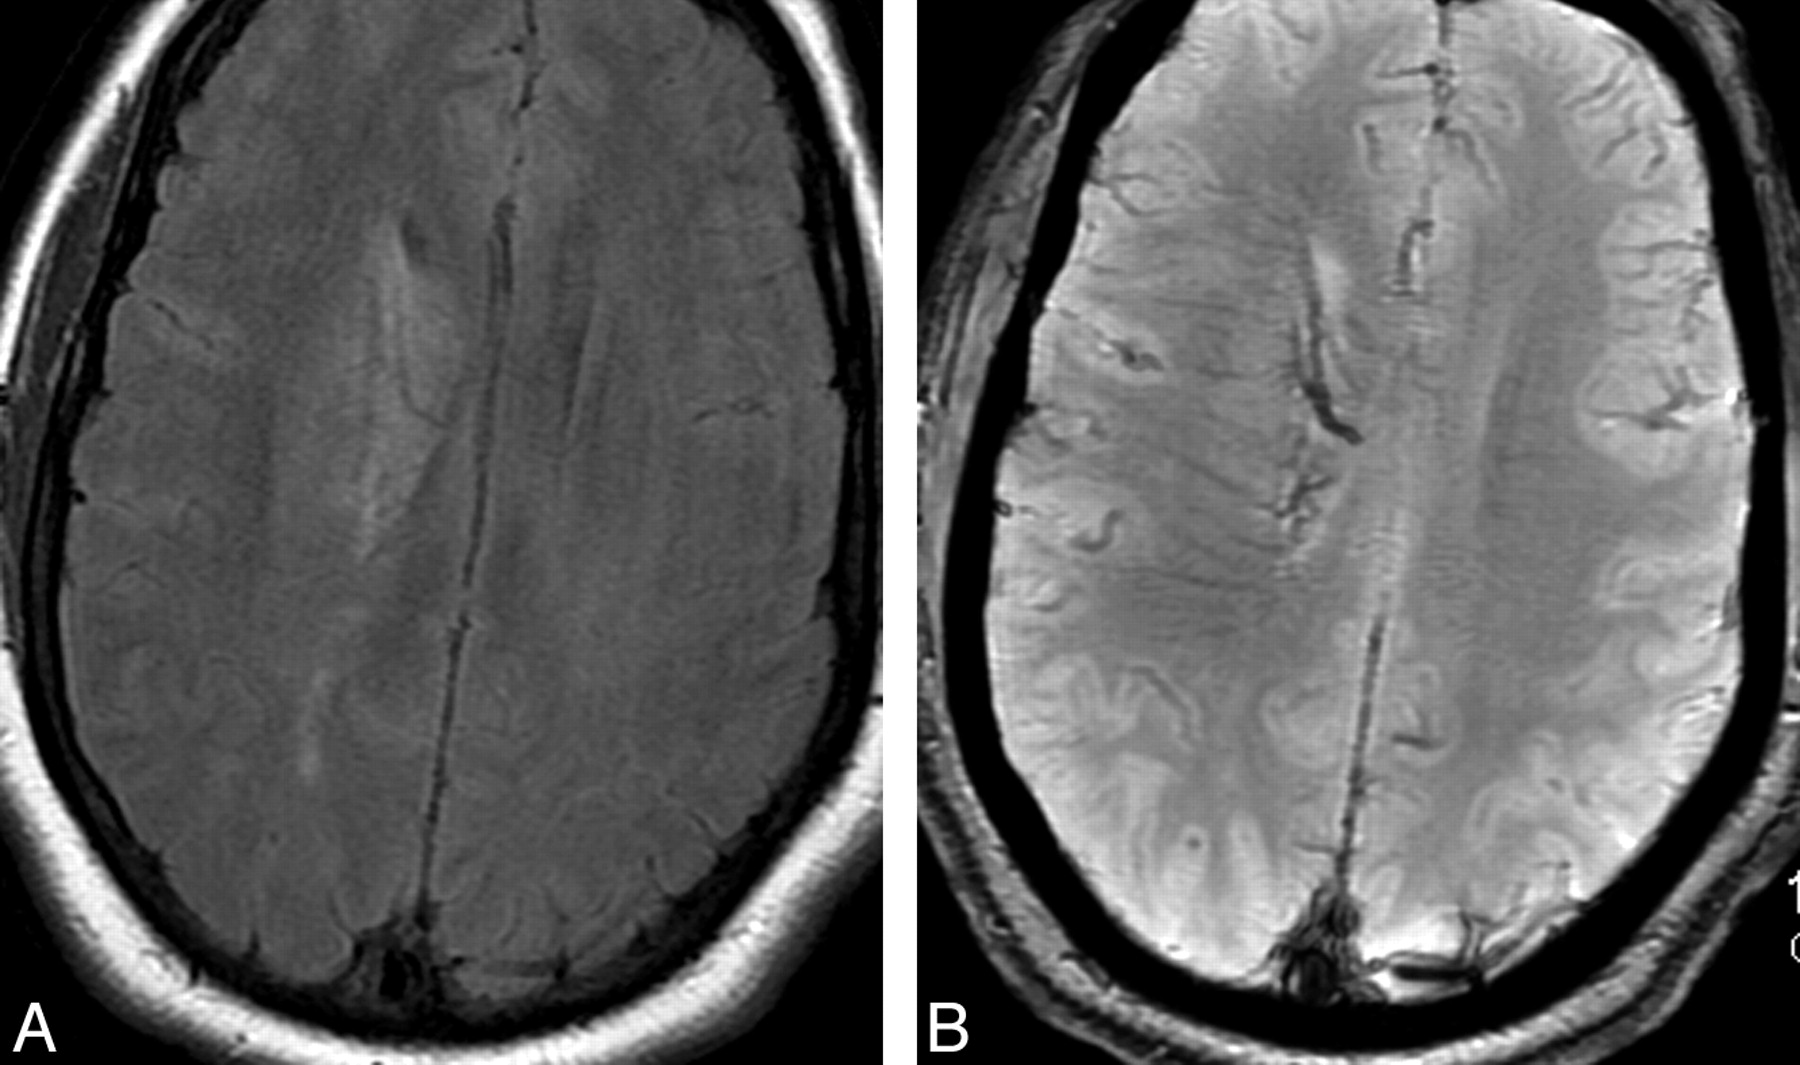
Acute thrombosis of the superior sagittal sinus and cortical veins in a 34-year-old woman with 2 days of lasting headaches and left hemiparesis. A, Axial fluid-attenuated inversion recovery (FLAIR) image. B, Axial T2* image. The thrombosis maybe missed on spin-echo sequences because it appears with T1 isointensity (not shown) and T2 FLAIR hypointensity, signal intensities close to normal circulating venous structures. On the other hand, the T2* image obviously demonstrates abnormal magnetic susceptibility effect (MSE) in the thrombosed venous structures and in the right transcerebral veins.

Follow-up MR image obtained after 7 days of heparin administration. A and B, Axial FLAIR (A) and axial T2* image (B) at the same level as in Fig 1. The superior sagittal sinus, which is still thrombosed, now appears with T1- (not shown), T2-, and T2* signal-intensity hyperintensities and lacks MSE. Note the right caudate lesion, appearing with T2 hyperintensity as initially observed on Fig 1.
References
- Copyright © American Society of Neuroradiology
In this issue


Jump to section
Related Articles
Cited By...
- No citing articles found.