
Abstract
BACKGROUND AND PURPOSE: Voxel-based morphometry (VBM) has proved a powerful method to detect subtle changes of gray matter (GM) at the group level but the role of VBM for the detection of GM changes in single subjects, especially in those with suspected neurodegenerative disorder, remains uncertain. Here, we performed single subject analyses in 22 patients in early stages of Huntington disease (HD), a neurodegenerative disorder with a well-known and characteristic pattern of GM loss.
MATERIALS AND METHODS: We applied an ANCOVA with age and gender as covariates and corrected for multiple statistical tests by false discovery rate (P < 0.05). Each patient was compared to 133 healthy controls. The same procedure was applied to 22 of the controls matched for age and gender in a pair-wise manner.
RESULTS: Our analyses yielded biologically plausible results in HD patients in which GM decrease within the caudate nucleus could be identified in 15 of the 16 most affected patients while GM decrease was found in only 1 control subject. Lowering the size of the control group yielded comparable results with 99 and 66 control subjects whereas sensitivity decreased with 33 control subjects.
CONCLUSIONS: Our pilot study demonstrates a potential role of VBM for the detection of cerebral GM changes in single subjects with suspected neurodegenerative disorder.
For the analysis of brain images from single patients with suspected neurodegenerative disorder, visual inspection is the method of choice. Inspection often causes the vague impression of a “borderline finding” that cannot be interpreted further because no statistical measures of the “suspicious region” are at hand. Addressing this problem, we aimed to obtain biologically plausible statistical parametric maps from single patients in early stages of a well-characterized neurodegenerative disorder.
For our project, we chose voxel-based morphometry (VBM) because this method had proved sensitive to detect subtle gray matter (GM) changes in numerous group studies on neuropsychiatric disorders, whereas only few attempts had been undertaken to detect GM changes in single subjects. These studies mainly focused on the automated detection of focal GM changes that can cause epilepsy1-9 and demonstrated different degrees of sensitivity. One further study used VBM for the detection of lesions.10 Here, different VBM approaches were compared with “expert tracing” (of lesions). The “optimized approach” with unmodulated data11 detected 8 of 10 lesions but delineated only 21% of the lesion volume, which was attributed to “the adverse influence of lesions on the preprocessing steps and to insufficient statistical power.” Indeed, the control group consisted of only 19 subjects, though in an early description of VBM,12 it had already been stated that, “even with many hundreds of subjects in a data base of controls, the method may not be powerful enough to detect subtle abnormalities in individuals.” Another VBM study on autism successfully applied analyses at the single-subject level.13 Nevertheless, we are aware of only 1 VBM study that investigated single subjects with a neurodegenerative disease. Mummery et al14 studied 6 patients with semantic dementia by comparing each of them with 14 healthy control subjects and demonstrated GM decrease mainly in the left temporal pole.
To further investigate the potential role of VBM for single-subject analyses of GM decrease in early stages of neurodegenerative disorders, we tested different parametric approaches and used a relatively large control group. We chose patients with Huntington disease (HD) because this neurodegenerative, autosomal-dominant disorder results from an expanded CAG trinucleotide repeat within the IT15 gene located on chromosome 415 so that it can certainly be diagnosed without MR imaging. HD usually presents with the clinical triad of involuntary movements, dementia, and behavioral disturbances. In HD, GM loss is most accentuated within the striatum and insular cortex, which has been demonstrated repeatedly so that the results derived from our analyses can be discussed with regard to biologic plausibility.16-29
Materials and Methods
Patients
Data and images were derived from routine diagnostics of our HD outpatient clinic. The group consisted of 22 gene-positive subjects in early stages of HD (women, 12; CAG repeats: range, 40–48; mean ± SD, 45 ± 2; age range, 35–61 years; mean ± SD, 44 ± 8 years). The motor score of the Unified Huntington's Disease Rating Scale ranged from 0 (no motor symptoms in 3 patients) to 43 (considerable motor symptoms) with a mean value of 17 and an SD of 15.
Control Group
Images were derived from volunteers who had participated in imaging studies as healthy control subjects at our department. In these studies, subjects were interviewed before scanning by an experienced neurologist and were only included if there was no indication for any neurologic or psychiatric disorder. Moreover, all images were screened by an experienced neuroradiologist and were excluded if there were unusual or abnormal findings. We could recruit the images of 133 subjects (women, 62; age range, 27–74 years; mean ± SD, 55 ± 12 years).
Matched Control Subjects
Of the 133 control subjects, we chose 22 matched control subjects (ie, 1 matched control subject per patient). For each patient, the control of the same sex with the age closest to the respective patient was chosen (age differences: <1 year, 13 pairs; 1–2 years, 6 pairs; 2–3 years, 2 pairs; 5 years, 1 pair).
MR Imaging Acquisition
Each subject underwent MR imaging in the same scanner (magnetic field intensity, 1.5T; scanner, Magnetom Symphony [Siemens, Erlangen, Germany]; sequence, T1 magnetization-prepared rapid acquisition of gradient echo; TR, 11.1 ms; TE, 4.3 ms; TI, 800 ms; voxel size, 1 × 1 × 1 mm3; flip angle, 15°; sagittal sections, 160; FOV, 256 × 256 mm).
Which Statistical Test Should Be Used?
We made no effort to apply nonparametric tests because, here, ranks are considered exclusively. The comparison of a single patient to a group of 133 control subjects can, at best, yield rank 134 for the patient corresponding to an uncorrected P value of 0.0075 (1/134), so that it seems very unlikely to provide results that remain significant after correction for multiple statistical tests as required for hypothesis-free whole-brain analyses. Instead, we tested 2 parametric approaches.30 For both approaches, we assumed a t distribution of the data of the control group. With respect to the variance of the test “group” (containing only 1 subject), we tested 2 approaches:
The first approach is based on the assumption that the patient's value constitutes the mean value of a (hypothetical) population with a variance equal to that of the control group. This approach is implemented by default in most programs for the analyses of neuroimaging data such as statistical parametric mapping and has been the method of choice so far, though, to the best of our knowledge, this issue has never been discussed explicitly. This “conventional approach” corresponds to the 2-sample t test with the “pooled” estimate of variance and results in the following equation for the T value:  1) with
Here the common variance is calculated by weighting each group variance by the number of observations in that group, thus, giving more weight to larger groups (because they are better estimates). Given Np is one, equation 1 reduces to  2)
2)
The “alternative approach” does not assume any variance from the patient. Instead, the patient is regarded as a unique single case and, hence, is treated as a fixed effect. This complies with the 1-sample t test where a test value ρ (eg, from a patient) is compared with the values of a sample of N controls with the mean value μ and the SD σ. The T value is estimated as follows:  3)
3)
Note that the 2-sample t test for unequal variances (Welch t test) does not apply because the degrees of freedom cannot be estimated.
It is obvious that the 2-sample t test (with a “pooled” estimate) of the conventional approach (equation 2) yields lower T values than the 1-sample t test of the alternative approach (equation 3) and is hence more conservative. It is noteworthy that this more conservative approach has also been suggested recently for the neuropsychologic assessment of single patients.31 However, both approaches are based on different statistical assumptions so that neither of them can primarily be regarded correct or incorrect. Accounting for the problem of statistical assumptions when comparing a single subject with a group, it has been proposed to empirically validate the statistical approach by comparing each healthy subject to the remainder and by relating these findings to the type 1 error probability.32 Applying a significance threshold of P less than .05 corrected, we expect to (erroneously) detect GM decrease in 5% of the healthy control subjects, that is in approximately 1 of the 22 matched control subjects analyzed in our study. More precisely, the number of matched control subjects with GM decrease identified should range from 0 to 3 (χ2 test: P > .05).
Following the proposal of an empiric validation, we could clearly falsify the alternative approach on the basis of the 1-sample t test because it yielded GM decrease in every control subject. Therefore, we concentrated on the conventional approach on the basis of the 2-sample t test (with a “pooled” estimate of variance).
Accounting for Age and Sex
Before our study, we had made extensive attempts to generate statistical parametric maps of single subjects with various neuropsychiatric diseases compared with populations other than the one analyzed in this study. It is intriguing that when increasing the number of control subjects, we saw more significant and more plausible results at first. However, when including additional control subjects of ages more different from the subject under investigation, significance decreased. It is notable that significance increased again after accounting for age and sex. This is well conceivable because age and sex considerably influence regional and global GM values in healthy subjects.11,33,34 Therefore, we accounted for age and sex by including these parameters in our model and extended the 2-sample t test to an analysis of covariance (ANCOVA).
Preprocessing and Distributional Assumptions
For normalization and segmentation, default settings of VBM5 (http://dbm.neuro.uni-jena.de/), an extension of SPM5 (http://www.fil.ion.ucl.ac.uk/spm/software/spm5/), were applied. Apart from the unified segmentation as implemented in SPM5,35 VBM5 applies a hidden Markov random field model. 36 This segmentation procedure minimizes the noise level by removing isolated voxels of 1 tissue class, which are unlikely to be a member of this tissue class. For smoothing, we used a Gaussian kernel of 12-mm full width at half maximum, which is necessary to fulfill the distributional assumptions of VBM, especially for the analysis of single subjects.37
Voxels Included in the Analyses (“Explicit Masking”)
We analyzed only voxels that were likely to represent GM according to the probability maps of SPM5 (“priors”) for GM, white matter (WM), and CSF that have been derived from a large cohort of healthy control subjects. Therefore, a voxel was only included if it displayed a GM value greater than both the corresponding WM and CSF values. Accounting for the existence of another class apart from the 3 tissue classes, the background class, we also applied an absolute voxel threshold of a GM value greater than 0.2 (range, 0–1).
Correction for Multiple Statistical Tests
To correct for multiple statistical tests, we applied the false discovery rate (FDR) predicated on the procedure of Benjamini and Hochberg.38,39 We set a whole brain significance level of P less than .05.
No Systematic Shifts of MR Imaging Parameters with Time
All subjects underwent MR imaging examinations from September 2000 to September 2003 and were almost evenly distributed during the scanning period. In most VBM studies, the dates of MR imaging scans have assumingly also overlapped between the groups under investigation, though this is rarely stated explicitly. To certainly exclude that the statistical parametric maps of single subjects result from shifts of MR imaging parameters with time, we performed multiple regression analyses with the smoothed GM images. Here, the date of MR imaging and the age and sex of the subjects served as covariates. This analysis yielded age-related GM loss and sex-related differences in GM as described previously40 but did not yield significant results with respect to the date of MR imaging scanning. This finding indicates that statistical parametric maps of single subjects reported in our study did not result from systematic shifts of MR imaging parameters with time, but we cannot certainly exclude an influence of unsystematic changes (ie, instability) of MR imaging parameters.
How Many Control Subjects Are Necessary?
Finally, we tried to estimate the effect of smaller control groups. To this end, we repeated all analyses with control groups of 33, 66, and 99 subjects. All groups were matched for age and sex so that mean and SD did not differ significantly from the control group of 133 subjects. To estimate sensitivity, we determined the size of the largest cluster overlapping with the striatum for each single-patient analysis. For comparison of the cluster sizes derived from different numbers of control subjects, the volumes were assigned to 4 classes (0, 1–99, 1000–9999, >9999 voxels) and plotted against the percentage of patients.
Results
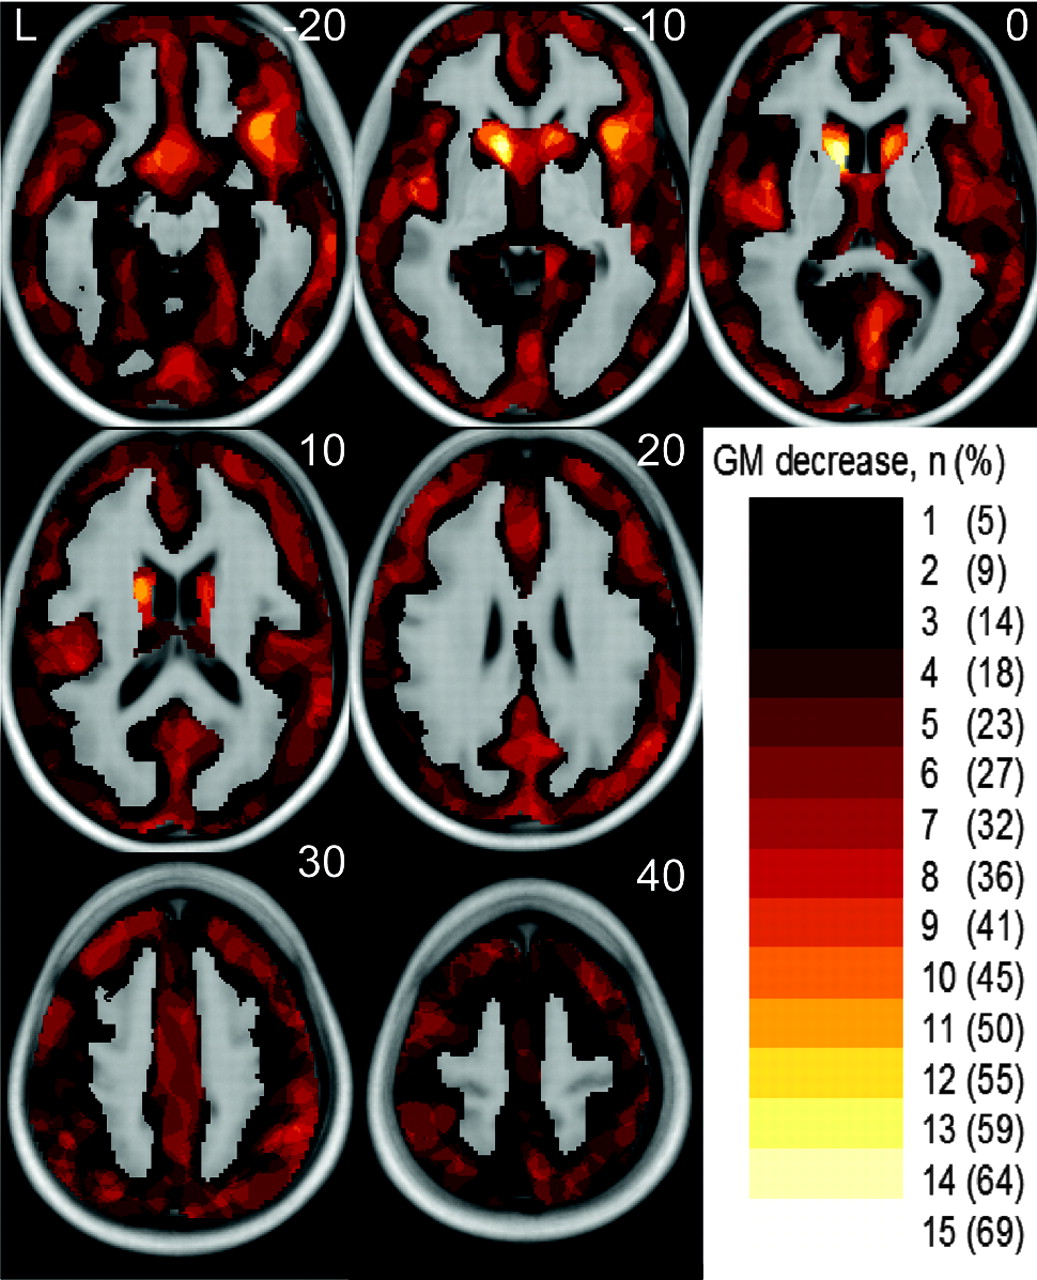
Statistical parametric maps on the basis of an ANCOVA model yielded sensitive and biologically plausible results. An overview on the percentage of patients with regional GM decrease identified (at the single-subject level) is given in Fig 1. Examples of single-subject analyses of 4 patients are shown in Fig 2. Ordering the patients with HD according to the motor symptoms from highest to lowest severity, regional GM decrease within the head of the caudate nucleus was identified in patients 1 through 6 and patients 8 through 16. Moreover, more widespread GM decrease that largely comprised the insula was identified in patients 1 through 5 (Fig 2, Panels A and B). It is interesting that the incidental finding of an atrophic right temporal pole in combination with an arachnoidal cyst in patient 6 was clearly detected (Fig 2, Panel C). In the matched control subjects, GM decrease was found in only 1 subject (Fig 3).

Overview on the percentage of patients with HD with regional GM decrease identified. The color bar in the right lower corner indicates the number (percentage) of patients where regional GM decrease could be identified by single-subject analyses. The number (percentage) is projected onto the normalized averaged T1-image. The numbers in the upper right corner indicate the MNI coordinates.
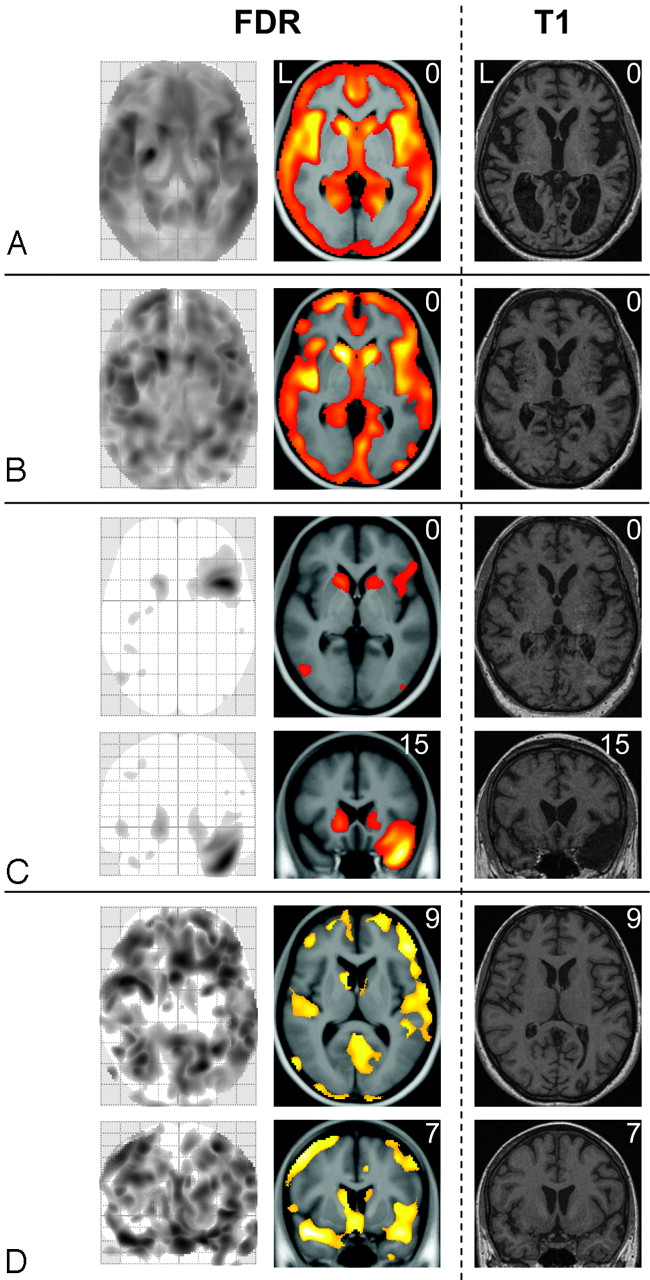
Results derived from ANCOVAs in 4 patients with HD. GM decrease of 4 patients with HD (1 patient per panel) is displayed by the maximum intensity projection (left side), by the projection onto the normalized averaged T1-image (middle) and, to enable visual inspection, by the individual T1-weighted image (right side). The numbers in the upper right corner indicate the MNI coordinates. All images are displayed with a significance threshold (voxel level) of P less than .05 corrected (FDR). In panel A, axial sections of HD patient 5 (motor score of the Unified Huntington's Disease Scale, 34; CAG repeats, 43; age, 48; sex, female) are shown. In this patient, global atrophy can be detected by visual inspection (right side). In panel B, axial sections of HD patient 3 (motor score of the Unified Huntington's Disease Scale, 37; CAG repeats, 48; age, 60; sex, female) are shown; here, visual inspection fails to detect GM decrease. In panel C, axial and coronal sections of HD patient 6 (motor score of the Unified Huntington's Disease Scale, 33; CAG repeats, 43; age, 51; sex, male) are shown; note that, besides decent GM loss nearly restricted to the striatum, the atrophy of the left temporal pole (in combination with an arachnoidal cyst) is also identified. In panel D, axial and coronal sections of HD patient 13 (motor score of the Unified Huntington's Disease Scale, 9; CAG repeats, 45; age, 36; sex, female) are displayed; here, cortical and striatal GM loss is of a similar degree.

Gray-matter decrease identified in only 1 healthy control subject. Axial and coronal sections of the only matched control subject with GM decrease identified (matched control subject 4: age, 50; sex, male) are displayed by the maximum intensity projection (column A), by the projection onto the normalized averaged T1-image (B1 and C1), and, to enable visual inspection, by the individual T1-weighted image (B2 and C2). The numbers in the upper right corner indicate the MNI coordinates. All images are displayed at a significance threshold (voxel level) of P less than .05 corrected (FDR).
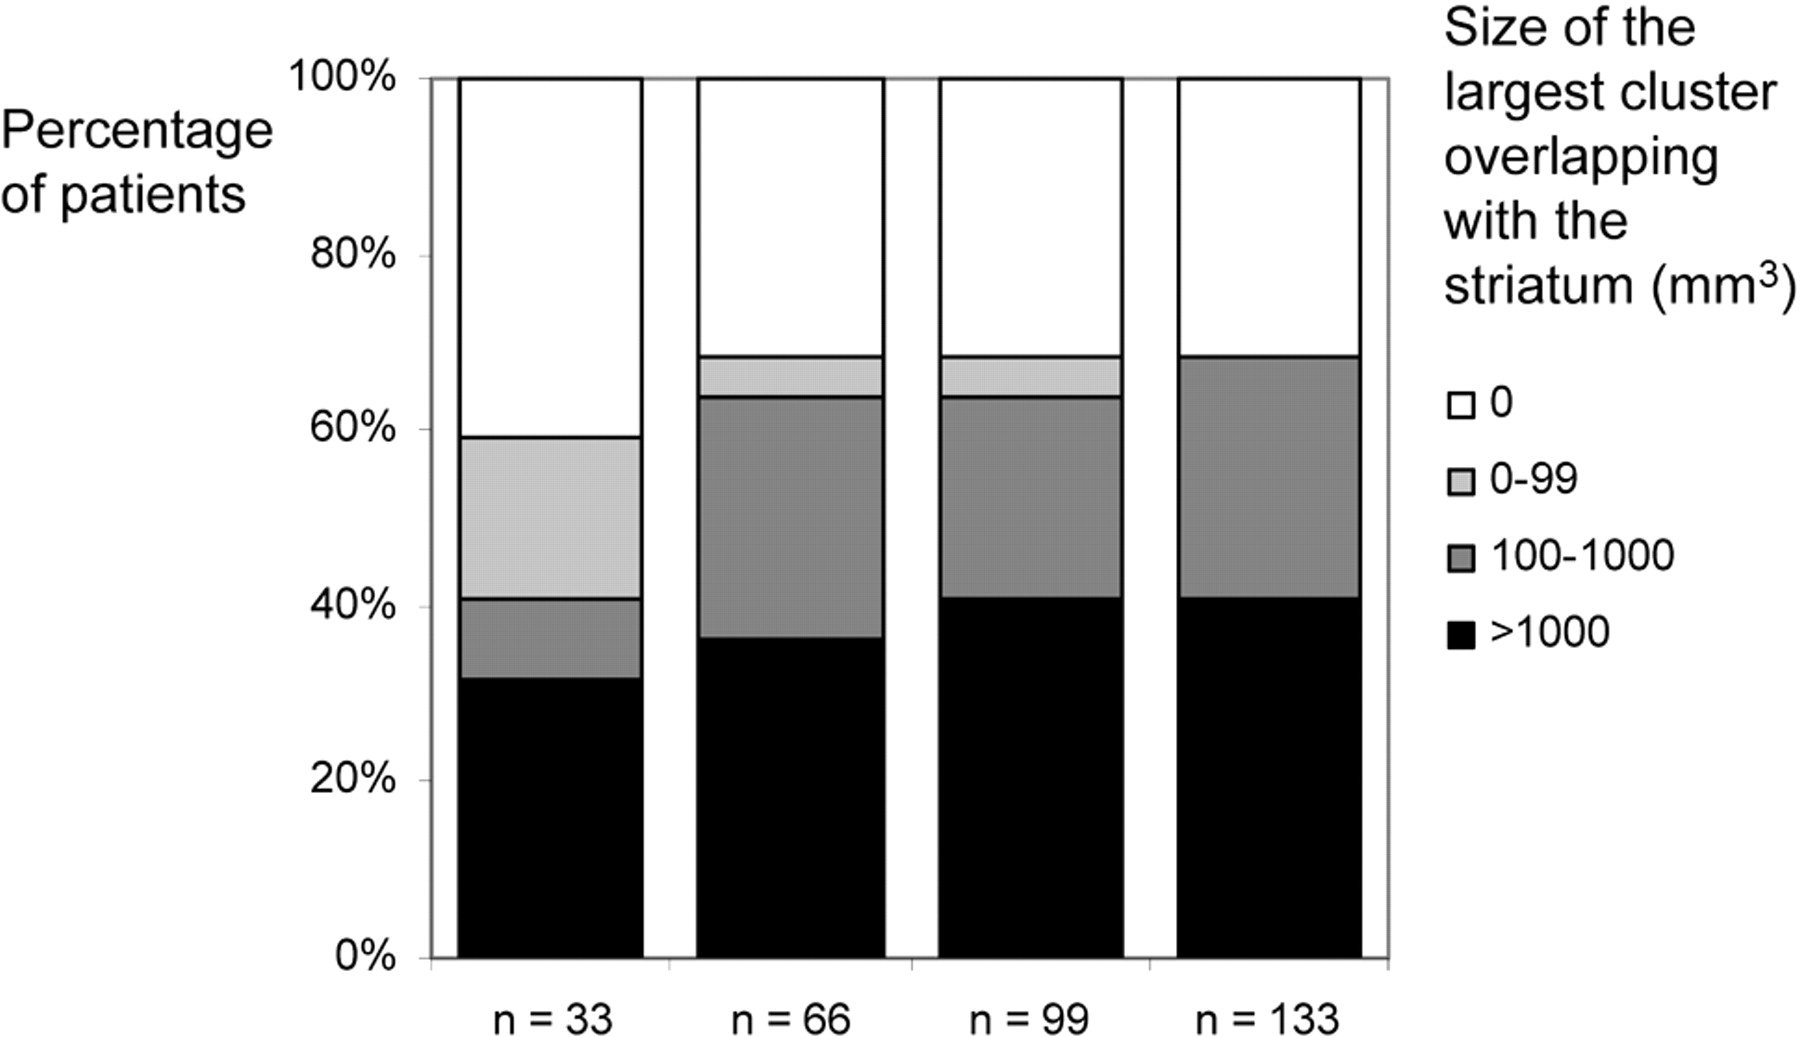
Figure 4 shows the results of the single-patient analyses with smaller control groups. Basically, the same results were obtained with control groups of 66, 99, and 133 subjects. With a control group of 33 subjects, fewer patients and smaller clusters were identified.

Influence of the size of the control group. Histograms illustrate the influence of different sizes of the control group (33, 66, 99, and 133) on sensitivity and cluster size. All groups were matched for age and sex so that mean and SD did not differ significantly. As a measure of sensitivity, we determined the size of the largest cluster overlapping with the striatum. These volumes were assigned to 4 classes: 0, 1 to 99, 1000 to 9999, and more than 9999 voxels. Basically, the same results are obtained with control groups of 66, 99, and 133 subjects. With a control group of 33, fewer patients are identified, though a considerable proportion of patients is still detected.
Discussion
This study aimed to deliver biologically plausible statistical parametric maps of single subjects in early stages of a neurodegenerative disorder by the use of VBM. An ANCOVA model with a pooled estimate of variance revealed GM decrease accentuated in the head of the caudate nucleus in most of the patients with HD, whereas GM decrease of the cortical areas varied from patient to patient (Fig 1), which both fit well with the known pattern of GM decrease in HD. Furthermore, the analysis revealed GM decrease in only 1 of the 22 matched control subjects as expected from the probability of type I error. Although atrophy can be detected by visual inspection in patient 5 (Fig 2, Panel A) and may be assumed in more patients, the sensitivity of the single-subject analysis was clearly superior to visual inspection.
Because a scanner-specific control group of 133 subjects is difficult to obtain, we tried to estimate the effect of smaller control groups. To this end, we repeated all analyses with control groups of 33, 66, and 99 subjects and found that control groups of 66, 99, and 133 subjects resulted in a comparable sensitivity. On the other hand, a considerable proportion of patients could still be detected with only 33 subjects but with a lower sensitivity (Fig 4).
Against this background, VBM in single subjects with suspected neurodegenerative disorder may serve as a diagnostic tool. Moreover, hypotheses with regard to subgroups of certain conditions may be derived from those analyses. Assuming, for example, that one half of a group displays GM change whereas the other half does not, the comparison of the whole group with a control group is likely to miss this GM change. Single-subject analyses of the whole group may reveal such a subgroup so that a new hypothesis can be generated, which, then, can be confirmed in another sample of subjects.
Nevertheless, analysis of VBM data from single subjects, as it stands, has both current and intrinsic limitations. Although this approach potentially enables a hypothesis-free whole-brain analysis of single subjects, the capability of this approach has currently been demonstrated in only 2 neurodegenerative disorders, namely semantic dementia14 and HD. In subjects with other conditions, however, variability of regional GM may largely overlap with the variability in healthy control subjects and, therefore, hamper detection of GM changes at the single-subject level. Therefore, studies on single subjects with other conditions are necessary to further evaluate the sensitivity of VBM in single subjects with suspected neurodegenerative disorders. Moreover, intrinsic limitations result from the fact that VBM at the single-subject level (as proposed here) is univariate in nature. GM images of single subjects are analyzed exclusively with regard to the normal range (estimated from a sample of healthy control subjects) in a voxel-wise manner so that more specific conclusions cannot be drawn from those data alone. On the other hand, multivariate techniques potentially enable specific conclusions on the nature of GM decrease in single subjects, but these techniques require a clear hypothesis on the condition of the single subject under investigation and the respective group data (derived from a sample of patients compared with a sample of healthy control subjects). Insofar, VBM at the single-subject level may serve as a screening tool. Dependent on the condition assumed and on the group data available, consecutive multivariate tools may then be applied to gain more specific information.
In conclusion, our data demonstrate biologically plausible statistical parametric maps of regional GM decrease at the single-subject level in early HD. Studies of other neurodegenerative disorders are needed to further assess the potential of VBM in single subjects with suspected neurodegenerative disorder.
Acknowledgments
We thank Helga Gräfin von Einsiedel and her colleagues from the Institut für Röntgendiagnostik (Klinikum rechts der Isar, Technische Universität München) for having made this study possible.
References
- Received August 4, 2008.
- Accepted after revision September 29, 2008.
- Copyright © American Society of Neuroradiology
In this issue


Jump to section
Related Articles
Cited By...
- Hyper-adaptation in the Human Brain: Functional and structural changes in the foot section of the primary motor cortex in a top wheelchair racing Paralympian
- Descriptive neuroradiology: beyond the hummingbird
- Memory deficits following hippocampal versus parahippocampal damage double-dissociate according to both process and material type
- Logopenic Aphasia due to a Strategic Stroke: New Evidence from a Single Case
- The Importance of Premotor Cortex for Supporting Speech Production after Left Capsular-Putaminal Damage