
Abstract
BACKGROUND AND PURPOSE: Differentiating between tumors and pseudotumoral lesions by conventional MR imaging may be a challenging question. This study aims to evaluate the potential usefulness and the added value that single-voxel proton MR spectroscopy could provide on this discrimination.
MATERIALS AND METHODS: A total of 84 solid brain lesions were retrospectively included in the study (68 glial tumors and 16 pseudotumoral lesions). Single-voxel spectra at TE 30 ms (short TE) and 136 ms (long TE) were available in all cases. Two groups were defined: “training-set” (56 cases) and “test-set” (28 cases). Tumors and pseudotumors were compared in the training-set with the Mann-Whitney U test. Ratios between resonances were defined as classifiers for new cases, and thresholds were selected with receiver operating characteristic (ROC) curves. The added value of spectroscopy was evaluated by 5 neuroradiologists and assessed with the Wilcoxon signed-rank test.
RESULTS: Differences between tumors and pseudotumors were found in myo-inositol (mIns); P < .01) at short TE, and N-acetylaspartate (NAA; P < .001), glutamine (Glx; P < .01), and choline (CHO; P < .05) at long TE. Classifiers suggested tumor when mIns/NAA ratio was more than 0.9 at short TE and also when CHO/NAA ratio was more than 1.9 at long TE. Classifier accuracy was tested in the test-set with the following results: short TE, 82% (23/28); long TE, 79% (22/28). The neuroradiologists’ confidence rating of the test-cases on a 5-point scale (0–4) improved between 5% (from 2.86–3) and 27% (from 2.25–2.86) with spectroscopy (mean, 17%; P < .01).
CONCLUSIONS: The proposed ratios of mIns/NAA at short TE and CHO/NAA at long TE provide valuable information to discriminate between brain tumor and pseudotumor by improving neuroradiologists’ accuracy and confidence.
When a brain mass is evaluated in a multidisciplinary neuro-oncology unit, the first assessment to perform is to determine whether the lesion is really a tumor or a pseudotumoral lesion. An MR imaging examination suggesting a pseudotumoral mass would indicate laboratory tests and/or follow-up. On the other hand, if a tumoral mass is suggested, stereotactic biopsy or surgical resection should be considered. In many cases, reliable differentiation of neoplastic from nonneoplastic brain masses is difficult, or even impossible, with conventional MR imaging.1–6 In these cases, information provided by additional MR techniques may be of help. Proton MR spectroscopy (1H-MR spectroscopy) is a noninvasive MR technique that provides biochemical information from tissues that has proved useful in discriminating between tumor types7–12 as well as discriminating between tumors and pseudotumors.13–18
The differential diagnosis of a brain mass varies depending on its solid or necrotic aspect. For example, when a necrotic mass is encountered in the brain, the main diagnoses include aggressive brain tumors, such as metastasis or glioblastoma (WHO grade IV) and pseudotumoral lesions such as abscess, tuberculous granuloma, parasitic infection, or radiation necrosis. On the other hand, when the lesion is solid, the main diagnoses include tumors without necrosis (WHO grades I–III) and pseudotumoral demyelinating disease. Some ischemic lesions with atypical clinical and radiologic aspects can also mimic a solid pseudotumoral mass. Finally, in some cases in which pathologic examination is absent or indeterminate, the lesion spontaneously regresses on follow-up, and only an unspecific diagnosis of “benign pseudotumoral lesion” can be established. This study focuses on the potential of 1H-MR spectroscopy to differentiate between tumors and pseudotumoral lesions when a solid mass is found in the brain. We have placed special interest in the clinical application of the results and the quantification of the added value that 1H-MR spectroscopy can provide to conventional imaging.
Materials and Methods
Patients
Our study had local ethics committee approval with waiver of informed consent. Inclusion criteria for this study were 1) presence of an untreated, solid, nonnecrotic brain mass suggesting a brain tumor, 2) diagnosis of pseudotumor or glial tumor grades II or III of the WHO confidently established, 3) spectra available obtained at both short and long TE, and 4) the spectra of good quality at visual inspection. The diagnosis of pseudotumor was based on clinical and imaging follow-up. From a clinical standpoint, patients had an acute to subacute onset of signs or symptoms involving a focal neurologic deficit mimicking the findings of an intracranial neoplasm. Imaging follow-up ranged between 2 and 77 months and showed reduction or resolution of the mass. Table 1 summarizes the details of the diagnosis in 16 patients with pseudotumors. The diagnosis of brain tumors was considered to be confidently established when a sample of the tumor could be evaluated and the pathologist could establish a single diagnosis. Because glial tumors constitute most solid tumoral masses of the brain, only glial tumors were included in the study. Our aim was to avoid the wide range of findings that would generate the fact of including a heterogeneous group of tumors, some of them with only a few representatives. This was done with the knowledge that the conclusions should not be extended to other brain tumors.
Follow-up, biopsy findings, and definitive diagnosis of 16 pseudotumoral lesions
A total of 84 cases fulfilled the inclusion criteria and were included in the final dataset (47 men and 37 women; mean age, 47 years; age range, 18–78 years). The cohort of cases was chronologically divided into 2 groups: the first two thirds were included in the “training-set” (56 consecutive cases; 30 men and 26 women; mean age, 46 years; age range, 22–73 years), whereas the remaining cases constituted the “test-set” (28 consecutive cases; 17 men and 11 women; mean age, 48 years; age range, 18–78 years). The training-set was used to assess the differences between tumors and pseudotumoral lesions and to construct the classifiers. The test-set was used to test the performance of the classifiers and to assess the added value that these classifiers could provide in a clinical situation. Table 2 shows the diagnoses included on each set. We preferred internal validation of the results with data splitting into training- and test-set rather than other methods, such as bootstrapping or leave-one-out cross-validation, because this method produced a well-defined cohort of cases (the test-set) not used in the construction of the classifiers, that could be used to assess the added value of 1H-MR spectroscopy. This division of the cases in 2 cohorts on the basis of the date of examination produced different prevalence of pathologies in the 2 groups. Nevertheless, we preferred not to correct for these differences to avoid operator biases, accepting that this could somewhat influence our results.
Final diagnoses of the cases included in the study
MR Imaging
MR imaging examination was performed in all patients with a 1.5T unit (ACS-NT; Philips Medical Systems, Best, the Netherlands) in the 3 orthogonal planes, including at least T1, T2, and fluid-attenuated inversion recovery (FLAIR)–weighted images. T1-weighted images after intravenous gadolinium-based contrast material administration (0.1 mmol/kg of body weight) were obtained in at least 2 planes.
Proton MR Spectroscopy
In all cases, single-voxel 1H-MR spectroscopy was performed with the same MR unit. A volume of interest (VOI) between (1.5 cm)3 and (2 cm)3 was placed following criteria previously approved at our institution for performing 1H-MR spectroscopy in brain tumors. Namely, the VOI size and location were determined with the aim of positioning the largest possible voxel within the brain mass, with minimal contamination from the surrounding nonafflicted tissue. Two spectra were acquired from the same VOI for every case: 1) SE short TE (2000/30/96–192) (TR/TE/averages); and 2) SE long TE (2000/136/128–256). A total of 512 data points were collected over a spectral width of 1000 Hz. Spectrum analysis was performed off-line with the use of the jMRUI software (www.mrui.uab.es).19 The intensities of the data points of the spectrum between 0 and 4.00 ppm (total, 130 data points) were selected and were used as input for the normalization and statistical analysis. The data vector was normalized to Unit Length.7,20,21 According to this method, each spectrum was normalized by summing the squares of the intensities of each data point and dividing each intensity by the square root of this sum. Chemical shifts in the frequency domain were internally referenced to creatine (Cr) 3.03 ppm and/or 11C-choline (CHO) 3.22 ppm. Average spectra plots for each group were produced by averaging the normalized spectra of the cases of the group.
Statistics and Elaboration of the Classifier Tool
The training-set of the study was evaluated to detect the individual data points in the spectrum that better discriminated between tumor and pseudotumor. For this, the Mann-Whitney U test was used to evaluate differences between the 2 groups in the region of the spectrum between 0 and 4.00 ppm. Because multiple variables were considered for every test, we corrected the obtained P values by using the Hochberg method.22 We then defined the significant differences by using the corrected P values (P*) instead of the original P value. Differences of P* < .05 were considered statistically significant. Statistics were computed with SPSS software (SPSS, Chicago, Ill).
The points of the spectrum with the smallest P* values were considered to be the most discriminative ones. Ratios of heights between these points were calculated. Our aim was to obtain 2 ratios, one for each TE, which could be used as classifiers to differentiate between tumor and pseudotumor. A third value was obtained with the addition of the 2 ratios (“combined ratio”) to obtain a global spectroscopic evaluation of the case. Receiver operating characteristic (ROC) curves were constructed.23 We selected the cutoff points with an optimal sensitivity/specificity relationship to be used as thresholds for the classification.
The “test-set” was retained until the classifiers had been definitively elaborated. Then, the classifiers were applied to this set to test their performance in an independent cohort.
Statistics and Assessment of the Added Value of Spectroscopy to Discriminate between Tumor and Pseudotumor
The “test-set” was also used to evaluate the added value of 1H-MR spectroscopy to discriminate between tumor and pseudotumor on a clinical setting. For this, 5 neuroradiologists, who had 2 to 17 years of experience in neuroradiology (mean, 6 years) and who were blinded to the final diagnosis, independently evaluated each of the 28 “test cases” in 2 steps:
First, they analyzed the complete set of images of each case. The readers were asked to rate the likelihood of the case being evaluated to be a tumor or a pseudotumor by using a 5-point confidence scale (being “0,” “quite certainly pseudotumor”; “1,” “probably pseudotumor”; “2,” “equivocal”; “3,” “probably tumor”; and “4,” “quite certainly tumor”).
After this first evaluation, the information obtained with spectroscopy for each case was submitted to the radiologists in a user-friendly format. For each single case, we submitted a form to the reader with 1) the spectra in the frequency domain, 2) intuitive 2D scatterplots depicting the projection of the case in the latent space of the “training cases,” and 3) the classification suggested by each classifier. In this second step, the radiologists provided a new rating of the case.
We calculated the improvement in the confidence rating produced by 1H-MR spectroscopy by subtracting scores provided by the radiologist with and without 1H-MR spectroscopy (improvement = score with spectroscopic information-score without spectroscopic information). Before this subtraction, the scale was adapted to obtain “modified scores” in which “0” meant “quite certainly the wrong diagnosis”; “1,” “probably the wrong diagnosis”; “2,” “equivocal”; “3,” “probably the right diagnosis”; and “4,” “quite certainly the right diagnosis.” This was done by changing over the score in cases for which the final diagnosis was pseudotumor (“0” became “4,” “1” became “3,” “2” remained unchanged, “3” became “1,” and “4” became “0”) and retaining the unmodified scores in cases for which the final diagnosis was “tumor.” The reason for this is that, in a pseudotumoral mass, if the score of a particular neuroradiologist was “2, equivocal” before spectroscopy, and “0, quite certainly pseudotumor” after spectroscopy, it should be evaluated as a positive improvement. Nevertheless, with the original scores, the quantification of the improvement would be negative (score after spectroscopy = 0; score before spectroscopy = 2; improvement = 0 – 2 = −2). This is settled with the modified scores (score after spectroscopy = 4; score before spectroscopy = 2; improvement = 4 − 2 = 2). We compared scores without and with spectroscopy using the Wilcoxon signed-rank test. Differences of P < .05 were considered statistically significant. To avoid overestimation of 28 cases evaluated by 5 readers, we performed the test with the mean evaluation of the 5 readers for each case, to obtain only 28 variables. The improvement in the confidence rating was evaluated as “percentage of improvement” (defined as “percentage of improvement” = 100* [modified score after 1H-MR spectroscopy − modified score before 1H-MR spectroscopy]/modified score before 1H-MR spectroscopy).
Results
Analysis of the Spectra in the Training-Set and Elaboration of the Classifier Tool
Average spectra for tumors and pseudotumoral lesions are shown in Fig 1. Significant differences were found at 3.55-ppm myo-inositol (mIns; P* < .01) at short TE and 2.02-ppm N-acetylaspartate (NAA; P* < .001), 2.36- and 2.48-ppm glutamine and glutamate (Glx; both P* < .01), and 3.22-ppm CHO (P* < .05) at long TE. Ratios between resonances at each TE were defined to elaborate a variable that could be used as classifier. For this, we looked for those significant resonances showing an opposite behavior between tumor and pseudotumor. Two possible ratios were considered at long TE: CHO/NAA and CHO/Glx. ROC curves were constructed with the following results: CHO/NAA, area under curve (AUC) = 0.906; CHO/Glx AUC = 0.677. In accordance with these values, we selected the CHO/NAA ratio for long TE spectra. A different situation occurred at short TE, as only mIns showed significantly higher values in tumors. In a visual assessment of the mean spectra (Fig 1A), we found differences in 2 additional resonances: NAA and CHO, though no statistical significance level was reached. Of these 2 values, NAA was higher in pseudotumors, whereas CHO values were higher in tumors. Then, the ratio mIns/NAA was selected for short TE spectra. A ROC curve was constructed (AUC = 0.94). Finally, a third variable was created by the addition of the values of both ratios (combined ratio = mIns/NAA+CHO/NAA), and the ROC curve was constructed (AUC = 0.95). We identified the values of the curve that provided the best relationship between sensitivity and specificity at short TE, long TE, and both short and long TE. Finally, the criteria selected for diagnosing a case as tumor were an mIns/NAA ratio of more than 0.90 at short TE (sensitivity, 0.88; specificity, 0.88), CHO/NAA ratio of more than 1.90 at long TE (sensitivity, 0.83; specificity, 0.88), and a combined ratio of more than 3.33 for both short and long TE (sensitivity, 0.83; specificity, 1.00).
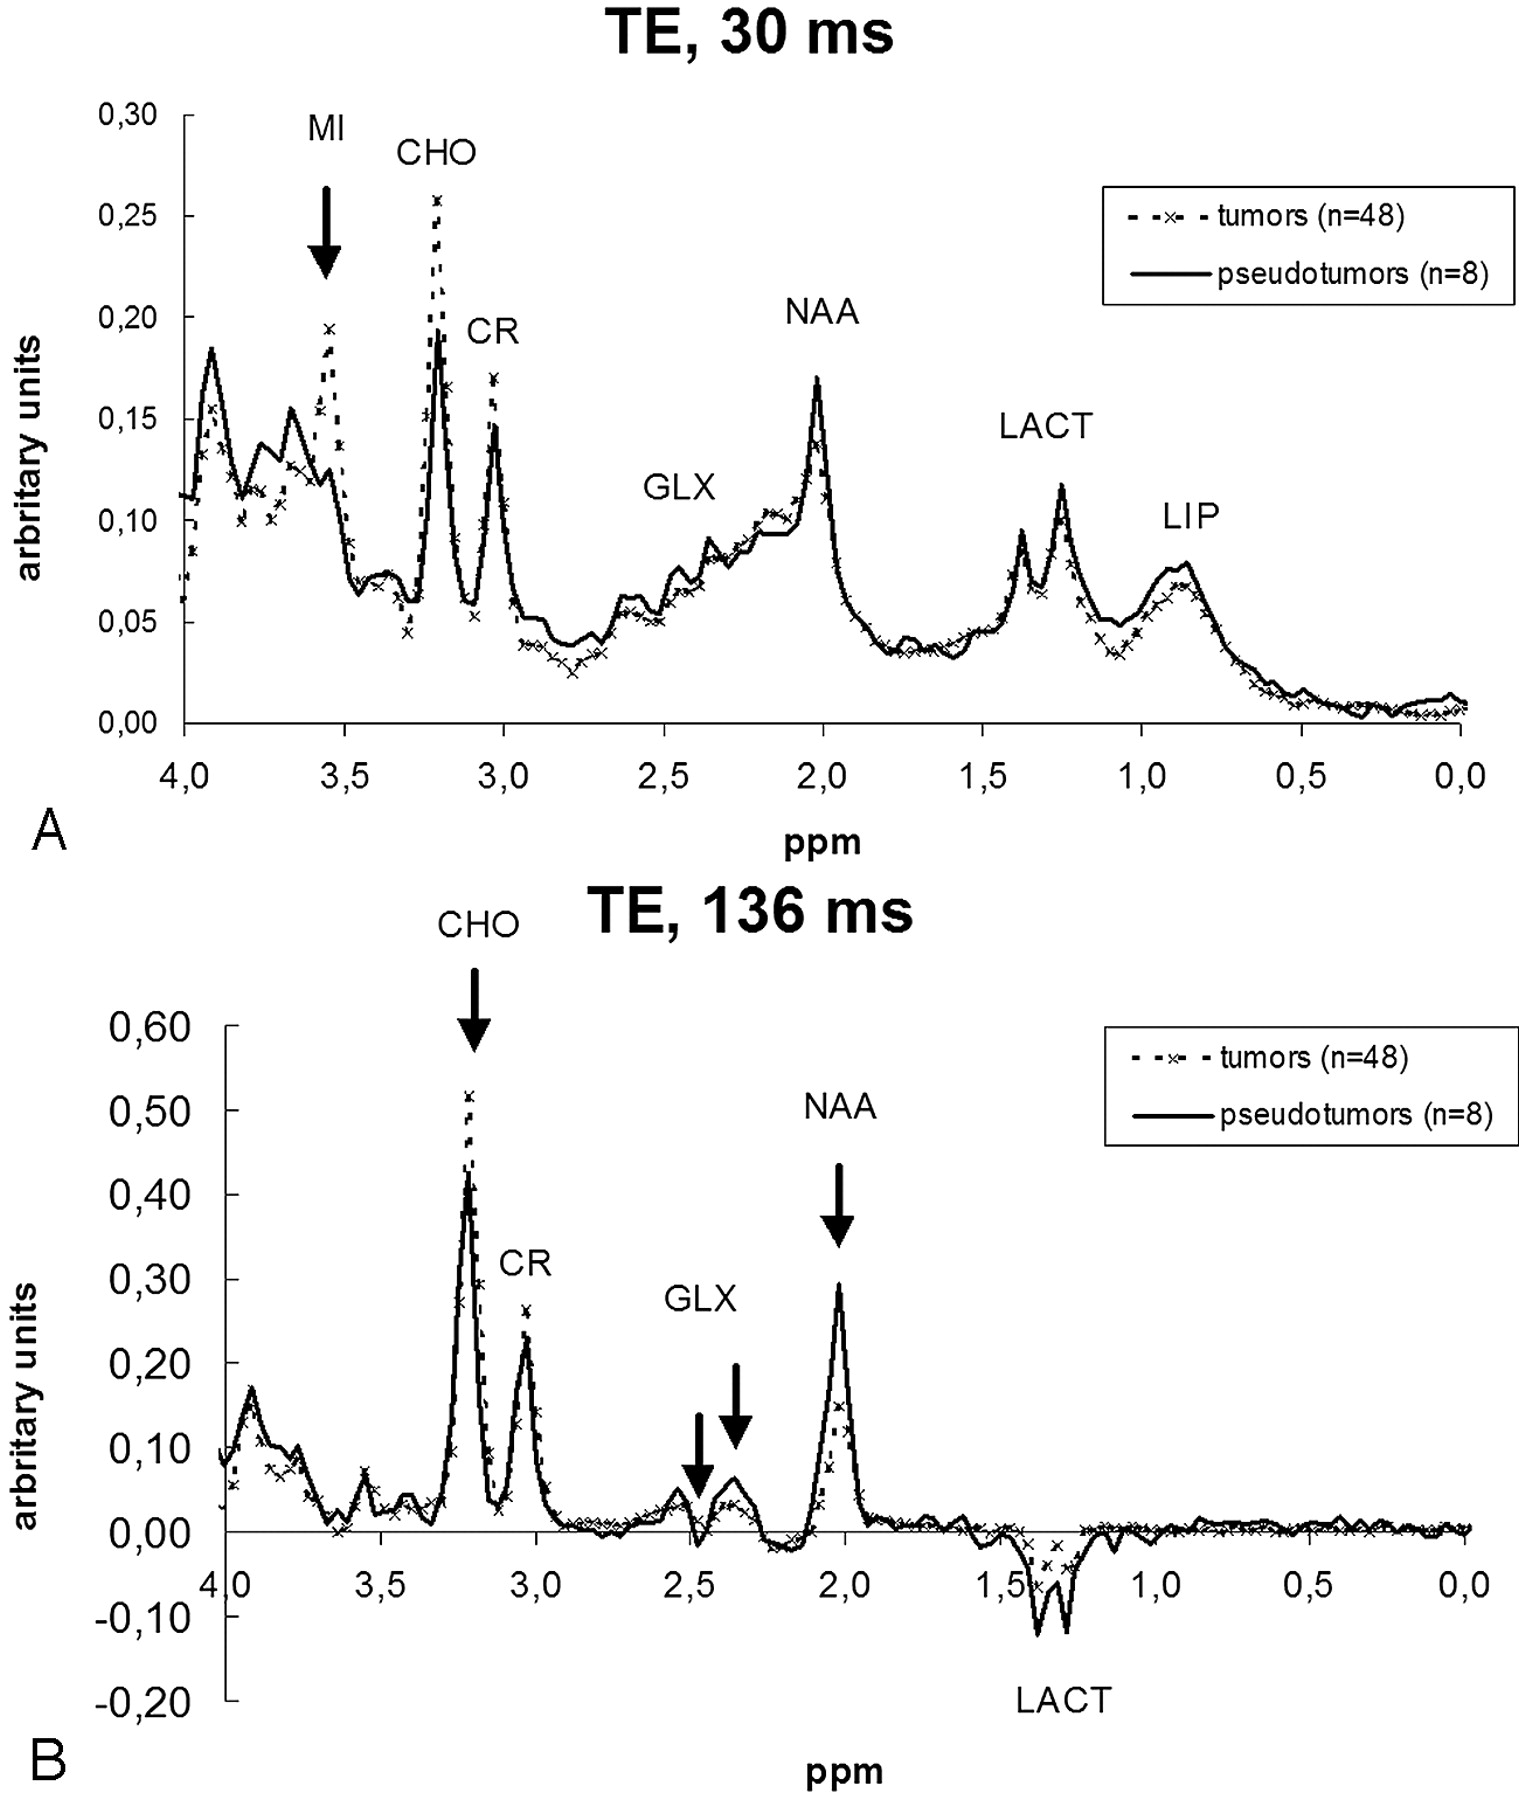
Average spectra of tumors and pseudotumors calculated with the cases included in the training-set. Arrows depict the points that showed significant differences between the 2 groups in the statistical analysis. A, Short TE (TE, 30 ms) spectra showed significant differences at 3.55 ppm (MI). Although differences in the mean spectra can also be seen at 2.02 ppm (NAA) and 3.22 ppm (CHO), no statistical significance was reached. B, Long TE (TE, 136 ms) spectra showed significant differences at 2.02 ppm (NAA), 2.36 and 2.48 ppm (GLX), and 3.22 ppm (CHO).
Testing of the Classifiers and Assessment of the Added Value of Spectroscopy
The performance of the classifiers obtained with the training-set was evaluated with the testing cohort of cases. In this cohort, 23 of 28 cases (82%) were correctly classified by short TE spectra, 22 of 28 (79%) by long TE spectra, and 22 of 28 (79%) when both spectra were evaluated with the combined ratio. The 3 parameters (short TE, long TE, and combined ratio) agreed on the same diagnosis in 21 cases. In 19 of such cases (19/21 [90%]), the suggested diagnosis was correct.
The confidence rating for the 5 readers ranged between 2.25 and 3.18 (mean, 2.69), when only conventional imaging was evaluated. This rating improved to values between 2.85 and 3.43 (mean, 3.14), when the spectroscopic information was included (range of improvement, 0.14–0.64; mean, 0.45; P < .01). The percentage of improvement in the confidence rating ranged between 5% (reader 4, from 2.86–3.00) and 27% (reader 1, from 2.25–2.86; mean, 17%). Table 3 shows the results for the 140 evaluations performed by 5 readers in 28 cases. The analysis of the table shows that 1) in 46 evaluations (46/140 [33%]), the score for MR imaging alone was “4,” and accordingly, there was no possible improvement; 2) in 61 evaluations (61/140 [44%]), spectroscopy improved the level of confidence, whereas in 16 evaluations (16/140 [11%]), the classification worsened; and 3) scores higher than “2” (above “equivocal”) were found in 93 evaluations of MR imaging alone (accuracy, 93/140 [66%]) and 109 evaluations of MR imaging plus 1H-MR spectroscopy (accuracy, 109/140 [78%]; accuracy improvement, 12%). Figures 2 and 3 show 2 illustrative examples of the test cases evaluated by the radiologists.

Case 81. Anaplastic oligoastrocytoma. A, FLAIR-weighted images show a hyperintense subcortical lesion on the right frontal lobe. B, The lesion shows slight enhancement on T1-weighted images obtained after contrast administration. C, Decrease in the apparent diffusion coefficient (ADC) is seen on the ADC map. The possibility of a cortical infarct was considered. D, 1H-MR spectroscopy at short TE shows slight increase of the mIns/NAA ratio, high CHO, and low NAA. E, 1H-MR spectroscopy at long TE shows high CHO and low NAA levels. F, Graph constructed with the mIns/NAA ratio at short TE (x axis) and CHO/NAA at long TE (y axis) of the universe (latent space) of cases of the training-set projects the case (cross) in the tumoral area. The straight line in the graph depicts the cutting point between tumor and pseudotumor on the basis of the combined ratio value (formula, x + y = 3.33). Values obtained for the classifiers were mIns/NAA ratio at short TE, 1.04 (>0.90, suggesting tumor); CHO/NAA ratio at long TE, 7.52 (>1.90, suggesting tumor), and combined ratio, 8.56 (>3.3, suggesting tumor). The lesion was an anaplastic oligoastrocytoma on the pathologic assessment.

Case 68. Unspecific benign pseudotumoral mass. A, FLAIR-weighted images show enlargement and hyperintensity of the head of the right caudate nucleus and left thalamus. B, T1-weighted images after contrast administration show slight discontinuous contrast enhancement. C, 1H-MR spectroscopy at short TE. Ratios between CHO, Cr, and NAA are within the normal range. D, 1H-MR spectroscopy at long TE shows no significant anomalies in the ratios between CHO, Cr, and NAA. E, Graph constructed with the mIns/NAA ratio at short TE (x axis) and CHO/NAA ratio at long TE (y axis) of the universe (latent space) of cases of the training-set projects the case (cross) in the nontumoral area. The straight line in the graph depicts the cutting point between tumor and pseudotumor on the basis of the combined ratio value (formula, x + y = 3.33). The arrow highlights the position of the case. Values obtained for the classifiers were mIns/NAA ratio at short TE, 0.48 (<0.90, suggesting nontumor); CHO/NAA ratio at long TE, 0.55 (<1.90, suggesting nontumor); and combined ratio, 1.03 (<3.3, suggesting nontumor). The pathologic assessment of a stereotactic biopsy was “inflammatory changes.” F, Follow-up with axial FLAIR images obtained in 8 months shows complete resolution of previous abnormalities in the images. Note a small hypointense area on the head of the caudate nucleus (arrow) corresponding to the biopsy area.
Confidence rating of 5 neuroradiologists in the discrimination between tumor and pseudotumor in 28 test-cases, before and after having available spectroscopic information
There were 2 test cases that were not classified correctly by both TEs simultaneously. The cases corresponded to anaplastic astrocytomas of only 2 cm of maximal diameter, which were classified as pseudotumors by our method. Although VOI position was considered correct in both cases, it would be feasible that contamination from surrounding normal tissue could influence in a “nontumoral” spectroscopic pattern. In both cases, the mean confidence rating of neuroradiologists worsened after spectroscopy (mean improvement in the confidence rating = −0.8 and −0.6, respectively). In addition, the classification was not correct in 3 additional cases “only” at short TE (2 tumors and 1 pseudotumor) and in 4 cases “only” at long TE (3 tumors and 1 pseudotumor). Of these 7 test cases for which a single classifier suggested a noncorrect diagnosis, the mean confidence rating of neuroradiologists worsened in 3 after spectroscopy (mean improvement = −0.4, −0.8, and −0.8, respectively), whereas in the another 3, the confidence rating improved (mean improvement = 0.2, 0.4, and 1.0, respectively), and in the seventh case, the rating remained unchanged. This means that, although the effect on the classification is negative when both TEs fail in the classification, the impact when only a TE fails can be diverse.
Discussion
1H-MR spectroscopy could be a useful tool to discriminate between tumors and pseudotumoral lesions in the brain. In our study, 1H-MR spectroscopy improved the accuracy and confidence level of 5 neuroradiologists when they were asked to discriminate between glial tumor and pseudotumor in 28 consecutive solid brain masses. This was achieved by the evaluation of 2 metabolite ratios at 2 different TEs: CHO/NAA at long TE, and mIns/NAA at short TE. This is a reproducible method with straightforward applicability into a standard clinical setting that suggests a diagnosis of tumor when CHO/NAA ratio at TE 136 ms is higher than 1.90, and the same when mIns/NAA ratio at TE 30 ms is higher than 0.90.
Previous studies have shown 1H-MR spectroscopy to influence the decision making in cases suggestive of brain tumors24 and to provide added value in the classification of brain tumors.7 In previous studies, Rand et al13 and Butzen et al14 found 1H-MR spectroscopy useful to discriminate between tumors and pseudotumors. In both studies, the accuracy of such discrimination improved when MR imaging information was submitted to the readers. Nevertheless, diagnostic performance with MR images alone was not reported. Therefore, the added value that 1H-MR spectroscopy could bring to such discrimination could not be evaluated. We believe that the improvement in accuracy and level of confidence that we have found when 1H-MR spectroscopy information is submitted to neuroradiologists confirms its usefulness and suggests a role for 1H-MR spectroscopy in the diagnosis of solid masses of the brain.
Several methods may be used to cluster a set of cases into several groups on the basis of 1H-MR spectroscopy information and to suggest a diagnosis. Some authors have used logistic regression models14 or linear discriminant analysis.15 These methods should hopefully provide a better accuracy than simpler methods, such as metabolite ratios. Nevertheless, we preferred to use ratios for our study because we felt that this should provide a better reproducibility of our results as well as an easier implementation of the method in daily clinical practice.
Elevated CHO levels and reduced NAA levels have been previously reported in acute multiple sclerosis lesions and have been explained by reactive astrogliosis, inflammation, and early axonal degeneration.25–28 We have found that the increase of CHO and the decrease of NAA at long TE is even higher in tumors and that these metabolites can be used to discriminate between tumors and pseudotumoral lesions. This suggests that a larger neuron functionality loss and larger membrane turnover characterize tumors in front of pseudotumoral processes. In addition, we found that mIns was the most discriminative resonance at short TE. mIns is a sugar-like molecule mostly located within the astrocytes, where it seems to perform a role as an osmolyte.29 Increased mIns levels have been reported in low-grade astrocytomas (related to augmented abnormal astrocyte proliferation) and have been reported to be useful for identifying low-grade astrocytomas in which the CHO/Cr ratio was unaltered.30,31 Other resonances, such as lipids and lactate, did not show significant differences between tumors and pseudotumors in this study, possibly because tumor grades that may show tumoral necrosis were not included in the study. Neither were lesions showing necrotic areas on conventional MR imaging.
We carried out our study with solid brain masses. Previous studies have mixed both MR imaging patterns from solid tissue and necrotic tissue into a single group.13–16 It is possible that the spectroscopic pattern varies depending on the solid or necrotic nature of the mass, and this can impair the performance of classification attempts. Because of this possible discrepancy, we decided to focus only on the solid subgroup of lesions, with the knowledge that our results would not be extrapolated to tumoral masses that contain necrosis.
All spectroscopic examinations were based on the single-voxel technique. This technique can be considered a limitation, as multivoxel techniques can provide smaller VOIs and a better evaluation of tumor heterogeneity, avoiding sampling error. Nevertheless, single-voxel techniques may have some relevant advantages compared with multivoxel techniques. Single-voxel 1H-MR spectroscopy is quicker and easy to evaluate in a standard clinical setting, providing the opportunity to obtain more than 1 spectrum (ie, spectra at 2 different TEs) in a reasonable amount of time. In relationship to that advantage, we have found that evaluating spectra at both short and long TE improves the level of accuracy. Also, in a recent study, Hourani et al16 reported that technical reasons precluded acquisition of multivoxel data at short TE in their study. This would influence the evaluation of some resonances relevant for the classification, such as mIns, which is underevaluated at long TE. In any case, we hope that the experience acquired with the analysis of single-voxel 1H-MR spectroscopy in our study could be exploited for multivoxel examinations. Another limitation of our study might have been that we have not evaluated tumor types other than WHO grade II and III gliomas. In our experience, other tumor types represent only a small part of nonnecrotic brain tumors, but some degree of uncertainty could rely on this limitation and should be taken into account for future applicability of our results. A third limitation to consider may be the heterogeneity of diagnoses included in the study. This could enlarge the range of spectroscopic characteristics for each group (tumors and pseudotumors), reducing the significance of differences. On the other hand, we consider that this heterogeneity, as well as the differences in the relative incidence of each pathologic diagnosis between the training- and test-set, could have a positive effect on the reproducibility of our reported results.
Conclusions
In our study, the tumors showed differences with pseudotumoral lesions on higher mIns intensity at short TE, high CHO intensity at long TE, and low NAA and Glx intensities at long TE. We suggested 2 resonance intensity ratios to be used to classify tumors and pseudotumoral lesions: mIns/NAA at short TE (mIns/NAA ratio >0.9 indicates tumor; classifier accuracy in the test-set, 82%) and CHO/NAA at long TE (CHO/NAA ratio >1.9 indicates tumor; classifier accuracy in the test-set, 79%). These ratios can be used in daily clinical practice to improve accuracy and neuroradiologists’ confidence rate in this classification (accuracy improvement in our test-set, 12%; mean confidence rate improvement, 17%). In accordance with these ratios, we believe that 1H-MR spectroscopy may play a role in the noninvasive assessment of solid brain lesions by suggesting a diagnosis of tumor or pseudotumor and by improving the accuracy and confidence level of neuroradiologists in the diagnosis.
Acknowledgments
We thank Mr. Llorenç Badiella (Statistics Support Facility of Universitat Autònoma de Barcelona) for technical advice on statistical data processing, Dr. Juan J. Acebes (Department of Neurosurgery of Hospital Universitari de Bellvitge) for helpful discussions pertaining to this study, and Drs. Mònica Cos and Àngels Camins (Institut de Diagnòstic per la Imatge of Hospital Universitari de Bellvitge) for recruitment assistance.
CIBER-BBN is an initiative of “Instituto de Salud Carlos III” (ISCIII), Spain.
Footnotes
This study was funded in part by MEDIVO2 (MEC SAF2005-03650) and Generalitat de Catalunya SGR2005-00863 and XT2004-51.
References
- Received July 14, 2008.
- Accepted after revision September 29, 2008.
- Copyright © American Society of Neuroradiology
In this issue


Jump to section
Related Articles
Cited By...
- Diagnostic Accuracy of MR Spectroscopic Imaging and 18F-FET PET for Identifying Glioma: A Biopsy-Controlled Hybrid PET/MRI Study
- Spatial Relationship of Glioma Volume Derived from 18F-FET PET and Volumetric MR Spectroscopy Imaging: A Hybrid PET/MRI Study
- Utility of Proton MR Spectroscopy for Differentiating Typical and Atypical Primary Central Nervous System Lymphomas from Tumefactive Demyelinating Lesions
- MR Imaging of Neoplastic Central Nervous System Lesions: Review and Recommendations for Current Practice
- Proton MR Spectroscopy Provides Relevant Prognostic Information in High-Grade Astrocytomas
- Intracranial dural arteriovenous fistula presenting as an enhancing lesion of the medulla