
Abstract
BACKGROUND AND PURPOSE: Diffusion-weighted imaging (DWI) is sensitive to the cerebral manifestations of human prion diseases. The magnitude of diffusion weighting, termed “b factor,” has only been evaluated at the standard b = 1000 s/mm2. This is the first rigorous evaluation of b = 2000 s/mm2 in Creutzfeldt-Jakob Disease (CJD).
MATERIALS AND METHODS: We compared DWI characteristics of 13 patients with CJD and 15 healthy controls at b = 1000 s/mm2 and b = 2000 s/mm2. Apparent diffusion coefficients (ADC) were computed and analyzed for the whole brain by voxel-wise analysis (by SPM5) as well as in anatomically defined volumes of interest (by FSL FIRST).
RESULTS: Measured ADC was significantly lower (by approximately 5%–15%) at b = 2000 s/mm2 than at b = 1000 s/mm2 and significantly lower in patients than in controls. The differences between patients and controls were greater and more extensive at b = 2000 s/mm2 than at b = 1000 s/mm2 in the expected regions (thalamus, putamen, and caudate nucleus).
CONCLUSIONS: Because higher b factors change the absolute value of observed ADC, as well as lesion detection, care should be taken when combining studies using different b factors. While the clinical application of high b factors is currently limited by a low signal intensity–to-noise ratio, it may offer more information in questionable cases, and our results confirm and extend the central role of diffusion imaging in human prion diseases.
Creutzfeldt-Jakob Disease (CJD) is the most notable of human transmissible spongiform encephalopathies. These fatal neurodegenerative conditions are thought to be caused by prions, misfolded proteins devoid of conventional genetic material.1 The etiology can be infectious, hereditary, sporadic, or iatrogenic; and symptoms primarily include myoclonus, ataxia, and rapidly progressive dementia.2 Sporadic CJD (sCJD) is the most common subtype of CJD (85%–90%). Familial CJD (fCJD), caused by mutations of the gene encoding the normal form of the prion protein (PrPc), accounts for approximately 10% of cases worldwide. The most common of these mutations occurs in codon 200 (E200K).
MR imaging has been highly useful for CJD diagnosis, the most sensitive and specific marker being restricted diffusion in the basal ganglia, thalamus, and cortex in diffusion-weighted imaging (DWI).3,4 DWI can evaluate the microstructure of the brain in vivo by measuring displacement of water molecules for a period of time.5 The images are constructed by applying a pair of magnetic field gradients for approximately 100 ms; image intensity is then a function of applied gradient amplitude, gradient duration, and diffusion time. In practice, these 3 controlling parameters are combined to derive the so-called b factor. In CJD as well as all other clinical conditions, the vast bulk of studies has been performed at a standard b factor of 1000 s/mm2. With advancing hardware technology, stronger gradients and faster slew rates have facilitated the use of a high b factor and the ability to obtain images with a greater degree of diffusion weighting. Such high b factor studies have been reported to provide better detection of ischemic stroke, as well as white matter damage in Alzheimer disease and vascular dementia.6–9 We aimed to evaluate the utility of this technique in CJD.
While DWI images are valuable for clinical diagnosis, their nonquantitative nature limits direct comparison across scans, and their diffusion signal intensity is confounded by transverse relaxation time (T2) effects, complicating interpretation. We, therefore, quantified diffusion by calculating the apparent diffusion coefficient (ADC) and compared the ADC between patients with CJD and matched controls.
Materials and Methods
Subjects
As part of a large prospective imaging study of CJD, both patients and healthy controls underwent DWI scanning at both b = 1000 s/mm2 and b = 2000 s/mm2. Patients all had a clinical diagnosis of probable CJD by World Health Organization criteria,10 with at least 2 of the following indications: rapidly progressive dementia, myoclonus, visual or cerebellar symptoms, pyramidal or extrapyramidal dysfunction, or akinetic mutism. MR imaging was conducted early in the course of the disease, an average of 3.4 ± 2.3 months from symptomatic onset, prior to the onset of dementia. Because clinical diagnosis at early stages of the disease may be uncertain, all patients (5 sporadic and 8 familial) were followed clinically until death to confirm the diagnosis. They survived 7.1 ± 5.3 months following the MR imaging. Controls were healthy by history, medical and neurologic examination, and neuropsychological testing. As Table 1 shows, healthy subjects were free of cognitive deficits as measured by the Mini-Mental State Examination11 and neurologic symptoms as measured by the structured Clinical Neurologic Scale.12 The patients showed, as expected, significant neurologic symptoms and cognitive deficits, despite their short disease duration. The study was approved by the institutional review board of the Sheba Medical Center, Israel, and the Mount Sinai Medical Center, New York.
Subject characteristicsa
Image Acquisition
Scanning was performed at the Sheba Medical Center, Israel, on a 1.5T Signa Excite system (GE Healthcare, Milwaukee, Wisconsin) with a standard quadrature head coil. As part of the standardized study protocol, MR imaging sequences included a single-shot echo-planar spin-echo DWI sequence and a high-resolution anatomical T1-weighted sequence (spoiled gradient-recalled [SPGR]). The SPGR sequence was acquired with 104 contiguous axial sections, FOV = 240 mm, TR = 28 ms, TE = 6 ms, and flip angle = 40°, 1.5-mm section thickness with an acquisition matrix of 256 × 256 yielding reconstructed voxel dimensions of 0.94 × 0.94 × 1.50 mm. Acquisition parameters for DWI with b = 1000 s/mm2 or b = 2000 s/mm2 were identical except for the TE, which was 85 ms for b = 1000 s/mm2 and 100 ms for b = 2000 s/mm2. Forty-eight contiguous axial-oblique sections were acquired with TR = 5000 ms, FOV = 240 mm, 3.0-mm section thickness, and an acquisition matrix of 128 × 128, which was zero-filled to 256 × 256, yielding a reconstructed image resolution of 0.94 × 0.94 × 3.0 mm. Each DWI sequence acquired a non-DWI (b = 0 s/mm2, T2-weighted) and DWIs (b = 1000 s/mm2 and b = 2000 s/mm2), which were derived automatically as a geometric mean of the individual signal intensities (SI) with diffusion gradients along 3 orthogonal directions, SIDWI = (SIxSIySIz)1/3. The b = 2000 s/mm2 scans were always obtained immediately after the b = 1000 s/mm2 scans.
The acquired DWI images were analyzed with Matlab code (MathWorks, Natick, Mass) developed in-house to derive the ADC maps. Parenchymal regions were first delineated by applying the Brain Extraction Tool (BET, Functional Magnetic Resonance of the Brain Software Library [FSL] 4.0, http://www.fmrib.ox.ac.uk/fsl/) onto the b = 0 s/mm2 image. ADC was then calculated by the standard Stejskal-Tanner equation in each voxel,
 where S(b1) and S(b2) are the signal intensities of DWI with applied b factors of b1 = 0 s/mm2 and b2, which can be 1000 s/mm2 or 2000 s/mm2, respectively.13 Visual examination of all DWI images was conducted for quality control. Abnormally high signal intensity, in comparison with adjacent sections, was detected in 6 sections (of 2688 sections acquired), 4 in controls and 2 in patients. ADC values were uniformly elevated within these sections and were manually corrected by rescaling to match the intensity of adjacent sections. The artifacts were not spatially selective, and it is not clear whether they were related to a scanner malfunction, bulk head movement, or CSF pulsation.14–16 Repeated image analysis without these corrections did not alter our results.
Voxel-Wise Image Analysis
Whole-brain voxel-based analyses were performed by statistical parametric mapping (SPM5, Wellcome Department of Imaging Neuroscience, University College London, London, UK). In the spatial processing step, the T2-weighted (b = 0 s/mm2) image was first coregistered with the anatomical image (SPGR), and the resulting coregistration parameters were applied to the ADC map. Normalization parameters were then derived by warping the SPGR T1-weighted image to match the canonical template of ICBM 452 tissue probability maps by using the segmentation approach.17,18 The resulting normalization parameters were applied onto ADC maps, which were resectioned at 2 × 2 × 2 mm. Last, normalized ADC maps were smoothed by an isotropic 4-mm gaussian smoothing kernel.
The resulting smoothed and normalized ADC images were submitted to a group-level random-effects model of analysis of covariance (ANCOVA) between healthy controls and patients with age as a covariate. We searched for voxels in which the measured ADC was significantly lower in patients with CJD than in controls, with significance thresholds of P < .001 (uncorrected) and cluster size, K, greater than 5 contiguous voxels. The nominal P < .001 is for 2-tailed tests, yielding an actual significance level of P < .0005 for our 1-tailed contrasts. Anatomic locations were identified by Montreal Neurological Institute (MNI) Space Utility ([MSU], http://www.ihb.spb.ru/∼pet_lab/MSU/MSUMain.html). A custom explicit mask was also created before statistical analysis to avoid voxels likely to be pure CSF. In each voxel, if any subject’s ADC value exceeded the upper limit, 2500 μm2/s, the voxel was excluded from further analysis.
Volume-of-Interest Analysis
Anatomical volumes of interest (VOI) were identified with FMRIB Integrated Registration and Segmentation Tool (FIRST, FSL 4.0, http://www.fmrib.ox.ac.uk/fsl).19 Four structures were delineated in bias-field corrected SPGR images: the globus pallidus, putamen, caudate nucleus, and thalamus. On the basis of previous findings,20,21 we expected the striatum and thalamus to be positive (ie, to show differences between patients and controls), whereas the globus pallidus was expected to serve as a negative control. To calculate mean ADC in each structure, we resectioned the coregistered ADC map to match the image resolution of SPGR by using trilinear interpolation, and masked it by the parcellated images. Voxels classified as a boundary by FIRST (intensity >100) were excluded from the VOI analysis to reduce the risk of including CSF due to a small misregistration between anatomical and diffusion images at tissue-CSF boundaries. Left and right ADC values were averaged and were analyzed by a repeated-measures ANOVA with diagnosis as a grouping factor and the b factor (1000 s/mm2 versus 2000 s/mm2) as a repeated measure (age covariance did not change the findings).
Results
The voxel-based SPM analysis between patients and controls at the 2 b factors is depicted in Fig 1 and detailed in Table 2. As expected, ADC was reduced in patients with CJD in deep gray matter structures, specifically the caudate, putamen, and thalamus. The significant clusters with b = 2000 s/mm2 were substantially larger, and the mean differences were greater than with b = 1000 s/mm2. For example, the size of clusters occupying the right caudate and putamen increased by more than 5-fold. Furthermore, we observed the emergence of new clusters with the increase in b factor; unilateral findings in the right putamen at 1000 s/mm2 became bilateral at 2000 s/mm2. The pulvinar was also involved as a part of a large cluster found in the thalamus with b = 2000 s/mm2. ADC images of an individual patient (case 2018) at both b factors are illustrated in Fig 2.

Clusters in which the apparent diffusion coefficient (ADC) was found to be significantly reduced in patients with Creutzfeldt-Jakob disease (CJD) compared with healthy controls at P < .001 and K > 5. Clusters were overlaid onto averaged T1-weighted images. A, Result at b = 1000 s/mm2. B, Result at b = 2000 s/mm2. The left and right hemispheres are identified as L and R.

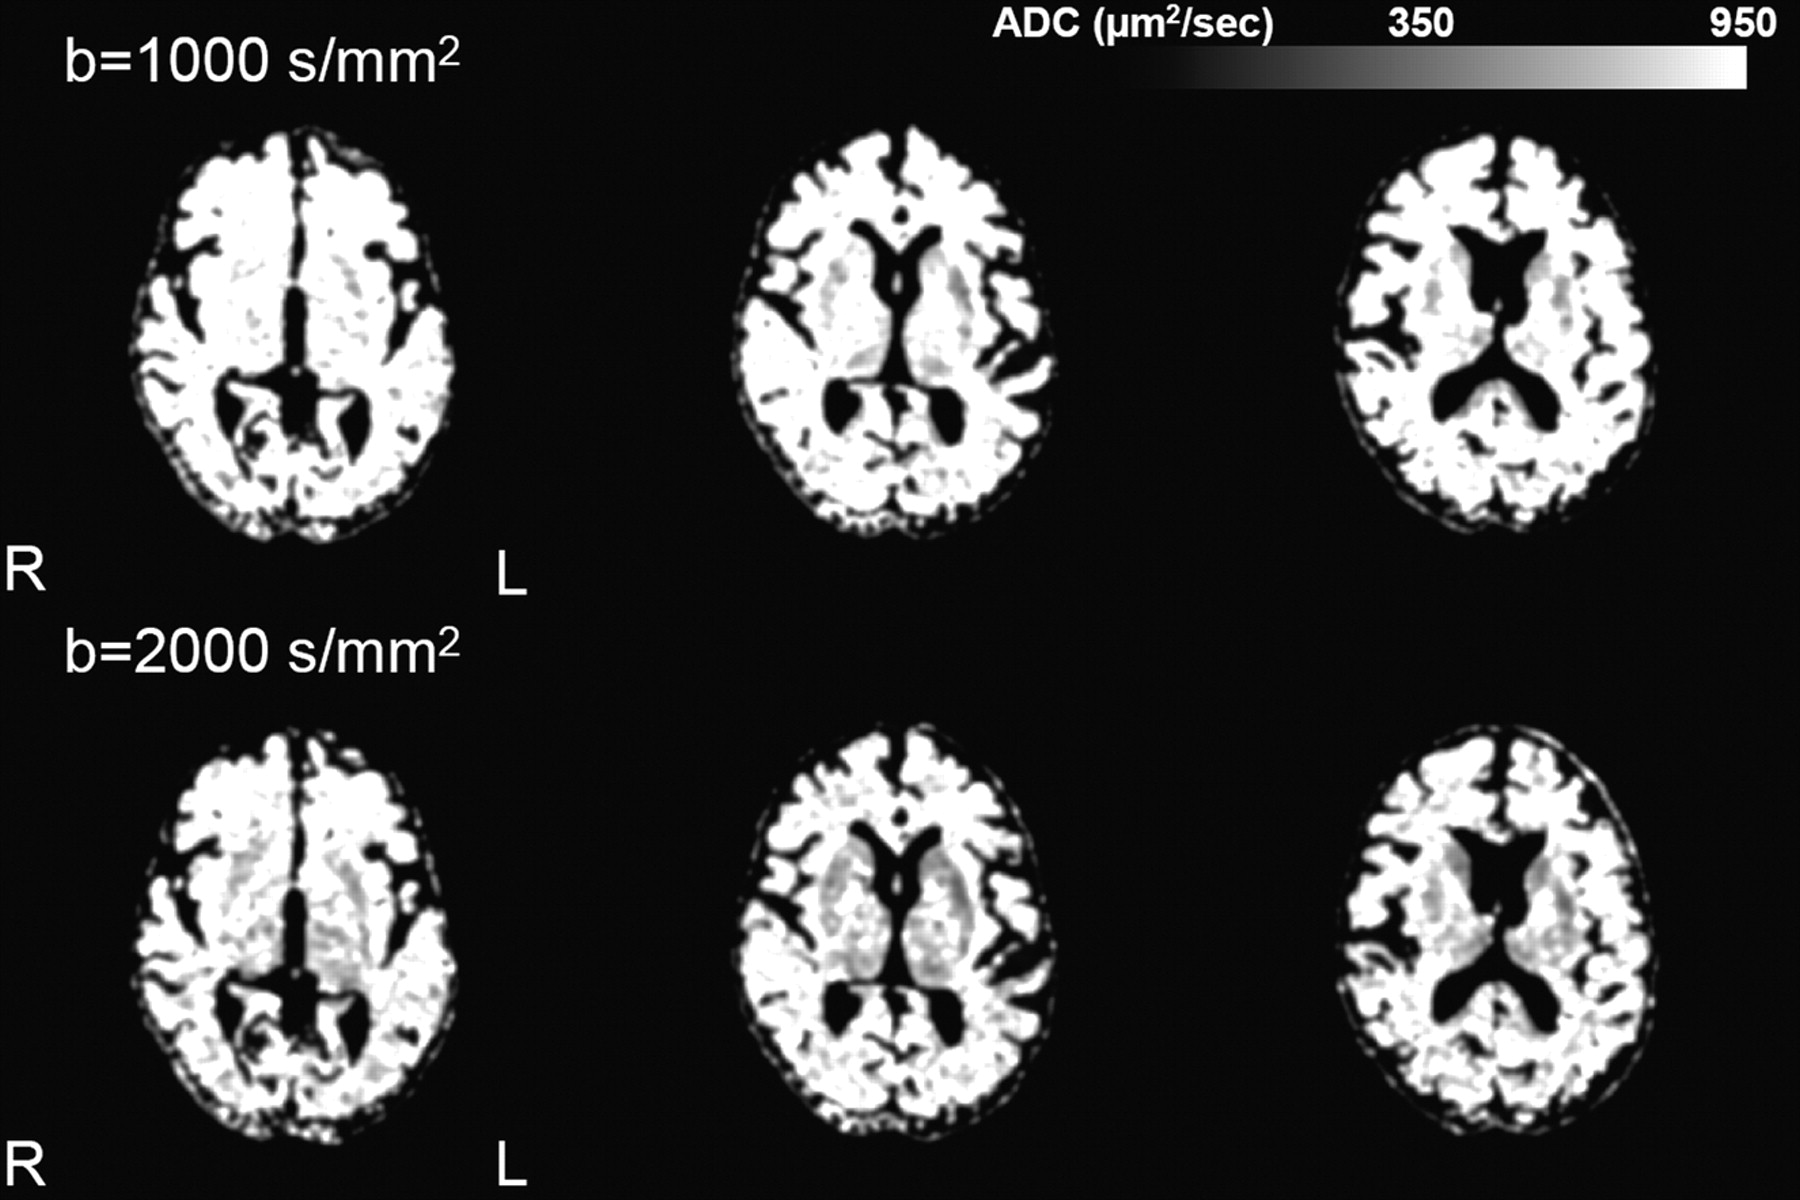
Representative ADC maps of a patient with sporadic CJD (sCJD) (case 2018) at b = 1000 s/mm2 and b = 2000 s/mm2. For illustration purposes, images were smoothed with a 3-mm isotropic smoothing kernel. Signal-intensity abnormality involves the caudate, putamen, and thalamus bilaterally and becomes more extensive at b = 2000 s/mm2 compared with b= 1000 s/mm2. The left and right hemispheres are identified as L and R.
Summary of clusters in which ADC was found to be significantly reduced (P < .001) among patients compared with normal controlsa
ADC was also analyzed with repeated-measures ANOVA within each of the parcellated anatomical VOIs. The main effect of the b factor was highly significant (P < .0001 in all structures, including globus pallidus), with ADC lower at the higher b factor. The main effect of the diagnosis was significant (ADC was lower in patients) in the putamen (F1,26 = 5.44, P < .03), caudate (F1,26 = 82.78, P < .001), and thalamus (F1,26 = 6.56, P < .02), but not in the globus pallidus. Additionally, in the caudate (P < .01) and thalamus (P < .01), there was a significant interaction between the b factor and diagnostic group, indicating that the differences between patients and controls were greater at b = 2000 s/mm2 than at b = 1000 s/mm2.
These results are summarized in Fig 3. While ADC was always lower at b = 2000 s/mm2 than at b = 1000 s/mm2, these differences were larger in patients than in controls: caudate (13% versus 7%), putamen (8% versus 4%), thalamus (15% versus 10%), and globus pallidus (13% versus 11%). Consequently, the differences between patients and controls were larger at b = 2000 s/mm2 (8%–11% in the caudate, putamen, and thalamus) than at b = 1000 s/mm2 (3% ∼ 8%). The globus pallidus, as expected, showed the smallest diagnostic effect (1% at b = 1000 s/mm2, 3% at b = 2000 s/mm2).

Bar graphs (b = 1000 s/mm2 in black, b = 2000 s/mm2 in gray) depict the patient ADC as a percentage of the control ADC. Mean ± SD ADC values are listed in the table for each structure.
Discussion
DWI is known to provide a sensitive diagnostic test for CJD.4,22 Previous studies have all been conducted at the standard b factor of 1000 s/mm2; this is the first quantitative study of DWI at b = 2000 s/mm2 in human prion diseases, and our results demonstrate that a higher b factor yields a better discrimination of patients with CJD from controls. The magnitude of our ADC reductions in patients with CJD at the conventional b = 1000 s/mm2 is also consistent with that in previous reports. Our current results in patients with early CJD show 3%–8% ADC reductions in the anatomically defined basal ganglia and thalamus and 11%–15% in the clusters defined by the voxel-based analysis. Lin et al (2006)23 reported an average reduction of 14% in ADC in the caudate, thalamus, putamen, and cortical areas. Others reported thalamic reductions of 17% and larger effects in the putamen (22%) and caudate nucleus (29%).24 We found similar reductions in a preliminary report on patients with fCJD with the E200K mutation.25
Voxel-wise analysis revealed unilateral and bilateral ADC reductions in the putamen at b = 1000 s/mm2 and b = 2000 s/mm2, respectively. Case reports have previously described unilateral signal-intensity abnormalities in MR imaging of patients with CJD, but studies with larger samples consistently showed bilateral involvement.24-31 In the current study, we have confirmed bilaterally reduced ADC in the putamen at b = 1000 s/mm2 with a more liberal statistical significance level (P < .005). We believe the absence of bilateral findings in the putamen at b = 1000 s/mm2 merely reflects its lower statistical power.
Contrary to other diffusion studies in CJD, which were based on visual ratings, our quantitative voxel-wise analysis failed to detect significant cortical involvement, often described as cortical ribbons. To explain this, methodologic aspects as well as sample demographics should be considered. In uncontrolled studies, cortical hyperintensities, usually in the cingulate gyrus and insular regions, may represent false-positive findings, because they are also common among neurologically healthy subjects. Asao et al (2008),32 for example, observed that most DWI images of healthy subjects appear hyperintense in the cingulate gyrus and insula. Also, cortical diffusion abnormalities in CJD are focal and sparsely distributed, often in variable locations across individual patients.33 These are efficiently detected by visual examination of images, but lesions must be overlapping at the spatial resolution of voxels to be detectible by voxel-wise analysis. Such overlap may be rare in prion diseases, where the precise location of cortical involvement is variable. Additionally, the differential involvement of the cortex and basal ganglia may depend on molecular subtypes of methionine/valine polymorphism at codon 129 of the prion protein gene (MM, MV,VV) as well as on the duration of the disease,34–36 and possibly the clinical phenotype. An examination of this heterogeneity should be pursued in future work.
Our findings reinforce the current notion that diffusion MR imaging reveals processes fundamental to prion disease, because greater diffusion-weighting increases diagnostic discrimination. The reason for improved discrimination at a higher b factor is unknown, but we hypothesize that it is due to an interaction between prolonged diffusion length at a high b factor and CJD-specific histopathology. The relationship between diffusion abnormalities and histopathology has only been studied in a few case reports and is not yet clear. Diffusion-weighted signal-intensity changes are variably associated with all the hallmarks of CJD histopathology, spongiosis, gliosis, prion protein (PrPSc) deposition, and neuronal loss; and we believe the major cause of diffusion changes involving both hindered and restricted diffusion components is primarily due to the presence of vacuoles (and, possibly, prion deposits).37 This idea is based on theoretic considerations and some empiric support based on postmortem studies.38,39 A similar effect of hindered diffusion was observed for amyloid deposits in transgenic mice, supporting this notion.40
Methodologically, our findings underscore the possible hazards of combining diffusion data obtained at different b factors, now that this technology is more widely available. ADC is sometimes considered a stable and quantitative tissue parameter, a notion that seems to be contradicted by our finding of a lower ADC at a higher b factor. However, this is fully consistent with previous literature and explained by the multiexponential nature of diffusion-weighted signals. Standard DWI methods assume monoexponential diffusion signal-intensity decay as a function of the b factor, but there is a strong basis to assume that signal-intensity decay is at least biexponential at high b factors, though the mechanism of the multiexponential signal-intensity decay is still under debate.41–45 In the biexponential model, the diffusion signal intensity at a given b factor is proportional to the sum of fast and slow diffusion components; at a low b factor, much of the ADC signal intensity is contributed from the fast component, whereas at a high b factor, the signal intensity is dominated by the slow diffusion component, lowering ADC. Previous work in healthy subjects suggested 8%–14% reductions of ADC at b = 2000 s/mm2, compared with b = 1000 s/mm2.41,46 Our finding of 4%–11% reductions is consistent with these reports. While the current findings should encourage and validate the use of higher b factors in diffusion studies of prion disease, combining variable b factors, such as in the work of Meissner et al,35 may lead to erroneous conclusions. At the very least, if studies include scans obtained at different b factors, this confounding ADC reduction should be statistically controlled and accounted for and the results cautiously interpreted.
The clinical utility of a higher b factor in human prion diseases should ultimately be assessed by blind controlled studies that will quantify diagnostic sensitivity and specificity. Currently, we believe the clinical utility of a high b factor DWI is limited by a suboptimal signal intensity–to-noise ratio (SNR). Figure 4 illustrates this consideration by depicting DWI images of 2 patients with fCJD and 2 patients with sCJD, showing hyperintense lesions in the caudate nucleus, putamen, thalamus, and cortex. Because DWI signals attenuate exponentially with respect to the b factor, images acquired at b = 2000 s/mm2 become inevitably noisier than those at b = 1000 s/mm2, and precise anatomy is more difficult to ascertain. The combination of higher lesion detection and lower SNR suggests that further optimization of high b factor imaging (eg, by considering high-field scanning, signal intensity averaging, parallel imaging, and reducing the TE) may offer greater diagnostic accuracy in the future.

Representative imaging findings on diffusion-weighted imaging at b = 1000 s/mm2 and b = 2000 s/mm2 sequences in 4 symptomatic patients (2 with familial CJD [fCJD] and 2 with sCJD). Signal-intensity abnormalities involve the caudate nucleus, putamen, thalamus, and cortex. The left and right hemispheres are identified as L and R.
Acknowledgments
We thank the Wellcome Trust Centre for Neuroimaging at University College London (http://www.fil.ion.ucl.ac.uk/spm/) for the development of SPM; the FMRIB Software Library laboratory at Oxford University (http://www.fmrib.ox.ac.uk/fsl) for the development of FSL; and Sergei Pakhomov, MD, Institute of the Human Brain, Russian Academy of Science, Saint Petersburg, Russia, for the development of MSU (http://www.ihb.spb.ru/∼pet_lab/MSU/MSUMain.html).
Footnotes
-
This work was supported by National Institutes of Health grant RO1 NS43488.
-
Preliminary account previously presented at: International Society for Magnetic Resonance in Medicine, May 3–9, 2008; Toronto, Ontario, Canada.
Indicates open access to non-subscribers at www.ajnr.org
References
- Received April 23, 2009.
- Accepted after revision May 22, 2009.
- Copyright © American Society of Neuroradiology
In this issue


Jump to section
Related Articles
Cited By...
- Neuroimaging of Rapidly Progressive Dementias, Part 2: Prion, Inflammatory, Neoplastic, and Other Etiologies
- Multiparameter MR Imaging in the 6-OPRI Variant of Inherited Prion Disease
- Imaging of the 6-OPRI Mutation Prion Disease: An Entity Distinct from Typical Creutzfeldt-Jakob Disease?
- Susceptibility of Domestic Cats to Chronic Wasting Disease