Advertisement

Main menu

  • Home
  • Content
    • Current Issue
    • Accepted Manuscripts
    • Article Preview
    • Past Issue Archive
    • Video Articles
    • AJNR Case Collection
    • Case of the Week Archive
    • Case of the Month Archive
    • Classic Case Archive
  • Special Collections
    • AJNR Awards
    • ASNR Foundation Special Collection
    • Most Impactful AJNR Articles
    • Photon-Counting CT
    • Spinal CSF Leak Articles (Jan 2020-June 2024)
  • Multimedia
    • AJNR Podcasts
    • AJNR SCANtastic
    • Trainee Corner
    • MRI Safety Corner
    • Imaging Protocols
  • For Authors
    • Submit a Manuscript
    • Submit a Video Article
    • Submit an eLetter to the Editor/Response
    • Manuscript Submission Guidelines
    • Statistical Tips
    • Fast Publishing of Accepted Manuscripts
    • Graphical Abstract Preparation
    • Imaging Protocol Submission
    • Author Policies
  • About Us
    • About AJNR
    • Editorial Board
    • Editorial Board Alumni
  • More
    • Become a Reviewer/Academy of Reviewers
    • Subscribers
    • Permissions
    • Alerts
    • Feedback
    • Advertisers
    • ASNR Home

User menu

  • Alerts
  • Log in

Search

  • Advanced search
American Journal of Neuroradiology

American Journal of Neuroradiology

ASHNR American Society of Functional Neuroradiology ASHNR American Society of Pediatric Neuroradiology ASSR
  • Alerts
  • Log in

Advanced Search

  • Home
  • Content
    • Current Issue
    • Accepted Manuscripts
    • Article Preview
    • Past Issue Archive
    • Video Articles
    • AJNR Case Collection
    • Case of the Week Archive
    • Case of the Month Archive
    • Classic Case Archive
  • Special Collections
    • AJNR Awards
    • ASNR Foundation Special Collection
    • Most Impactful AJNR Articles
    • Photon-Counting CT
    • Spinal CSF Leak Articles (Jan 2020-June 2024)
  • Multimedia
    • AJNR Podcasts
    • AJNR SCANtastic
    • Trainee Corner
    • MRI Safety Corner
    • Imaging Protocols
  • For Authors
    • Submit a Manuscript
    • Submit a Video Article
    • Submit an eLetter to the Editor/Response
    • Manuscript Submission Guidelines
    • Statistical Tips
    • Fast Publishing of Accepted Manuscripts
    • Graphical Abstract Preparation
    • Imaging Protocol Submission
    • Author Policies
  • About Us
    • About AJNR
    • Editorial Board
    • Editorial Board Alumni
  • More
    • Become a Reviewer/Academy of Reviewers
    • Subscribers
    • Permissions
    • Alerts
    • Feedback
    • Advertisers
    • ASNR Home
  • Follow AJNR on Twitter
  • Visit AJNR on Facebook
  • Follow AJNR on Instagram
  • Join AJNR on LinkedIn
  • RSS Feeds

AJNR is seeking candidates for the AJNR Podcast Editor. Read the position description.

Research ArticleBrain
Open Access

Enhancing Fraction in Glioma and Its Relationship to the Tumoral Vascular Microenvironment: A Dynamic Contrast-Enhanced MR Imaging Study

S.J. Mills, C. Soh, J.P.B. O'Connor, C.J. Rose, G. Buonaccorsi, S. Cheung, S. Zhao, G.J.M. Parker and A. Jackson
American Journal of Neuroradiology April 2010, 31 (4) 726-731; DOI: https://doi.org/10.3174/ajnr.A1925
S.J. Mills
  • Find this author on Google Scholar
  • Find this author on PubMed
  • Search for this author on this site
C. Soh
  • Find this author on Google Scholar
  • Find this author on PubMed
  • Search for this author on this site
J.P.B. O'Connor
  • Find this author on Google Scholar
  • Find this author on PubMed
  • Search for this author on this site
C.J. Rose
  • Find this author on Google Scholar
  • Find this author on PubMed
  • Search for this author on this site
G. Buonaccorsi
  • Find this author on Google Scholar
  • Find this author on PubMed
  • Search for this author on this site
S. Cheung
  • Find this author on Google Scholar
  • Find this author on PubMed
  • Search for this author on this site
S. Zhao
  • Find this author on Google Scholar
  • Find this author on PubMed
  • Search for this author on this site
G.J.M. Parker
  • Find this author on Google Scholar
  • Find this author on PubMed
  • Search for this author on this site
A. Jackson
  • Find this author on Google Scholar
  • Find this author on PubMed
  • Search for this author on this site
  • Article
  • Figures & Data
  • Info & Metrics
  • Responses
  • References
  • PDF
Loading

Abstract

BACKGROUND AND PURPOSE: EnF is a newly described measure of proportional tumor enhancement derived from DCE-MR imaging. The aim of this study was to assess the relationship between EnF and the more established DCE-MR imaging parameters: Ktrans, ve, and vp.

MATERIALS AND METHODS: Forty-two patients with 43 gliomas (16 grade II, 3 grade III, and 24 grade IV) were studied. Imaging included pre- and postcontrast T1-weighted sequences through the lesion and T1-weighted DCE-MR imaging. Parametric maps of EnF, Ktrans, ve, and vp were generated. Voxels were classified as enhancing if the IAUC was positive (EnFIAUC60>0). A threshold of IAUC > 2.5 mmol.s was used to generate EnFIAUC60>2.5. Both measures of EnF were compared with the DCE-MR imaging parameters (Ktrans, ve, and vp).

RESULTS: In grade II gliomas, EnFIAUC60>0 and EnFIAUC60>2.5 correlated with vp (R2 = 0.6245, P < .0005; and R2 = 0.4727, P = .003) but not with Ktrans or ve. In grade IV tumors, both EnFIAUC60>0 and EnFIAUC60>2.5 correlated with Ktrans (R2 = 0.3501, P = .001; and R2 = 0.4699, P < .0005) and vp (R2 = 0.1564, P = .01; and R2 = 0.2429, P = .007), but not with ve. Multiple regression analysis showed Ktrans as the only independent correlate of both EnFIAUC60>0 and EnFIAUC60>2.5 for grade IV tumors.

CONCLUSIONS: This study suggests that in grade II tumors, EnF reflects vp and varies due to changes in vascular density. In grade IV gliomas, EnF is affected by Ktrans with secondary associated changes in vp.

Abbreviations

AIF
arterial input function
DCE-CT
dynamic contrast-enhanced CT
DCE-MR
dynamic contrast-enhanced MR imaging
EnF
enhancing fraction
EnFIAUC60>0
unthresholded enhancing fraction
EnFIAUC60>2.5
thresholded enhancing fraction
IAUC
initial area under the concentration curve
IAUC60
initial area under the concentration curve during the first 60 seconds
Ktrans
contrast-transfer coefficient
rCBV
relative cerebral blood volume
ve
extravascular extracellular space volume per unit volume of tissue
VEGF
vascular endothelial growth factor
VOI
volume of interest
vp
blood plasma volume per unit volume of tissue
WHO
World Health Organization

DCE-MR imaging allows characterization of the vascular microenvironment in tumors by measurement of a range of parameters that reflect specific physiologic characteristics. One of the simplest measures is the IAUC during a given time, usually 60 seconds (IAUC60).1 While IAUC is simple to calculate and has been shown to be a reliable and reproducible parameter,2 it has no physiologic specificity. More complex postprocessing analysis uses pharmacokinetic modeling to measure Ktrans (reflecting both flow and permeability), ve, vp, and rCBV.3 These complex measures have greater physiologic specificity and relate predictably to various aspects of tumor biology. In gliomas, measures of blood volume, both rCBV and vp, have demonstrated excellent discrimination of tumor grade,4–14 subtype,15 and genotype16,17; and Ktrans also discriminates grade.13,18–20 Both blood volume and Ktrans have been identified as prognostic indicators of survival in glioma,21–25 but unlike blood volume, the relationship between Ktrans and patient survival is independent of its relationship with histologic grade.23

Recent investigators studying solid masses of the abdomen have proposed a simple measure of bulk tumor perfusion from DCE-MR imaging, the EnF or perfused proportion,26,27 which is the ratio of enhancing to total tumor volume. A CT variant of this measure has shown promise in differentiating stable from progressive disease and in predicting time to progression following first-line chemotherapy in ovarian cancer.28 Measurements of IAUC can be used to reproducibly stratify voxels as enhancing or nonenhancing for a definition of the EnF. Because the IAUC is a continuous variable, the distinction between enhancing and nonenhancing can be defined by the presence of enhancement (IAUC > 0 mmol.s) or by use of a threshold value to define a minimal acceptable level of enhancement. In a previous study, we have demonstrated that EnF defined at a threshold of IAUC60 > 2.5 mmol.s provides optimal discrimination between low- and high-grade gliomas.29

The value of EnF in an individual tumor will be affected by a number of variations in the tumor vascular microenvironment. Areas of necrosis or nonperfusion will clearly fail to enhance, but enhancement may also not occur in viable tumor if perfusion pressure and perfusion rates are low relative to the vascular half-life of the contrast media. The specific aim of this study was to investigate the effects of variations in DCE-MR imaging parameters, Ktrans, ve, and vp, on measured EnF in glioma.

Materials and Methods

Patients

The local research ethics committee approved the study, and all patients gave informed consent before recruitment. Patients were identified via the neuro-oncology multidisciplinary team meetings at Salford Royal National Health Service Foundation Trust. All imaging was performed before surgery. All tumors were histologically confirmed as gliomas and graded according to the WHO classification criteria.30 All patients with grade IV tumors received corticosteroid treatment for a minimum of 48 hours before imaging. None received any other form of treatment at the time of imaging or before surgery. Findings in this group of patients describing the differences in EnF between low- and high-grade tumors have been reported previously.29

Data Acquisition

Imaging was performed at the University of Manchester Magnetic Resonance Imaging Facility (Hope Hospital, Salford, United Kingdom) by using a sensitivity encoding head coil on a 3T Achieva system (Philips Medical Systems, Best, the Netherlands). DCE-MR imaging was acquired in a sagittal oblique orientation to incorporate the internal carotid artery for measurement of an AIF. Four precontrast T1 fast-field echo (radio-frequency–spoiled gradient-echo) sequences (α = 2°, 5°, 10°, and 16°) were acquired in the same geometry for calculation of baseline T1 maps (TR, 3.5 ms; TE, 1.1 ms; section thickness, 4.2 mm; 128 × 128; FOV, 230 × 230 × 105 mm). This was followed by a dynamic contrast-enhanced acquisition series (TR, 3.5 ms; TE, 1.1 ms; flip angle, 16°; section thickness, 4.2 mm; 128 × 128; FOV, 230 × 230 × 105 mm), consisting of 100 volumes with temporal spacing of approximately 3.4 seconds. Gadolinium-based contrast agent (Gd-DTPA-BMA; Omniscan, GE Healthcare, Oslo, Norway) was injected as a bolus dose of 0.1 mmol/kg−1 of body weight, at a rate of 3 mL/s−1, after acquisition of the fifth image volume. Pre- and postcontrast T1-weighted imaging sequences (TR, 9.3 ms; TE, 4.6 ms) were acquired in the same sagittal oblique geometry for definition of the VOI of the whole tumor.

Data Analysis

An experienced radiologist (S.J.M.) manually defined VOIs for each tumor on the postcontrast T1 geometrically matched sequences, drawing around signal intensity abnormality/contrast enhancement by using a technique that has previously shown good interobserver agreement (intraclass correlation coefficient, >0.94),31 before histologic diagnosis was confirmed. Postprocessing analysis was performed by using in-house software (Manchester Dynamic Modeling) and the extended Tofts and Kermode pharmacokinetic model.3 Automated AIFs were generated from an appropriately chosen section that included the internal carotid artery.32 Parametric maps of Ktrans, vp, ve, and IAUC60 were produced.

For each tumor, EnFIAUC60>0 was calculated by dividing the enhancing volume (volume of voxels with an IAUC60>0 mmol.s) by the total volume of the VOI. EnFIAUC60>2.5 was calculated by using a previously identified optimal threshold of IAUC60 (>2.5 mmol.s), above which voxels were considered to be enhancing. This optimized threshold was defined on an initial dataset of 5 grade II and 10 grade IV gliomas to identify the optimum IAUC60 threshold for distinguishing histologic grade.29

Statistical Analysis

All statistical analyses were performed by using SPSS, Version 15.0 (SPSS, Chicago, Illinois). Data were not normally distributed; therefore, nonparametric analyses were performed. Tumors were grouped according to grade (II, III, and IV), and grade II tumors were further separated according to histologic subtype (astrocytomas and tumors with an oligodendroglial component). For each tumor grade and histologic subtype of the grade II tumors, scatterplots of median values of the DCE-MR imaging parameters versus EnFIAUC60>0 and EnFIAUC60>2.5 were generated. Comparison between individual DCE-MR imaging parameters and both EnFIAUC60>0 and EnFIAUC60>2.5 was performed by using a bivariate Spearman rank correlation analysis for grade II and IV tumors and the 2 histologic subgroups of grade II tumors; there were insufficient numbers in the grade III group to perform this analysis. On finding significant correlations, all parameters were entered into a multiple linear regression analysis by using a forward entry model, with an entry criterion of P < .05 to evaluate any cross-correlation between parameters.

Results

We recruited 42 patients: 18 women and 24 men, with a mean age of 49 ± 16 years (range, 19–77 years). There were a total of 43 tumors, because 1 patient had bilateral grade II tumors, each of distinct histologic subtype (astrocytoma and oligodendroglioma). The 16 grade II tumors included 6 astrocytomas (4 diagnosed by biopsy and 2 by surgical debulking), 3 oligoastrocytomas (all surgically debulked), and 7 oligodendrogliomas (1 biopsied and 6 surgically debulked). The 3 grade III tumors were all diagnosed by surgical debulking and included 2 anaplastic astrocytomas and 1 anaplastic oligodendroglioma. The 24 grade IV gliomas included 23 glioblastoma multiformes (9 biopsied and 14 surgically debulked) and 1 gliosarcoma (surgically debulked). All 10 of the oligodendrogliomas/oligoastrocytomas in this study exhibited loss of heterozygosity of 1p/19q.

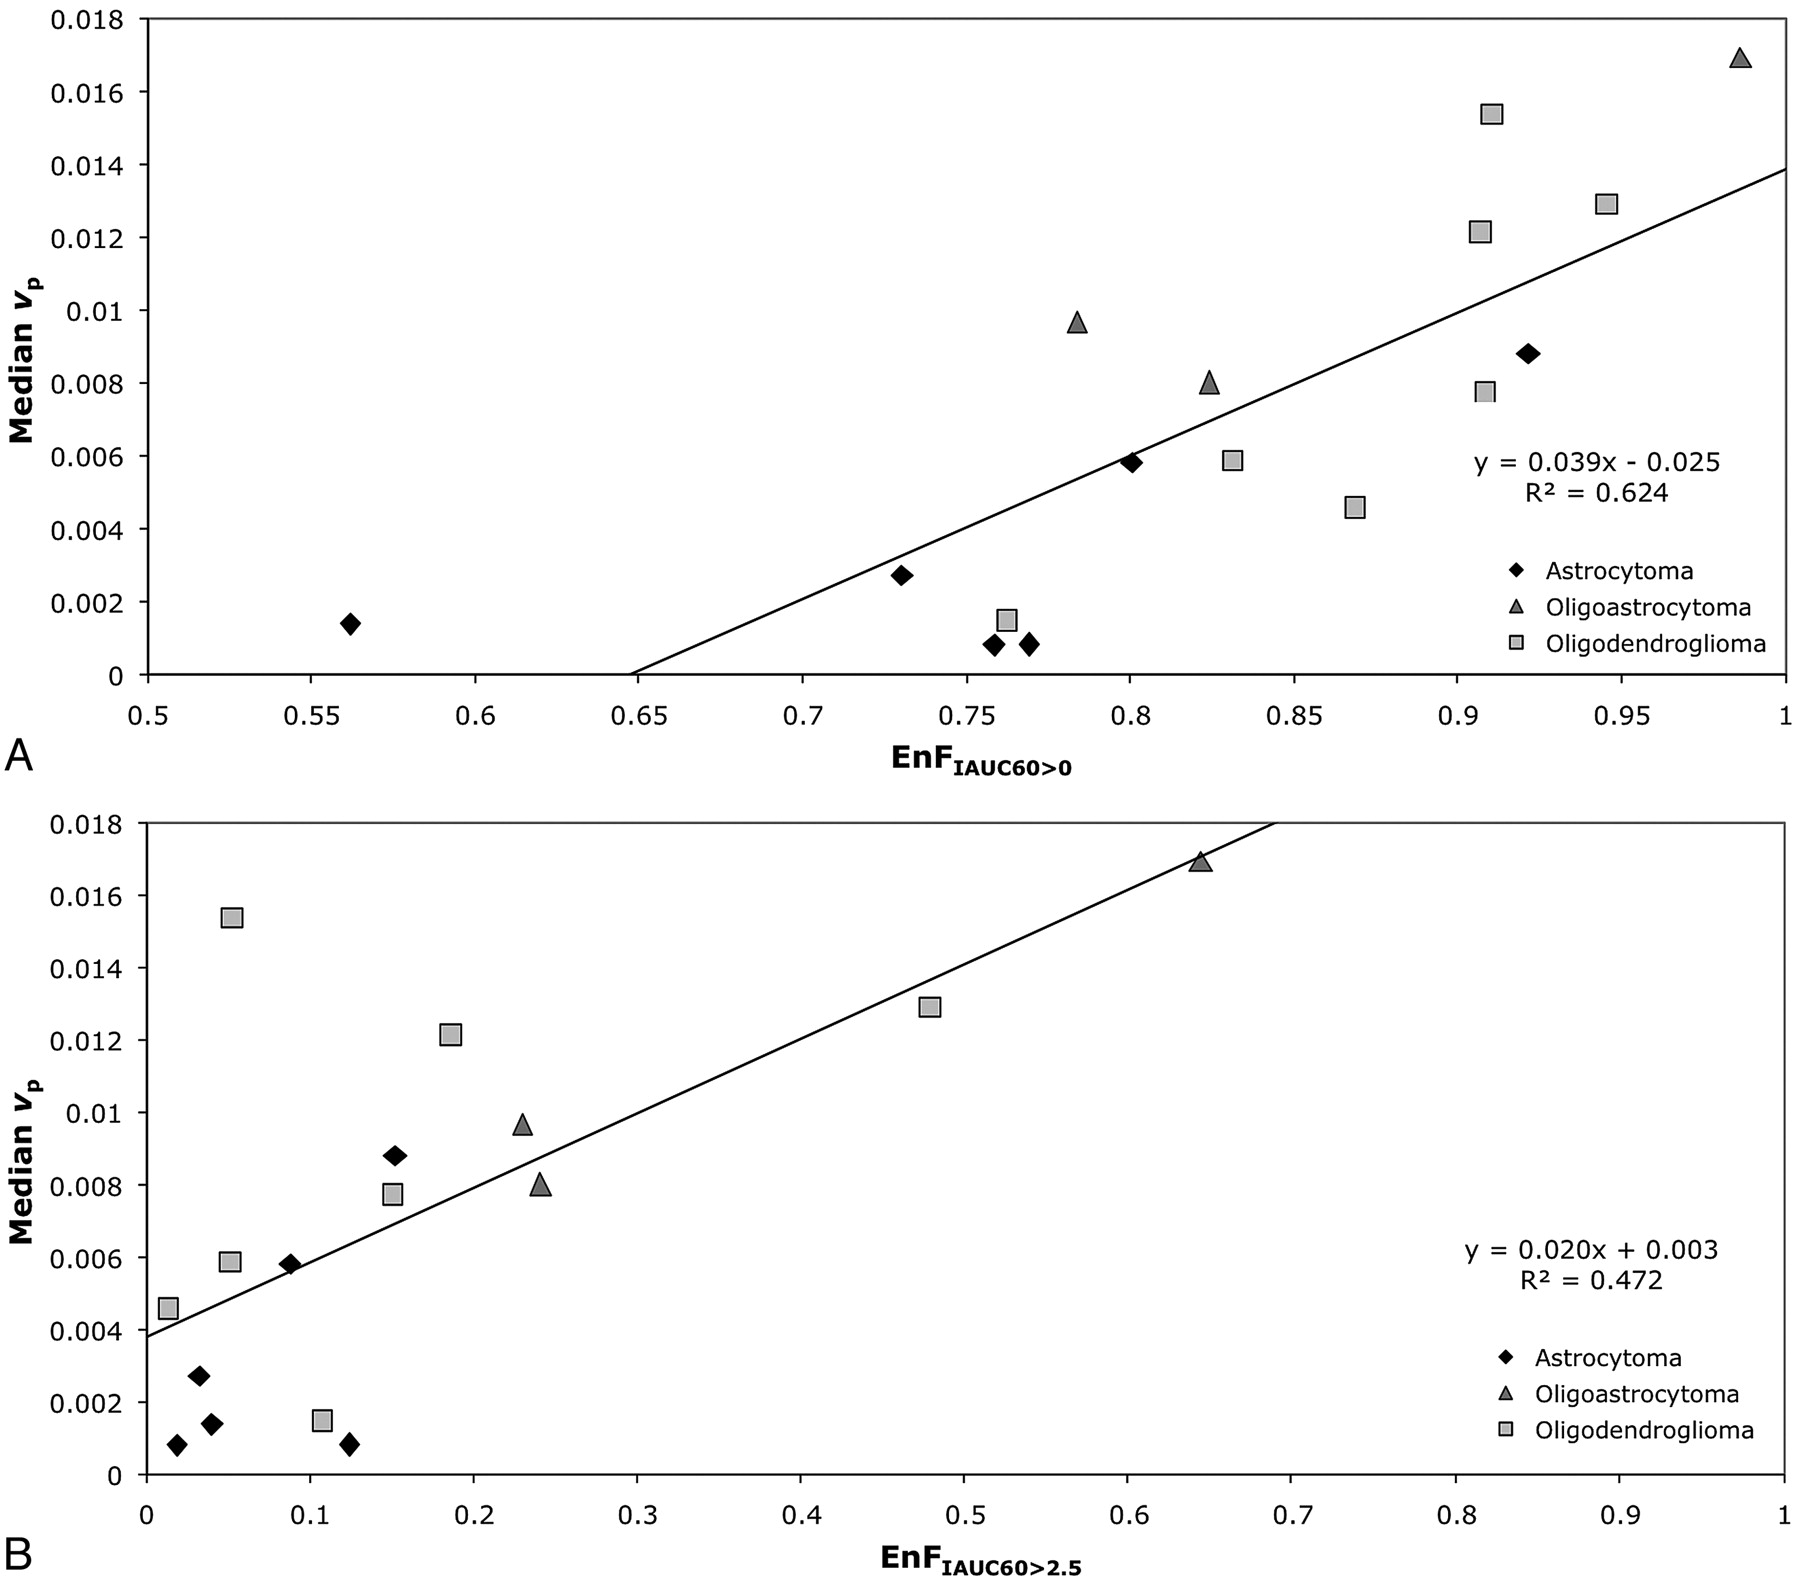
In the group of grade II tumors, EnFIAUC60>0 correlated with vp (P < .0005; Spearman rho correlation coefficient = 0.838; R2 = 0.6245; Table 1 and Fig 1A), but not with Ktrans (P = .926) or ve (P = .213). Similarly, there was a significant correlation between EnFIAUC60>2.5 and vp (P = .003; Spearman rho correlation coefficient = 0.697; R2 = 0.4727; Table 1 and Fig 1B), but not with Ktrans (P = .996) or ve (P = .721).

View this table:
  • View inline
  • View popup
Table 1:

Correlation matrix for all parameters in the grade II glioma group and Spearman ρ correlation coefficients for cross-correlations between parameters (with significance levels)

Fig 1.
  • Download figure
  • Open in new tab
  • Download powerpoint
Fig 1.

Scatter diagrams of EnF measures and vp in grade II gliomas. A, EnFIAUC60>0 versus median vp. B, EnFIAUC60>2.5 versus median vp. The black diamond indicates astrocytoma; the medium gray triangle, oligoastrocytoma; and the light gray square, oligodendroglioma.

In the subgroup of grade II astrocytomas, neither EnFIAUC60>0 or EnFIAUC60>2.5 correlated with vp (P = .266 and P = .208), Ktrans (P = .329 and P = .329), or ve (P = .486 and P = .329). In the subgroup of grade II tumors with an oligodendroglial component, vp correlated with both EnFIAUC60>0 and EnFIAUC60>2.5 (P = .013; Spearman rho correlation coefficient = 0.745; R2 = 0.604 and P = .048; Spearman rho correlation coefficient = 0.636; R2 = 0.397), but not with Ktrans (P = .440 and P = .483) or ve (P = .777 and P = .603).

In grade IV tumors, EnFIAUC60>0 correlated with both Ktrans (P = .001; Spearman rho correlation coefficient = 0.633; R2 = 0.3501; Table 2 and Fig 2A) and vp (P = .01; Spearman rho correlation coefficent = 0.514; R2 = 0.1564; Table 2 and Fig 3A), but not with ve (P = .654). Again, similar relationships were seen between EnFIAUC60>2.5 and Ktrans (P < .0005; Spearman rho correlation coefficient = 0.770; R2 = 0.4699; Table 2 and Fig 2B), vp (P = .007; Spearman rho correlation coefficient = 0.537; R2 = 0.2429; Table 2 and Fig 3B), and ve (P = .154). Multiple linear regression analysis demonstrated Ktrans as the only significant independent correlate of both EnFIAUC60>0 (P = .002 and R2 = 0.592) and EnFIAUC60>2.5 (P = .0002 and R2 = 0.686). Cross-correlation was found between Ktrans and vp (P = .014; Spearman rho correlation coefficient = 0.496; R2 = 0.4618; Table 2 and Fig 4). The addition of vp did not significantly influence the multiple linear regression model.

View this table:
  • View inline
  • View popup
Table 2:

Correlation matrix for all parameters in the grade IV glioma group and Spearman ρ correlation coefficients for cross-correlation between parameters (with significance levels)

Fig 2.
  • Download figure
  • Open in new tab
  • Download powerpoint
Fig 2.

Scatter diagrams of EnF measures and Ktrans in grade IV gliomas. A, EnFIAUC60>0 versus median Ktrans. B, EnFIAUC60>2.5 versus median Ktrans.

Fig 3.
  • Download figure
  • Open in new tab
  • Download powerpoint
Fig 3.

Scatter diagrams of EnF measures and vp in grade IV gliomas. A, EnFIAUC60>0 versus median vp. B, EnFIAUC60>2.5 versus median vp.

Fig 4.
  • Download figure
  • Open in new tab
  • Download powerpoint
Fig 4.

Scatter diagram of median Ktrans versus median vp in grade IV gliomas.

Discussion

This study examined the relationship between EnF and characteristics of the tumoral vascular microenvironment defined by the model-based parameters Ktrans, vp, and ve. EnF is based on the IAUC and has advantages in that it is relatively simple to perform, is unlikely to be influenced significantly by variations in scanner and sequence type, and does not rely on complex postprocessing pharmacokinetic modeling techniques.1,3,33 Thus, it is more suitable for use within the clinical setting and for multicenter studies because it is less reliant on the technical expertise required for more complex analysis processes.

Although EnF uses IAUC to classify pixels as enhancing or nonenhancing, it is a distinct metric with important differences from the widely used vascular biomarkers derived from DCE-MR imaging and DCE-CT. EnF will be affected by a wider range of physiologic processes. These include those that influence local IAUC in enhancing tissue and physiologic conditions that prevent perfusion or enhancement. The volume of necrotic and of viable but inadequately perfused tissue directly contributes to the measurement. EnF will, therefore, be influenced by regional arterial-venous pressure differences and tumor interstitial pressure. In a study of ovarian and colorectal cancer treated with CDP860, a selective platelet-derived growth factor inhibitor known to cause primary decreases in tumor interstitial pressure, increases in EnF occurred rapidly after administration of the drug,26 though model-based parameters, including IAUC, Ktrans, ve, and vp showed no change.

Cerebral tumors develop in a unique physiologic environment in which increases in tumor volume directly affect the pressure of the compartment in which they develop. Consequently, changes in interstitial pressure, which is equivalent to intracranial pressure, directly reflect the volume and growth rate of the tumor and its components. Hence, a rapidly growing glioma may be expected to develop an interstitial pressure that exceeds perfusion pressures in the tumor core, which will consequently fail to enhance. This process will result in significant hypoperfusion and hypoxia in the central parts of the tumor. These effects will, in turn, result in release of angiogenic cytokines, particularly VEGF. Glioblastomas produce higher levels of VEGF than any other tumor, which has led to recent trials of antiangiogenic therapy, which have been associated with increased survival.34,35 Thus, EnF may provide novel information regarding both tumor development and therapeutic response to novel agents.

In this study, we have attempted to increase our understanding of the behavior of EnF as a putative biomarker for glioma by examining the relationship between EnF and conventional biomarkers of enhancing tumor tissue. This work confirms that EnF, both thresholded and unthresholded, may be of value as a biomarker in glioma. At presentation, it could provide a simple, robust, and model-free alternative to parameters derived from pharmacokinetic analysis of DCE-MR imaging data. The manner in which EnF relates to the DCE-MR imaging parameters depends on the features of the vascular microenvironment. In low-grade tumors, vessel permeability is low and the blood-brain barrier is essentially intact; therefore, contrast remains mostly within the vascular space and EnF correlates with vp (Fig 1). Conversely, in high-grade tumors, there is high blood flow and local disruption of the blood-brain barrier with marked leakage of contrast into the extravascular extracellular space. In this group of tumors, both Ktrans, which reflects flow and capillary permeability, and vp correlate with EnF (Figs 2 and 3). However, multiple regression analysis shows that vp is a covariate of Ktrans (Fig 4). No correlation between EnF and ve was found for either grade II or grade IV tumors.

In high-grade tumors, Ktrans has been shown to predict prognosis independent of cerebral blood volume measurements.23 At the time of analysis, survival data were not available for this group of patients; therefore, the relationship between EnF and patient outcome cannot be reported. However, if this prognostic relationship does hold for EnF, then the technique may provide a potentially important prognostic marker.

The main limitations with this study were the small numbers and failure to separate the grade II and III tumors according to histologic subtype. Only 3 patients had grade III gliomas (2 anaplastic astrocytomas and 1 anaplastic oligodendroglioma), making it difficult to assess how the measures of enhancement of grade III tumors behave compared with those of grade II and IV tumors. Although there were insufficient numbers for formal analysis, there was a tendency for the measures of EnF of the grade III tumors to lie among the values for grade II tumors. This poor separation of the grade III tumors from grade II tumors may reflect the histologic subtype of the grade II glioma group (predominantly oligodendrogliomas and oligoastrocytomas) or the small number of anaplastic tumors. The failure of the subanalysis of the grade II pure astrocytomas to demonstrate any correlation between vp and either EnFIAUC60>0 or EnFIAUC60>2.5 most likely reflects the small number within this cohort (n = 6).

Conclusions

EnF is a simple, model-free, and robust metric that does not require the complex pharmacokinetic modeling necessary for calculation of vp and Ktrans. It is a distinct entity and influenced by a wide range of physiologic processes. However, EnF correlates with vp in grade II glioma and Ktrans in grade IV glioma; and given the relationships of Ktrans and vp to prognosis, tumor subtype, and genotype in glioma, measures of EnF have the potential to be an important adjunctive biomarker.

Footnotes

  • This research was funded by a research training bursary from Cancer Research UK, ref: C21247/A6840. S.J. Mills is funded by a Cancer Research UK Clinicians Training Fellowship, ref: C21247/A7473; J.P.B. O'Connor is funded by a Cancer Research UK Clinicians Training Fellowship, ref: C19221/A6086; G. Buonaccorsi is funded by a Cancer Research UK Program Grant, ref: C237/A6295; and C.J. Rose is funded by GlaxoSmithKline.

Indicates open access to non-subscribers at www.ajnr.org

References

  1. 1.↵
    1. Evelhoch JL
    . Key factors in the acquisition of contrast kinetic data for oncology. J Magn Reson Imaging 1999; 10: 254–59
    CrossRefPubMed
  2. 2.↵
    1. Roberts C,
    2. Issa B,
    3. Stone A,
    4. et al
    . Comparative study into the robustness of compartmental modeling and model-free analysis in DCE-MRI studies. J Magn Reson Imaging 2006; 23: 554–63
    CrossRefPubMed
  3. 3.↵
    1. Tofts PS
    . Modeling tracer kinetics in dynamic Gd-DTPA MR imaging. J Magn Reson Imaging 1997; 7: 91–101
    CrossRefPubMed
  4. 4.↵
    1. Aronen HJ,
    2. Gazit IE,
    3. Louis DN,
    4. et al
    . Cerebral blood volume maps of gliomas: comparison with tumor grade and histologic findings. Radiology 1994; 191: 41–51
    PubMed
  5. 5.↵
    1. Aronen HJ,
    2. Glass J,
    3. Pardo FS,
    4. et al
    . Echo-planar MR cerebral blood volume mapping of gliomas: clinical utility. Acta Radiol 1995; 36: 520–28
    Abstract/FREE Full Text
  6. 6.↵
    1. Aronen HJ,
    2. Pardo FS,
    3. Kennedy DN,
    4. et al
    . High microvascular blood volume is associated with high glucose uptake and tumor angiogenesis in human gliomas. Clin Cancer Res 2000; 6: 2189–200
    Abstract/FREE Full Text
  7. 7.↵
    1. Knopp EA,
    2. Cha S,
    3. Johnson G,
    4. et al
    . Glial neoplasms: dynamic contrast-enhanced T2*-weighted MR imaging. Radiology 1999; 211: 791–98
    CrossRefPubMed
  8. 8.↵
    1. Lam WW,
    2. Chan KW,
    3. Wong WL,
    4. et al
    . Pre-operative grading of intracranial glioma. Acta Radiol 2001; 42: 548–54
    FREE Full Text
  9. 9.↵
    1. Law M,
    2. Yang S,
    3. Babb JS,
    4. et al
    . Comparison of cerebral blood volume and vascular permeability from dynamic susceptibility contrast-enhanced perfusion MR imaging with glioma grade. AJNR Am J Neuroradiol 2004; 25: 746–55
    Abstract/FREE Full Text
  10. 10.↵
    1. Law M,
    2. Yang S,
    3. Wang H,
    4. et al
    . Glioma grading: sensitivity, specificity, and predictive values of perfusion MR imaging and proton MR spectroscopic imaging compared with conventional MR imaging. AJNR Am J Neuroradiol 2003; 24: 1989–98
    Abstract/FREE Full Text
  11. 11.↵
    1. Lev MH,
    2. Ozsunar Y,
    3. Henson JW,
    4. et al
    . Glial tumor grading and outcome prediction using dynamic spin-echo MR susceptibility mapping compared with conventional contrast-enhanced MR: confounding effect of elevated rCBV of oligodendrogliomas [corrected]. AJNR Am J Neuroradiol 2004; 25: 214–21
    Abstract/FREE Full Text
  12. 12.↵
    1. Sadeghi N,
    2. Salmon I,
    3. Decaestecker C,
    4. et al
    . Stereotactic comparison among cerebral blood volume, methionine uptake, and histopathology in brain glioma. AJNR Am J Neuroradiol 2007; 28: 455–61
    Abstract/FREE Full Text
  13. 13.↵
    1. Patankar TF,
    2. Haroon HA,
    3. Mills SJ,
    4. et al
    . Is volume transfer coefficient (K(trans)) related to histologic grade in human gliomas? AJNR Am J Neuroradiol 2005; 26: 2455–65
    Abstract/FREE Full Text
  14. 14.↵
    1. Ludemann L,
    2. Grieger W,
    3. Wurm R,
    4. et al
    . Quantitative measurement of leakage volume and permeability in gliomas, meningiomas and brain metastases with dynamic contrast-enhanced MRI. Magn Reson Imaging 2005; 23: 833–41
    CrossRefPubMed
  15. 15.↵
    1. Cha S,
    2. Tihan T,
    3. Crawford F,
    4. et al
    . Differentiation of low-grade oligodendrogliomas from low-grade astrocytomas by using quantitative blood-volume measurements derived from dynamic susceptibility contrast-enhanced MR imaging. AJNR Am J Neuroradiol 2005; 26: 266–73
    Abstract/FREE Full Text
  16. 16.↵
    1. Law M,
    2. Brodsky JE,
    3. Babb J,
    4. et al
    . High cerebral blood volume in human gliomas predicts deletion of chromosome 1p: preliminary results of molecular studies in gliomas with elevated perfusion. J Magn Reson Imaging 2007; 25: 1113–19
    CrossRefPubMed
  17. 17.↵
    1. Jenkinson MD,
    2. Smith TS,
    3. Joyce KA,
    4. et al
    . Cerebral blood volume, genotype and chemosensitivity in oligodendroglial tumours. Neuroradiology 2006; 48: 703–13. Epub 2006 Aug 26
    CrossRefPubMed
  18. 18.↵
    1. Cha S,
    2. Yang L,
    3. Johnson G,
    4. et al
    . Comparison of microvascular permeability measurements, K(trans), determined with conventional steady-state T1-weighted and first-pass T2*-weighted MR imaging methods in gliomas and meningiomas. AJNR Am J Neuroradiol 2006; 27: 409–17
    Abstract/FREE Full Text
  19. 19.↵
    1. Provenzale JM,
    2. Wang GR,
    3. Brenner T,
    4. et al
    . Comparison of permeability in high-grade and low-grade brain tumors using dynamic susceptibility contrast MR imaging. AJR Am J Roentgenol 2002; 178: 711–16
    CrossRefPubMed
  20. 20.↵
    1. Roberts HC,
    2. Roberts TP,
    3. Brasch RC,
    4. et al
    . Quantitative measurement of microvascular permeability in human brain tumors achieved using dynamic contrast-enhanced MR imaging: correlation with histologic grade. AJNR Am J Neuroradiol 2000; 21: 891–99
    Abstract/FREE Full Text
  21. 21.↵
    1. Cao Y,
    2. Tsien CI,
    3. Nagesh V,
    4. et al
    . Survival prediction in high-grade gliomas by MRI perfusion before and during early stage of RT [corrected]. Int J Radiat Oncol Biol Phys 2006; 64: 876–85
    CrossRefPubMed
  22. 22.↵
    1. Law M,
    2. Oh S,
    3. Johnson G,
    4. et al
    . Perfusion magnetic resonance imaging predicts patient outcome as an adjunct to histopathology: a second reference standard in the surgical and nonsurgical treatment of low-grade gliomas. Neurosurgery 2006; 58: 1099–107
    CrossRefPubMed
  23. 23.↵
    1. Mills SJ,
    2. Patankar TA,
    3. Haroon HA,
    4. et al
    . Do cerebral blood volume and contrast transfer coefficient predict prognosis in human glioma? AJNR Am J Neuroradiol 2006; 27: 853–58
    Abstract/FREE Full Text
  24. 24.↵
    1. Law M,
    2. Oh S,
    3. Babb JS,
    4. et al
    . Low-grade gliomas: dynamic susceptibility-weighted contrast-enhanced perfusion MR imaging—prediction of patient clinical response. Radiology 2006; 238: 658–67
    CrossRefPubMed
  25. 25.↵
    1. Law M,
    2. Young RJ,
    3. Babb JS,
    4. et al
    . Gliomas: predicting time to progression or survival with cerebral blood volume measurements at dynamic susceptibility-weighted contrast-enhanced perfusion MR imaging. Radiology 2008; 247: 490–98
    CrossRefPubMed
  26. 26.↵
    1. Jayson GC,
    2. Parker GJ,
    3. Mullamitha S,
    4. et al
    . Blockade of platelet-derived growth factor receptor-beta by CDP860, a humanized, PEGylated di-Fab′, leads to fluid accumulation and is associated with increased tumor vascularized volume. J Clin Oncol 2005; 23: 973–81. Epub 2004 Oct 4
    Abstract/FREE Full Text
  27. 27.↵
    1. Mullamitha SA,
    2. Ton NC,
    3. Parker GJ,
    4. et al
    . Phase I evaluation of a fully human anti-alphav integrin monoclonal antibody (CNTO 95) in patients with advanced solid tumors. Clin Cancer Res 2007; 13: 2128–35
    Abstract/FREE Full Text
  28. 28.↵
    1. O'Connor JP,
    2. Jayson GC,
    3. Jackson A,
    4. et al
    . Enhancing fraction predicts clinical outcome following first-line chemotherapy in patients with epithelial ovarian carcinoma. Clin Cancer Res 2007; 13: 6130–35
    Abstract/FREE Full Text
  29. 29.↵
    1. Mills SJ,
    2. Soh C,
    3. O'Connor JP,
    4. et al
    . Tumour enhancing fraction (EnF) in glioma: relationship to tumour grade. Eur Radiol 2009; 19: 1489–98
    CrossRefPubMed
  30. 30.↵
    1. Louis DN,
    2. Ohgaki H,
    3. Wiestler OD,
    4. et al
    . The 2007 WHO classification of tumours of the central nervous system. Acta Neuropathol 2007; 114: 97–109. Epub 2007 Jul 6
    CrossRefPubMed
  31. 31.↵
    1. Thompson G,
    2. Cain J,
    3. Jackson A,
    4. et al
    . Interobserver agreement for cerebral glioma volumetrics on conventional MR imaging. In: Proceedings of the 16th Annual Scientific Meeting and Exhibition of the International Society of Magnetic Resonance in Medicine, Toronto, Ontario, Canada. May 3–9, 2008
  32. 32.↵
    1. Parker GJM,
    2. Jackson A,
    3. Waterton JC,
    4. et al
    . Automated arterial input function extraction for T1-weighted DCE-MRI. In: Proceedings of the 11th Annual Scientific Meeting and Exhibition of the International Society of Magnetic Resonance in Medicine, Toronto, Ontario, Canada. July 10–16, 2003
  33. 33.↵
    1. Parker GJM,
    2. Buckley DL
    . Tracer Kinetic Modelling for T1-Weighted DCE-MRI. Berlin: Springer-Verlag; 2005: 81–92
  34. 34.↵
    1. Norden AD,
    2. Young GS,
    3. Setayesh K,
    4. et al
    . Bevacizumab for recurrent malignant gliomas: efficacy, toxicity, and patterns of recurrence. Neurology 2008; 70: 779–87
    CrossRef
  35. 35.↵
    1. Sathornsumetee S,
    2. Reardon DA,
    3. Desjardins A,
    4. et al
    . Molecularly targeted therapy for malignant glioma. Cancer 2007; 110: 13–24
    CrossRefPubMed
  • Received June 18, 2009.
  • Accepted after revision August 22, 2009.
  • Copyright © American Society of Neuroradiology
View Abstract
PreviousNext
Back to top

In this issue

American Journal of Neuroradiology: 31 (4)
American Journal of Neuroradiology
Vol. 31, Issue 4
1 Apr 2010
  • Table of Contents
  • Index by author
Advertisement
Print
Download PDF
Email Article

Thank you for your interest in spreading the word on American Journal of Neuroradiology.

NOTE: We only request your email address so that the person you are recommending the page to knows that you wanted them to see it, and that it is not junk mail. We do not capture any email address.

Enter multiple addresses on separate lines or separate them with commas.
Enhancing Fraction in Glioma and Its Relationship to the Tumoral Vascular Microenvironment: A Dynamic Contrast-Enhanced MR Imaging Study
(Your Name) has sent you a message from American Journal of Neuroradiology
(Your Name) thought you would like to see the American Journal of Neuroradiology web site.
CAPTCHA
This question is for testing whether or not you are a human visitor and to prevent automated spam submissions.
Cite this article
S.J. Mills, C. Soh, J.P.B. O'Connor, C.J. Rose, G. Buonaccorsi, S. Cheung, S. Zhao, G.J.M. Parker, A. Jackson
Enhancing Fraction in Glioma and Its Relationship to the Tumoral Vascular Microenvironment: A Dynamic Contrast-Enhanced MR Imaging Study
American Journal of Neuroradiology Apr 2010, 31 (4) 726-731; DOI: 10.3174/ajnr.A1925

Citation Manager Formats

  • BibTeX
  • Bookends
  • EasyBib
  • EndNote (tagged)
  • EndNote 8 (xml)
  • Medlars
  • Mendeley
  • Papers
  • RefWorks Tagged
  • Ref Manager
  • RIS
  • Zotero
0 Responses
Respond to this article
Share
Bookmark this article
Enhancing Fraction in Glioma and Its Relationship to the Tumoral Vascular Microenvironment: A Dynamic Contrast-Enhanced MR Imaging Study
S.J. Mills, C. Soh, J.P.B. O'Connor, C.J. Rose, G. Buonaccorsi, S. Cheung, S. Zhao, G.J.M. Parker, A. Jackson
American Journal of Neuroradiology Apr 2010, 31 (4) 726-731; DOI: 10.3174/ajnr.A1925
del.icio.us logo Twitter logo Facebook logo Mendeley logo
  • Tweet Widget
  • Facebook Like
  • Google Plus One
Purchase

Jump to section

  • Article
    • Abstract
    • Abbreviations
    • Materials and Methods
    • Results
    • Discussion
    • Conclusions
    • Footnotes
    • References
  • Figures & Data
  • Info & Metrics
  • Responses
  • References
  • PDF

Related Articles

  • No related articles found.
  • PubMed
  • Google Scholar

Cited By...

  • Postcontrast T1 Mapping for Differential Diagnosis of Recurrence and Radionecrosis after Gamma Knife Radiosurgery for Brain Metastasis
  • Glioma: Application of Histogram Analysis of Pharmacokinetic Parameters from T1-Weighted Dynamic Contrast-Enhanced MR Imaging to Tumor Grading
  • Crossref (24)
  • Google Scholar

This article has been cited by the following articles in journals that are participating in Crossref Cited-by Linking.

  • Quantifying heterogeneity in human tumours using MRI and PET
    Marie-Claude Asselin, James P.B. O’Connor, Ronald Boellaard, Neil A. Thacker, Alan Jackson
    European Journal of Cancer 2012 48 4
  • Distinguishing Recurrent High-grade Gliomas from Radiation Injury
    Sotirios Bisdas, Thomas Naegele, Rainer Ritz, Artemisia Dimostheni, Christina Pfannenberg, Matthias Reimold, Tong San Koh, Ulrike Ernemann
    Academic Radiology 2011 18 5
  • Differentiating treatment-induced necrosis from recurrent/progressive brain tumor using nonmodel-based semiquantitative indices derived from dynamic contrast-enhanced T1-weighted MR perfusion
    J. Narang, R. Jain, A. S. Arbab, T. Mikkelsen, L. Scarpace, M. L. Rosenblum, D. Hearshen, A. Babajani-Feremi
    Neuro-Oncology 2011 13 9
  • Evaluation of dynamic contrast-enhanced T1-weighted perfusion MRI in the differentiation of tumor recurrence from radiation necrosis
    Vibeke A. Larsen, Helle J. Simonsen, Ian Law, Henrik B. W. Larsson, Adam E. Hansen
    Neuroradiology 2013 55 3
  • Measurements of tumor vascular leakiness using DCE in brain tumors: clinical applications
    Rajan Jain
    NMR in Biomedicine 2013 26 8
  • Glioma: Application of Histogram Analysis of Pharmacokinetic Parameters from T1-Weighted Dynamic Contrast-Enhanced MR Imaging to Tumor Grading
    S. C. Jung, J. A. Yeom, J.- H. Kim, I. Ryoo, S. C. Kim, H. Shin, A. L. Lee, T. J. Yun, C.- K. Park, C.- H. Sohn, S.- H. Park, S. H. Choi
    American Journal of Neuroradiology 2014 35 6
  • Assessment of therapeutic response and treatment planning for brain tumors using metabolic and physiological MRI
    Sarah J. Nelson
    NMR in Biomedicine 2011 24 6
  • Delayed contrast extravasation MRI: a new paradigm in neuro-oncology
    Leor Zach, David Guez, David Last, Dianne Daniels, Yuval Grober, Ouzi Nissim, Chen Hoffmann, Dvora Nass, Alisa Talianski, Roberto Spiegelmann, Galia Tsarfaty, Sharona Salomon, Moshe Hadani, Andrew Kanner, Deborah T. Blumenthal, Felix Bukstein, Michal Yalon, Jacob Zauberman, Jonathan Roth, Yigal Shoshan, Evgeniya Fridman, Marc Wygoda, Dror Limon, Tzahala Tzuk, Zvi R. Cohen, Yael Mardor
    Neuro-Oncology 2015 17 3
  • Glioma Grading Capability: Comparisons among Parameters from Dynamic Contrast-Enhanced MRI and ADC Value on DWI
    Hyun Seok Choi, Ah Hyun Kim, Sung Soo Ahn, Na-young Shin, Jinna Kim, Seung-Koo Lee
    Korean Journal of Radiology 2013 14 3
  • A review of technical aspects of T1-weighted dynamic contrast-enhanced magnetic resonance imaging (DCE-MRI) in human brain tumors
    M. Bergamino, L. Bonzano, F. Levrero, G.L. Mancardi, L. Roccatagliata
    Physica Medica 2014 30 6

More in this TOC Section

  • White Matter Alterations in the Brains of Patients with Active, Remitted, and Cured Cushing Syndrome: A DTI Study
  • Qualitative and Quantitative Analysis of MR Imaging Findings in Patients with Middle Cerebral Artery Stroke Implanted with Mesenchymal Stem Cells
  • Fast Contrast-Enhanced 4D MRA and 4D Flow MRI Using Constrained Reconstruction (HYPRFlow): Potential Applications for Brain Arteriovenous Malformations
Show more BRAIN

Similar Articles

Advertisement

Indexed Content

  • Current Issue
  • Accepted Manuscripts
  • Article Preview
  • Past Issues
  • Editorials
  • Editor's Choice
  • Fellows' Journal Club
  • Letters to the Editor
  • Video Articles

Cases

  • Case Collection
  • Archive - Case of the Week
  • Archive - Case of the Month
  • Archive - Classic Case

Special Collections

  • AJNR Awards
  • ASNR Foundation Special Collection
  • Most Impactful AJNR Articles
  • Photon-Counting CT
  • Spinal CSF Leak Articles (Jan 2020-June 2024)

More from AJNR

  • Trainee Corner
  • Imaging Protocols
  • MRI Safety Corner

Multimedia

  • AJNR Podcasts
  • AJNR Scantastics

Resources

  • Turnaround Time
  • Submit a Manuscript
  • Submit a Video Article
  • Submit an eLetter to the Editor/Response
  • Manuscript Submission Guidelines
  • Statistical Tips
  • Fast Publishing of Accepted Manuscripts
  • Graphical Abstract Preparation
  • Imaging Protocol Submission
  • Evidence-Based Medicine Level Guide
  • Publishing Checklists
  • Author Policies
  • Become a Reviewer/Academy of Reviewers
  • News and Updates

About Us

  • About AJNR
  • Editorial Board
  • Editorial Board Alumni
  • Alerts
  • Permissions
  • Not an AJNR Subscriber? Join Now
  • Advertise with Us
  • Librarian Resources
  • Feedback
  • Terms and Conditions
  • AJNR Editorial Board Alumni

American Society of Neuroradiology

  • Not an ASNR Member? Join Now

© 2025 by the American Society of Neuroradiology All rights, including for text and data mining, AI training, and similar technologies, are reserved.
Print ISSN: 0195-6108 Online ISSN: 1936-959X

Powered by HighWire