
Abstract
SUMMARY: Recent pathologic and MR imaging studies have challenged the classic view of MS as a chronic inflammatory-demyelinating condition affecting solely the WM of the central nervous system. Indeed, an involvement of the GM has been shown to occur from the early stages of the disease, to progress with time, and to be only moderately correlated with the extent of WM injury. In this review, we summarize how advances in MR imaging technology and methods of analysis are contributing to ameliorating the detection of focal lesions and to quantifying the extent of “occult” pathology and atrophy, as well as to defining the topographic distribution of such changes in the GM of patients with MS. These advances, combined with the imaging of brain reorganization occurring after tissue injury, should ultimately result in an improved understanding and monitoring of MS clinical manifestations and evolution, either natural or modified by treatment.
Abbreviations
- Cereb
- cerebellum
- Cho
- choline
- CIS
- clinically isolated syndromes
- DIR
- double inversion recovery
- DTI
- diffusion tensor imaging
- EDSS
- Expanded Disability Status Scale
- FA
- fractional anisotropy
- FLAIR
- fluid-attenuated inversion recovery
- fMRI
- functional MR imaging
- GM
- gray matter
- L
- left
- MD
- mean diffusivity
- MS
- multiple sclerosis
- MT
- magnetization transfer
- MTR
- magnetization transfer ratio
- NAA
- N-acetylaspartate
- NAWM
- normal-appearing white matter
- PM
- premotor cortex
- PPMS
- primary-progressive MS
- R
- right
- RRMS
- relapsing-remitting MS
- RT
- relaxation time
- SII
- secondary sensorimotor cortex
- SMA
- supplementary motor area
- SMC
- sensorimotor cortex
- SPM
- statistical parametric mapping
- SPMS
- secondary-progressive MS
- Thal
- thalamus
- WM
- white matter
Pathologic and MR imaging studies are challenging the view of MS as a chronic inflammatory-demyelinating condition affecting solely the WM of the central nervous system. Indeed, there is a growing body of evidence showing that a significant portion of MS-related damage affects virtually all the GM structures. Pathologically, cortical lesions have been distinguished in mixed WM-GM lesions (type I) and purely intracortical lesions (types II, III, and IV).1 The latter may represent more than two-thirds of macroscopic cortical pathology in the disease,1 and the extent of cortical demyelination can exceed that occurring in the WM.1 Demyelination is seen not only in the neocortex (especially in the cingulate cortex)1,2 but also in the GM of the thalamus, basal ganglia, hypothalamus, hippocampus, cerebellum, and spinal cord.2 Compared with WM lesions, GM lesions are characterized by a much milder lymphocytic infiltration, less microglial activation, and fewer perivascular cuffs.3 GM lesions also lack complement deposition and have only a modest increase in blood-brain barrier permeability.2 In MS, GM pathology also includes neuronal injury, with neuritic swelling as well as dendritic and axonal transections.2 In addition to focal lesions, wallerian and trans-synaptic degeneration of fibers passing through diseased WM areas can cause GM damage in MS.2
Consistent with pathologic observations, recent MR imaging studies have shown a marked involvement of the GM in MS in terms of focal lesions, “diffuse” tissue abnormalities, and irreversible tissue loss (ie, atrophy). These studies have also shown that GM injury affects the cerebral cortex, brain deep nuclei, and cerebellum and spinal cord; is present from the earliest clinical stages of the disease; accumulates with time; and is, at least partially, independent of the WM damage. In addition, the application of fMRI holds significant promise for improving our understanding of the role of GM changes in MS pathophysiology.4
This review summarizes the main results obtained from the use of conventional and quantitative MR imaging−based techniques for the assessment of GM pathology and dysfunction in patients with MS. The implications of such findings in ameliorating the monitoring of the efficacy of new experimental treatment will also be discussed.
Imaging GM Lesions
Despite its high sensitivity in detecting MS abnormalities,5 conventional T2-weighted MR imaging is unable to depict the burden of GM lesions because these lesions are typically small, have poor contrast with the surrounding normal GM, and, in case of cortical lesions, have partial volume effects from the CSF. Fast FLAIR and gadolinium-enhanced T1-weighted sequences were the first used to increase the amount of GM lesion detection in MS.6,7
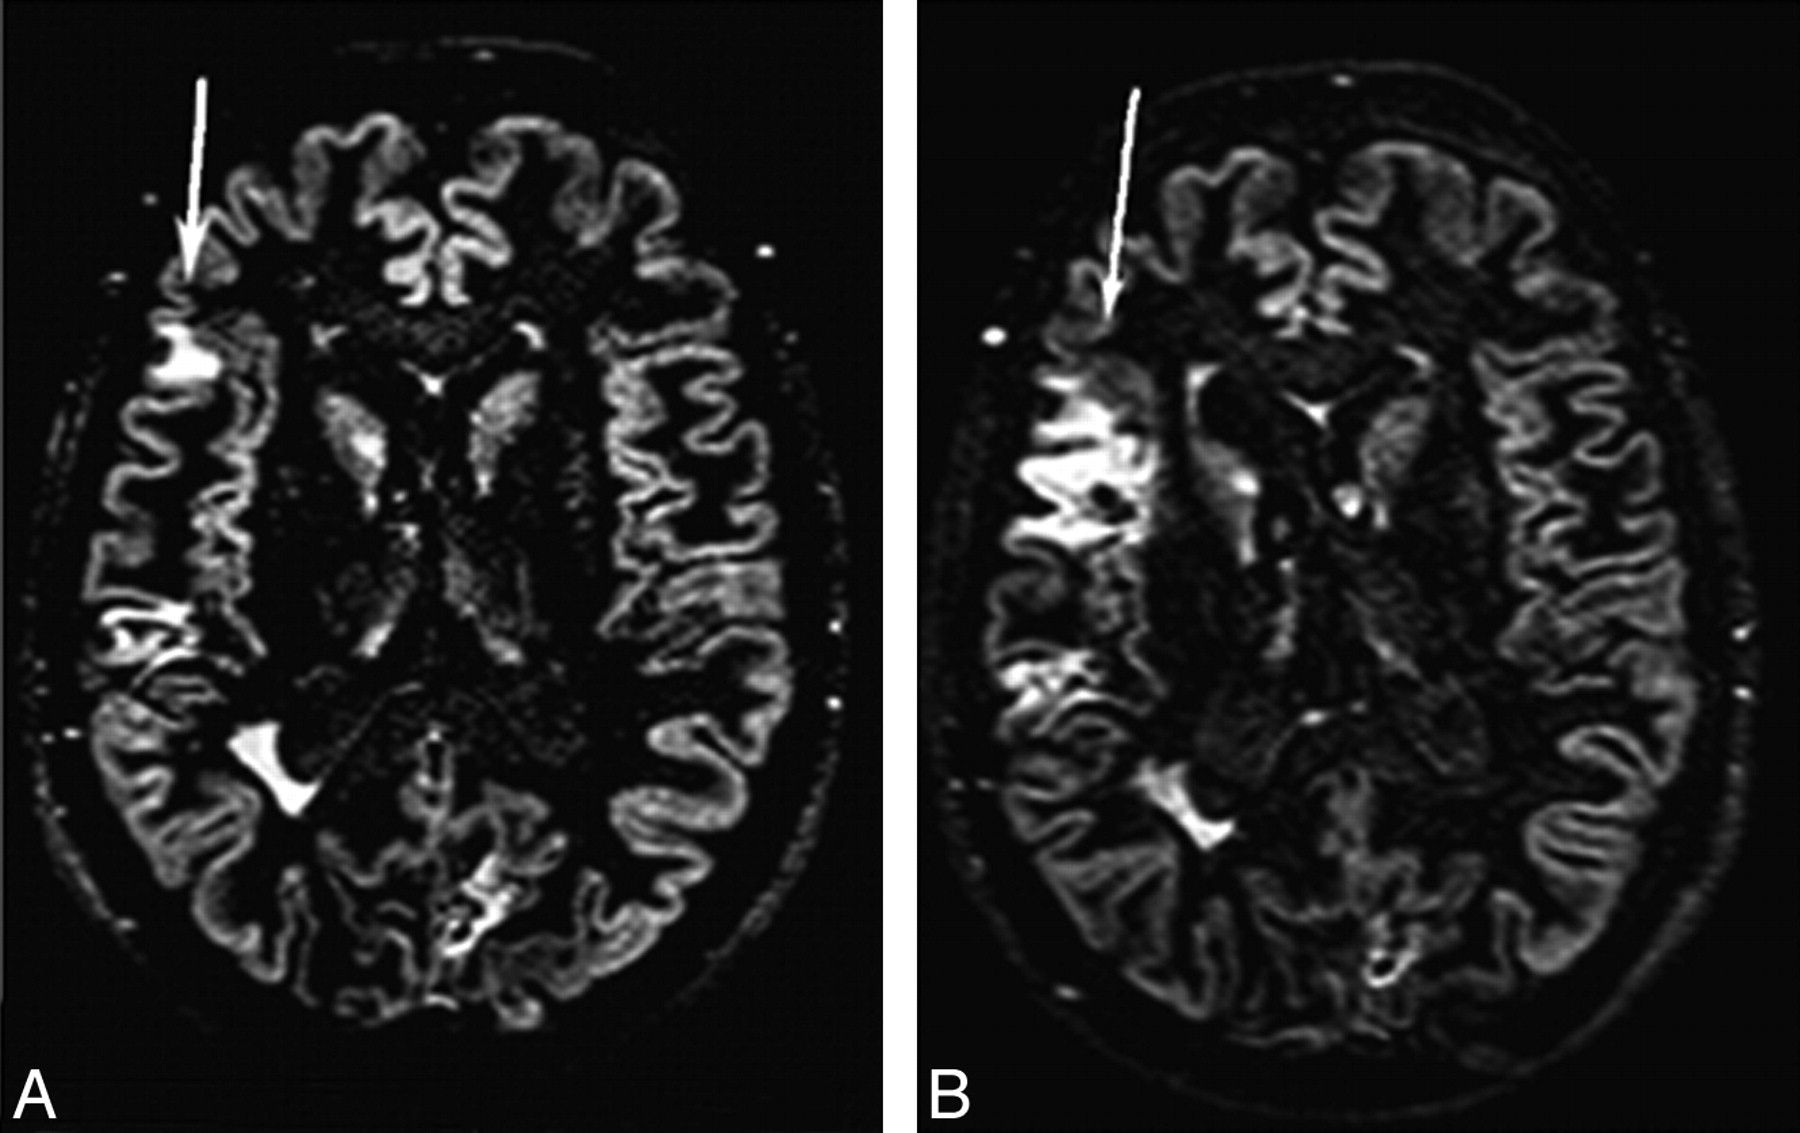
More recently, DIR sequences have been developed and used to improve further the sensitivity of MR imaging in detecting such lesions.8 DIR imaging depicted more intracortical lesions than standard MR imaging techniques, with gains of 538% and 152% compared with conventional T2-weighted and FLAIR sequences.8 The increased contrast between lesions and their surroundings resulted in an improved distinction between juxtacortical and mixed WM-GM lesions.8 With DIR sequences, intracortical lesions have been detected in all the major MS clinical phenotypes, including in patients with CIS suggestive of MS.9–11 The number of such lesions was found to be higher in patients with SPMS than in those with CIS or RRMS,9 indicating that the lesions tend to accumulate with time, as was also confirmed by a few longitudinal studies (Fig 1).10–12 Despite this finding, most of the cortical lesions still cannot be visualized with DIR imaging. Indeed, on average, DIR imaging allows classifying as intracortical only 4.6% of the overall number of GM lesions,9 in contrast to a figure of 59% reported by pathologic studies.1,2
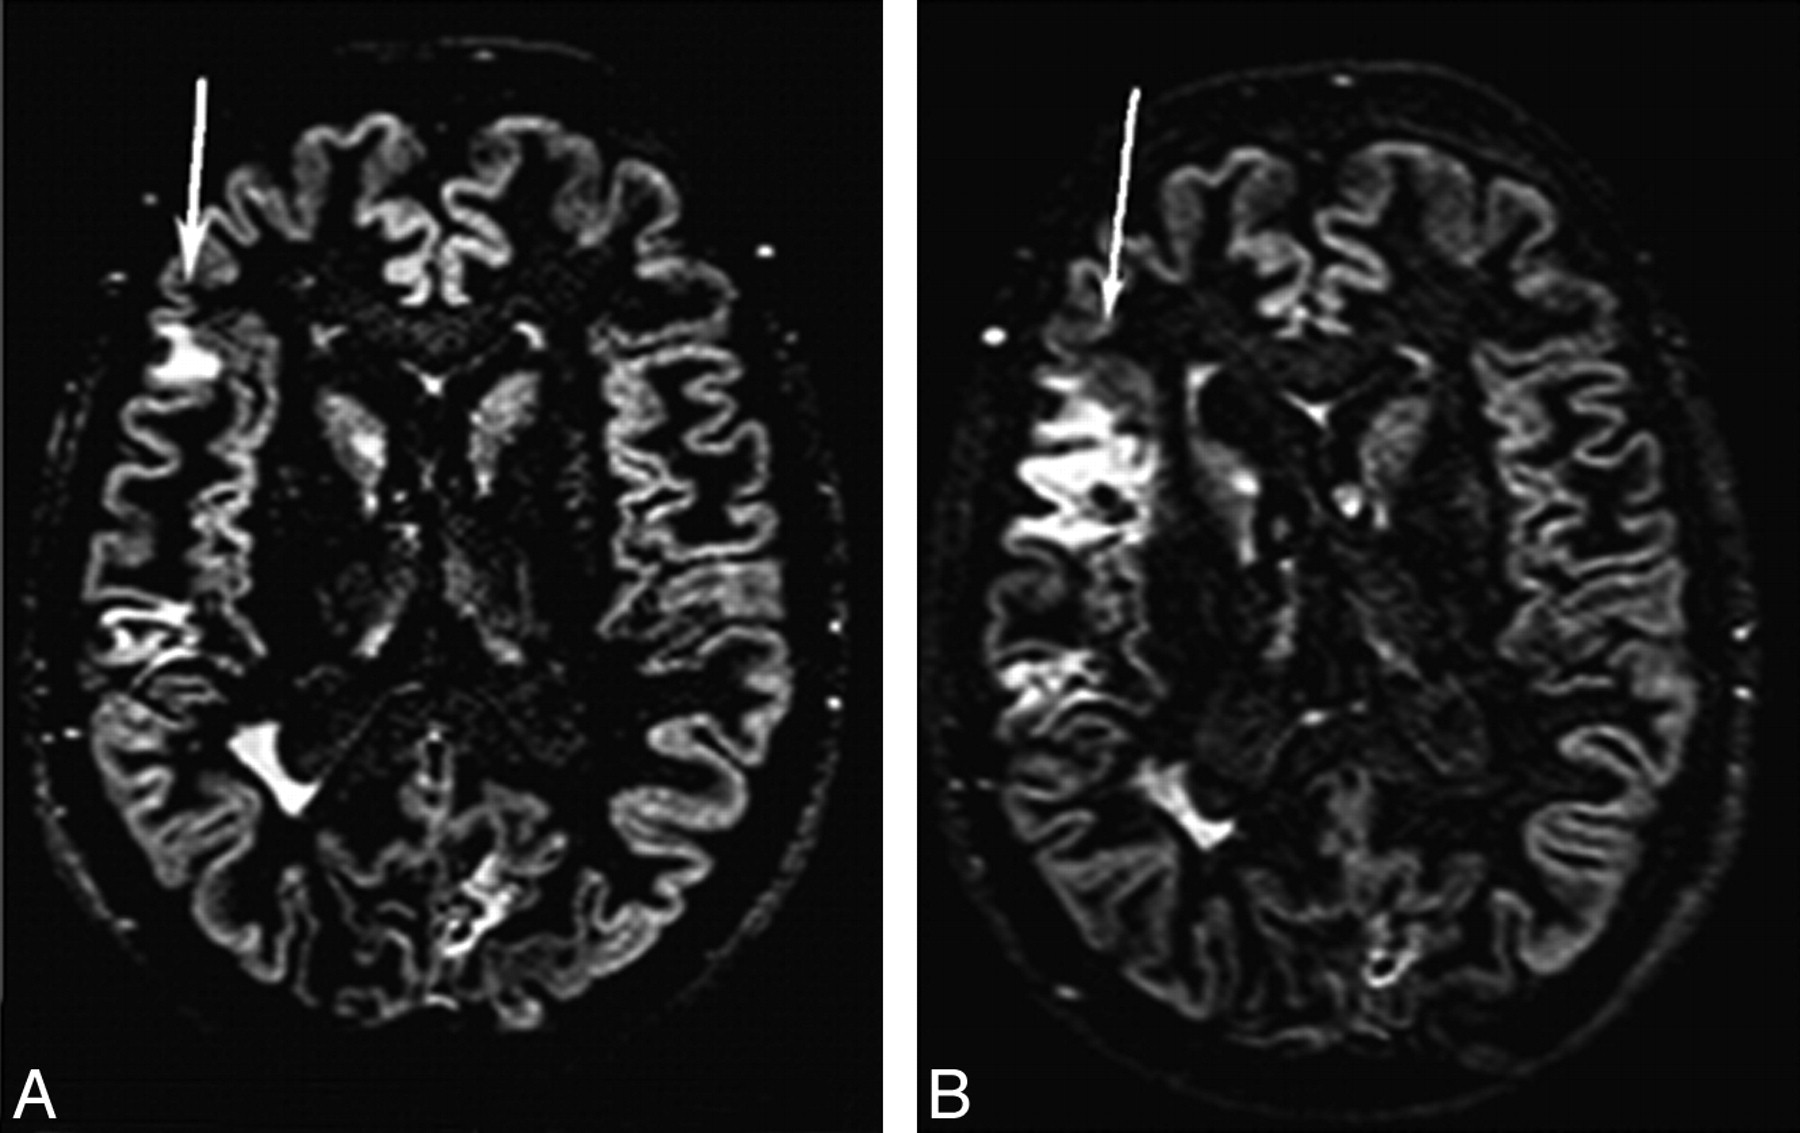
Brain axial DIR images from a patient with RRMS at baseline (A) and after 6 months (B). Multiple cortical lesions are visible. The size of 1 cortical lesion in the right parietal lobe (arrows) is increased after 6 months. Reprinted from Neuroimage, 42, Calabrese M et al, Morphology and evolution of cortical lesions in multiple sclerosis: a longitudinal MRI study, 1324–28, 2008, with permission from Elsevier.
As a consequence, new strategies have been proposed to improve the detection and allow a reliable classification of cortical MS lesions, including the use of a single-slab 3D DIR sequence13 and the combination of DIR with other MR imaging, such as phase-sensitive inversion recovery14 and 3D magnetization-prepared rapid acquisition with gradient echo imaging.15 An additional gain in GM lesion detection is likely to be achieved due to the increased availability of high-field MR imaging scanners. Kangarlu et al16 showed that cortical lesions invisible on MR imaging at 1.5T are clearly seen at 8T. Using a 7T scanner, Mainero et al17 identified, in 16 patients with MS, 199 cortical lesions with patterns of distribution resembling those described histopathologically.
Cortical lesion burden was found to be higher in patients with MS and epilepsy compared with those without,18 the increase of cortical lesion number with time is lower in patients with benign MS than in those with RRMS,11 and accumulation of cortical lesions with time is associated with worsening of clinical disability in PPMS10 and cognitive impairment in patients with relapsing-onset MS.19
Although lesional involvement of the deep nuclei of patients with MS has not been studied as extensively as that of the cerebral cortex, T2-hyperintense lesions in the basal ganglia have been detected in 25% of patients with MS.20 More recently, hippocampal lesions have been visualized on 3D DIR images.21
Imaging GM Damage Beyond Focal Lesions
Other aspects of MS-related GM involvement have to be considered, including “diffuse” tissue changes, irreversible tissue loss, topography of damage location, and the presence and efficiency of mechanisms of cortical reorganization following injury.
Imaging “Diffuse” GM Damage
Diffuse GM damage in MS may be due to the presence of focal lesions beyond the resolution of available MR imaging technology, degenerative phenomena secondary to local discrete areas of demyelination, and retrograde and trans-synaptic degeneration of fibers passing through WM plaques. Quantitative MR imaging−based techniques provide accurate estimates of “overall” GM abnormalities. This includes not only diffuse changes but also focal lesions, and as a consequence, future studies are warranted to disentangle the relative contributions of each of these pathologic aspects.
MT MR Imaging.
MT MR imaging allows the calculation of an index, the MTR, which, when reduced, indicates a diminished capacity of the protons bound to the brain tissue matrix to exchange magnetization with the surrounding “free” water, thus providing an estimate of the extent of MS tissue disruption.22 Several studies have demonstrated reduced MTR values in the brain GM in patients with different MS phenotypes,22 including those at the earliest clinical stages of the disease.22 GM MTR abnormalities were correlated with disease duration and are more pronounced in patients with PPMS or SPMS than in those with other clinical phenotypes.22 GM MTR changes correlate with clinical disability22–24 and cognitive impairment.25 In patients with relapsing-onset MS, GM MTR was an independent predictor of the accumulation of disability during the subsequent 8 years.26 In patients with PPMS, GM MTR decline reflected the rate of clinical deterioration during 3 years.27
DTI.
DTI enables the random diffusional motion of water molecules to be measured, thus providing metrics, such as MD and FA, which allow quantification of the size and geometry of water-filled spaces.28 DTI confirmed the presence of GM damage in MS28 and showed that the extent of such damage differs among the various disease phenotypes, being more severe in patients with SPMS.28 An increased diffusivity in the thalami of patients with MS has also been found, which was again more pronounced in patients with SPMS than in those with RRMS. Longitudinal DTI studies28 have demonstrated a worsening of GM damage with time in patients with RRMS, SPMS, and PPMS.28 A moderate correlation between GM MD and the degree of cognitive impairment has been detected in mildly disabled patients with RRMS.29 GM diffusivity was also found to predict accumulation of disability during a 5-year period in patients with PPMS.30
Proton MR Spectroscopy.
Proton MR spectroscopy (1H-MR spectroscopy) can define several chemical correlates of the pathologic changes occurring in the brain.31 Several studies have found metabolite abnormalities, including reduced concentrations of NAA and Cho, and increased concentrations of myo-inositol in the cortical31 and subcortical GM tissue32–34 of patients with MS. These were shown to occur even in early RRMS and in patients with CIS suggestive of MS.31 Such findings disagree, at least partially, with the results of other studies,35,36 in which significant decreases of Cho, creatine, and NAA concentrations were found in the GM of patients with the progressive forms of the disease, but not in those with RRMS. NAA reduction has also been demonstrated in the thalamus of patients with SPMS and RRMS 32,33 and in the cerebral cortex of patients with PPMS.37 A reduced concentration of glutamate/glutamine in the cortex of patients with PPMS has also been detected, which was correlated with the EDSS score.37
T1- and T2-Based Measures.
T1- and T2-based measures allow quantification of microscopic damage to the GM beyond the resolution of conventional imaging.38 Increased thalamic T1 RTs were related to the severity of fatigue in patients with RRMS.39 Iron deposition, a possible sign of neurodegeneration, was thought to be the substrate of T2 hypointense GM areas and reduced T2 RTs seen in the basal ganglia, thalamus, dentate nucleus, and cortical regions of most MS clinical phenotypes.38 GM T2 hypointensity correlates with the severity of clinical disability and cognitive impairment in patients with MS.38
Imaging GM Atrophy
High-resolution MR images and automated segmentation techniques have allowed the achievement of an accurate quantification of GM tissue volume and improvement of our understanding of the dynamics of GM tissue loss in MS.
Patients with CIS who developed MS during the subsequent 3 years had significant GM loss.40 A significant reduction with time of the GM fraction has also been observed in patients with early RRMS.41 A longitudinal study of 117 patients with RRMS42 found a decrease of GM volumes on monthly scans during 9 months, whereas WM volumes remained relatively stable. A similar trend of GM tissue loss was detected in patients with early PPMS during 1 year.43 In a large-scale study of 597 patients with MS, significantly reduced WM and GM fractions were found in all phenotypes; the most severe tissue loss was detected in SPMS.44
GM atrophy is associated with MS clinical disability.44 In a longitudinal study, Chen et al45 showed an increased rate of cortical tissue loss in patients with progressing disability in comparison with those with stable disease. Fisher et al46 compared atrophy rates for 4 years across the main MS clinical phenotypes and found that GM atrophy rate increases with disease stage, from 3.4-fold normal in patients with CIS converting to RRMS to 14-fold normal in those with SPMS. Neocortical volume loss was found to occur in patients with RRMS with even mild cognitive disturbances.47,48
Imaging the Topographic Distribution of GM Damage
Several strategies have been used to characterize the distribution of abnormalities in the different GM structures, including voxel-wise approaches or region-of-interest analysis to determine GM damage to specific structures, such as the basal ganglia and the spinal cord.
With voxel-based morphometry, patterns of regional distribution of GM loss have been identified in all the major MS clinical phenotypes. In patients with CIS, GM atrophy involves the thalamus, hypothalamus, putamen, and caudate nucleus.49 Cortical atrophy in patients with RRMS affects preferentially the frontotemporal lobes,50,51 and GM volume reduction in these regions during 1 year is correlated with WM lesion progression.51 Ceccarelli et al52 showed that GM tissue damage follows different patterns of regional distribution according to the clinical phenotype of the disease (Fig 2), is likely secondary to the presence and location of focal WM lesions, and is more evident in the progressive forms of the disease. In patients with early PPMS, atrophy involves the thalami in an early phase and extends to other deep and infratentorial GM areas after 1 year.53 Pediatric patients with MS experience GM atrophy in the thalamus only.54

SPM regions with decreased GM concentration, overlaid on a high-resolution T1-weighted image, contrasting patients with different MS phenotypes. A and B, SPM regions with GM loss in patients with SPMS compared with those with RRMS. C and D, SPM regions with GM loss in patients with SPMS compared with those with PPMS. Reprinted from Neuroimage, 42, Ceccarelli A et al, A voxel-based morphometry study of grey matter loss in MS patients with different clinical phenotypes, 315–22, 2008, with permission from Elsevier.
The evaluation of the regional patterns of GM involvement has undoubtedly improved the correlation with disease clinical manifestations. In patients with CIS, voxel-wise correlations with clinical measures showed that cerebellar volume is associated with the severity of cerebellar function impairment and the Multiple Sclerosis Functional Composite score.49 In patients with RRMS, reduction of GM volume of regions associated with working memory and executive function performance is correlated with cognitive task performance.55 In patients with RRMS and SPMS, temporal lobe atrophy is associated with auditory/verbal memory and visual/spatial memory performance,56 while hippocampal atrophy is related to a poor performance in memory-encoding tasks.57 Fatigued patients with MS experience GM atrophy in frontal regions,58 while those with cerebellar dysfunction have a reduced cerebellar GM volume compared with those without.59 In patients with MS with longstanding disease or severe disability, focal thinning of the primary SMC has been reported.60 Compared with controls, patients with benign MS have a reduced GM volume in the subcortical and frontoparietal regions, and in comparison with patients with benign MS, those with SPMS have a significant cerebellar GM loss.61
Voxel-based analysis may also represent a valid option for the analysis of MT MR imaging and DTI data. With this approach, MTR decrease in the basal ganglia was found in patients with early MS.62 On the other hand, in a region-of-interest-based study63 that assessed thalamic MTR in patients with early RRMS, no significant difference was observed at baseline between patients and controls. After 1 and 2 years, however, the mean thalamic MTR worsened significantly in patients.63 Patients with CIS with optic neuritis had decreased MTR in the occipital cortices.64
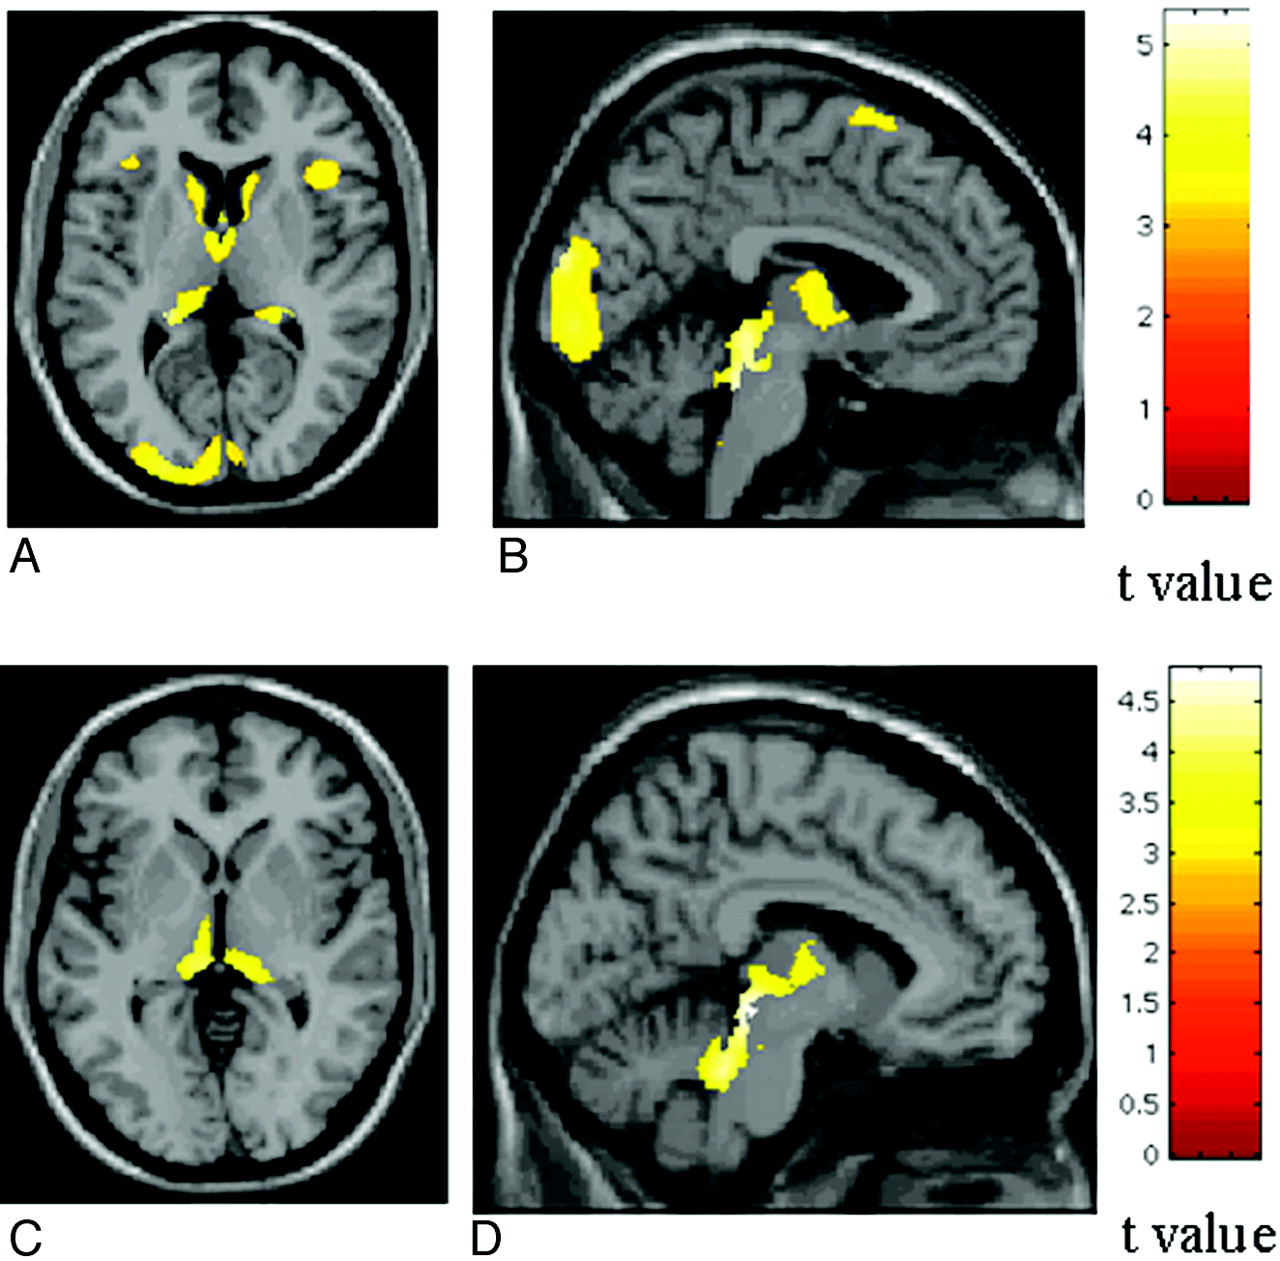
With a voxel-based approach, a significant correlation was found in PPMS between a regional decrease of MTR values of cortical areas of the motor network and the EDSS scores as well as between MTR values in cortical areas of the cognitive network and the Paced Auditory Serial Addition Test scores.65 Ceccarelli et al66 showed DTI abnormalities in brain areas associated with motor and cognitive functions in PPMS (Fig 3). Bodini et al67 found 11 brain regions with an anatomic correspondence between reduced NAWM FA values and GM atrophy in patients with early PPMS.

SPM regions with anatomic correspondence between GM atrophy (blue) and GM mean diffusivity (red) changes in patients with PPMS compared with controls. A and B, An overlap is visible in the thalami. Reprinted with permission from Ceccarelli et al, 2009.66
1H-MR spectroscopy studies have reported a reduction of NAA in the cervical cord of patients with MS.68 Patients with RRMS have a lower cervical cord GM average MTR compared with controls.69 Most interesting, GM average MTR of the cervical cord was correlated with the degree of disability.69
Cortical Reorganization
Studies with fMRI and different paradigms have consistently demonstrated functional cortical changes in all MS phenotypes, suggesting that there might be a “natural history” of the functional reorganization of the cerebral cortex in patients with MS.4 Such a notion is supported by the results of a cross-sectional study of the motor network in patients with different disease clinical phenotypes,70 which showed, at the beginning of the disease, an increased recruitment of those areas “normally” devoted to the performance of a given task, such as the SMC and the SMA. At a later stage, bilateral activation of these regions was first seen, followed by a widespread recruitment of additional areas, which are usually recruited in healthy individuals to perform novel/complex tasks.
Several moderate-to-strong correlations have been demonstrated between the activity of cortical and subcortical areas of different cerebral networks and the extent of brain T2-visible lesions and the severity of their intrinsic damage.4 In addition, movement- and cognitive-associated fMRI changes were found to be correlated with the amount of NAWM, GM, and cervical cord injury.4 Although the role of cortical reorganization on the clinical manifestations of MS remains to be established, such correlations suggest that an increased recruitment of “critical” cortical networks might contribute to limiting the functional impact of MS-related damage. This hypothesis is supported by the results of a longitudinal study that assessed cortical changes following acute motor relapses secondary to pseudotumoral lesions in 12 patients with MS.71 Short-term cortical changes were characterized by the recruitment of pathways in the unaffected hemisphere. A recovery of function of the primary SMC of the affected hemisphere was found in patients with good clinical improvement, while patients without or only a poor clinical recovery showed a persistent recruitment of the primary SMC of the unaffected hemisphere.
An increased cortical activation might not always be beneficial for patients with MS. In PPMS, the lack or exhaustion of the classic adaptive mechanisms might be among the factors responsible for an unfavorable clinical evolution.72 In patients with cognitive decline,73 a “reallocation” of neuronal resources and the inefficiency of neuronal processes have been described. Finally, in patients with RRMS, an increased recruitment of several areas of the motor network, including the thalamus and the cingulum, has been described when patients complained of fatigue after weekly interferon β-1a administration.74
Monitoring Treatment Efficacy
MR imaging quantities are applied as surrogate outcome measures in treatment trials of MS because they are noninvasive, have high sensitivity toward disease activity, and are very reliable.75 Despite the fact that lesion activity and burden on postcontrast T1-weighted and dual-echo scans are the most commonly used measures to monitor treatment efficacy in MS trials, a recent pivotal study found a significant effect of pioglitazone in slowing GM atrophy accumulation during 1 year in patients with RRMS.76
DIR sequences have not yet been tested in the setting of clinical trials of MS, perhaps because they still need to be validated and standardized across different centers. On the other hand, several MS trials have incorporated MT MR imaging quantities as additional outcome measures. Two multicenter studies used MT MR imaging to determine GM damage in CIS77 and in patients with PPMS.24 In both studies, GM MTR-derived measures showed a significant intercenter heterogeneity. After correcting for the acquisition center, the researchers found pooled GM average MTR values to be different between patient groups and controls.
One study used 1H-MR spectroscopy to assess the efficacy of glatiramer acetate in patients with PPMS.78 At 3-year follow-up,79 no significant difference in metabolite ratios between treated and placebo patients was found in lesions, NAWM, and GM.
Only recently has the potential of fMRI in prospective multicenter studies been studied in an international collaborative effort.80 Compared with controls, patients with MS had more significant activations bilaterally in several regions of the sensorimotor network and abnormalities of effective connectivity (Fig 4) during the performance of a simple motor task.81
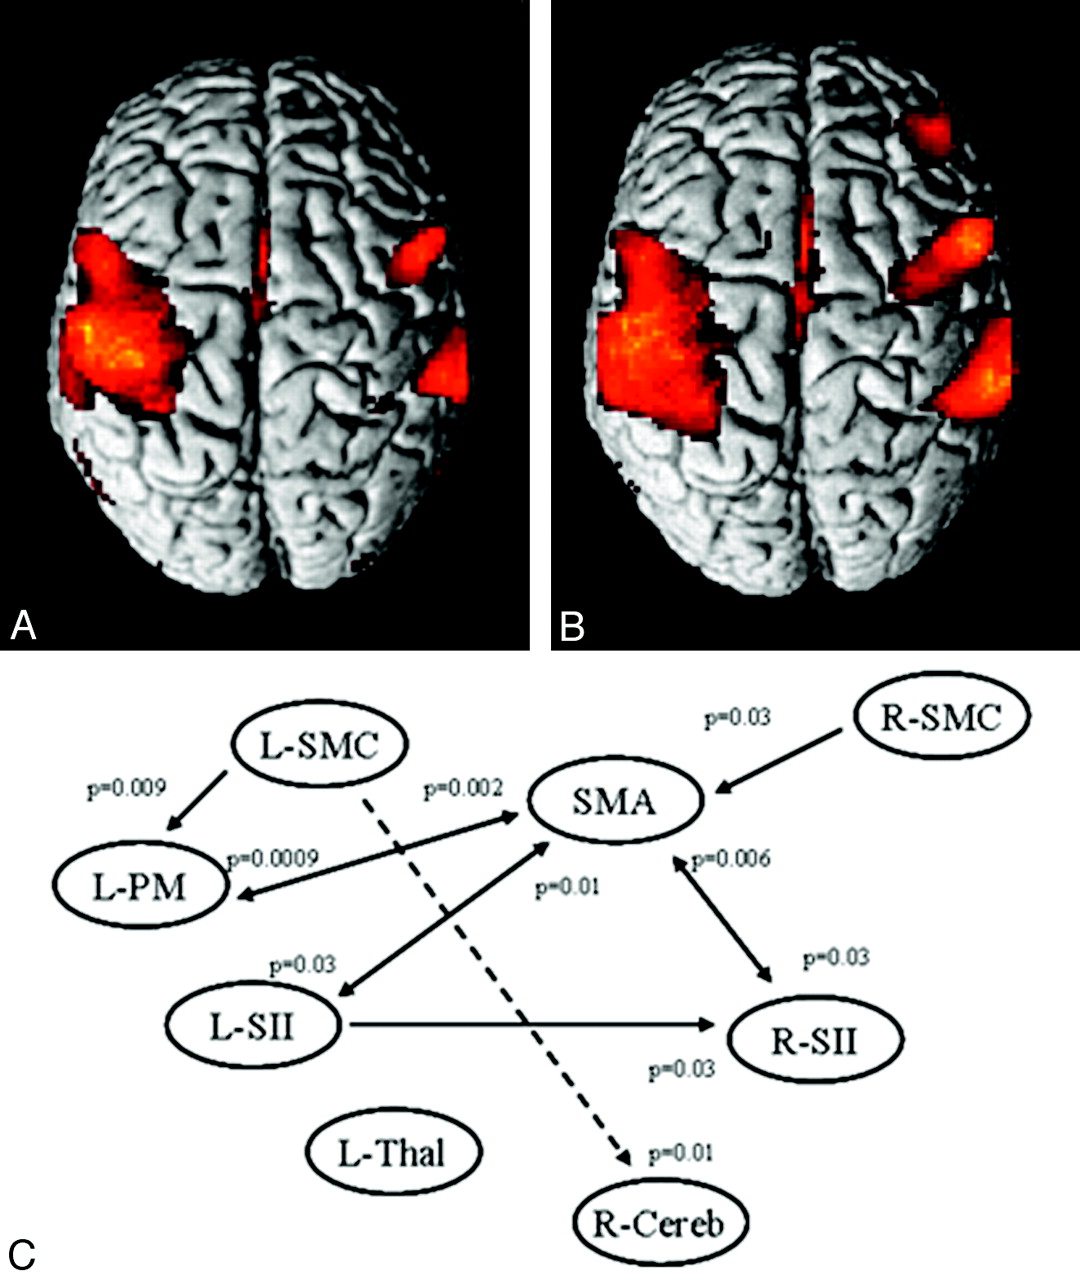
A and B, Cortical activations on a rendered brain from healthy controls (A) and patients with MS (B) from 8 European centers during the performance of a simple motor task with the right hand. Compared with controls, patients with MS had more significant activations bilaterally in several regions of the sensorimotor network. C, A dynamic causal model shows the results of the between-group analysis of effective connectivity. Increased strength of the connections in patients versus controls is reported as continuous black lines, whereas reduced strength of the connections in patients versus controls is reported as dotted black lines. Reprinted with permission from Rocca et al, 2009.81
Conclusions
The application of quantitative MR imaging−based techniques has shown consistently that GM is not spared by MS and that GM damage, albeit with different patterns of regional distribution, is present in all MS phenotypes since the earliest clinical stages of the disease, affects various GM compartments, and is associated with the main clinical manifestations of MS. Several factors likely contribute to the GM damage of MS, including focal macroscopic lesions, intrinsic “diffuse” changes, and irreversible tissue loss. All of these abnormalities increase with time and are only partially associated with the extent of WM pathology. More recently, variable degrees of cortical plasticity with the potential to limit the functional consequences of tissue damage have been shown in patients with MS, suggesting that their disability is likely to result from the balance between structural damage and cortical reorganization, rather then being a mere reflection of tissue disruption. Measuring GM MR imaging variables might, therefore, be a rewarding exercise for improving our understanding of MS pathobiology, which might result, in the future, in the identification of additional markers to monitor disease evolution, either natural or modified by treatment.
Indicates open access to non-subscribers at www.ajnr.org
References
- 1.↵
- 2.↵
- 3.↵
- 4.↵
- 5.↵
- 6.↵
- 7.↵
- 8.↵
- 9.↵
- 10.↵
- 11.↵
- 12.↵
- 13.↵
- 14.↵
- 15.↵
- 16.↵
- 17.↵
- 18.↵
- 19.↵
- 20.↵
- 21.↵
- 22.↵
- 23.↵
- 24.↵
- 25.↵
- 26.↵
- 27.↵
- 28.↵
- 29.↵
- 30.↵
- 31.↵
- 32.↵
- 33.↵
- 34.↵
- 35.↵
- 36.↵
- 37.↵
- 38.↵
- 39.↵
- 40.↵
- 41.↵
- 42.↵
- 43.↵
- 44.↵
- 45.↵
- 46.↵
- 47.↵
- 48.↵
- 49.↵
- 50.↵
- 51.↵
- 52.↵
- 53.↵
- 54.↵
- 55.↵
- 56.↵
- 57.↵
- 58.↵
- 59.↵
- 60.↵
- 61.↵
- 62.↵
- 63.↵
- 64.↵
- 65.↵
- 66.↵
- 67.↵
- 68.↵
- 69.↵
- 70.↵
- 71.↵
- 72.↵
- 73.↵
- 74.↵
- 75.↵
- 76.↵
- 77.↵
- 78.↵
- 79.↵
- 80.↵
- 81.↵
- Copyright © American Society of Neuroradiology
In this issue


Jump to section
Related Articles
Cited By...
- Cortical Thickness and Serum NfL Explain Cognitive Dysfunction in Newly Diagnosed Patients With Multiple Sclerosis
- Increased total sodium concentration in gray matter better explains cognition than atrophy in MS
- Establishing pathological cut-offs of brain atrophy rates in multiple sclerosis
- Assessing Abnormal Iron Content in the Deep Gray Matter of Patients with Multiple Sclerosis versus Healthy Controls