
SUMMARY:
CS is an autosomal recessive multisystem disorder, which is mainly characterized by neurologic and sensory impairment, cachectic dwarfism, and photosensitivity. We describe the neuroimaging features (MR imaging, 1H-MR spectroscopy, and CT) in the various clinical subtypes of CS from a cohort of genetically and biochemically proved cases. Hypomyelination, calcifications, and brain atrophy were the main imaging features. Calcifications were typically found in the putamen and less often in the cortex and dentate nuclei. Severe progressive atrophy was seen in the supratentorial white matter, the cerebellum, the corpus callosum, and the brain stem. Patients with early-onset disease displayed more severe hypomyelination and prominent calcifications in the sulcal depth of the cerebral cortex, but atrophy was less severe in late-onset patients. On proton MR spectroscopy, lactate was detected and Cho and NAA values were decreased. These combined neuroradiologic findings can help in the differential diagnosis of CS, distinguishing it from other leukoencephalopathies and/or cerebral calcifications in childhood.'
Abbreviations
- Cho
- choline
- Cr
- creatine
- CS
- Cockayne syndrome
- COFS
- cerebro-oculo-facio-skeletal syndrome
- FLAIR
- fluid-attenuated inversion recovery
- NAA
- N-acetylaspartate
CS is a rare multisystem disorder, with autosomal recessive inheritance. It belongs to the family of nucleotide excision repair diseases together with xeroderma pigmentosum and trichothiodystrophy. Clinical features include failure to thrive, neurodevelopmental delay, cutaneous photosensitivity, pigmentary retinopathy, neurosensory hearing loss, dental caries, and cachectic dwarfism. The diagnosis is considered very likely if the first 2 clinical criteria and at least 3 of the other criteria mentioned above are present.1 CS encompasses a wide spectrum of clinical severity, which has been divided into 4 overlapping clinical subgroups of decreasing severity: COFS, CS II, CS I, and CS III. COFS, which has recently been identified as a CS subtype, is the most severe form, starting in utero or during the neonatal period with arthrogryposis, microphthalmia, and congenital cataracts and has a rapid fatal outcome. CS type II begins in the first years of life and leads to death in infancy. CS type I (the classic form) manifests during infancy, and death occurs in the first decades of life. CS type III shows milder signs and follows a more protracted course into adulthood.1
CS is caused by mutations in either of 2 major genes, CSA and CSB. The CSA and CSB proteins are involved in the transcription-coupled subpathway of the nucleotide excision repair, which is closely related to the basal transcription machinery and preferentially targets DNA lesions in actively transcribed genes. Mutations in CSA and CSB lead to a lack of recovery of RNA synthesis in cultured skin fibroblasts after ultraviolet irradiation, a key feature used as the major cellular diagnostic test for CS. This defective repair of ultraviolet-induced lesions may well explain the cutaneous photosensitivity of patients with CS, but the pathophysiologic mechanisms behind the remaining clinical features are poorly understood. Defective repair of oxidative lesions and subtle transcription defects have been put forward to account for the clinical picture of CS.2
CS is classified among the childhood leukodystrophies, and brain imaging findings are cardinal features suggesting the diagnosis of CS. Previously published CS imaging studies have described major brain atrophy, calcifications in the basal ganglia, and a lack of myelination of the white matter, but whether these findings are due to hypomyelination or demyelination remains unclear.3–6 However, most imaging reports on CS were based on isolated case reports or a small series of cases that were not all biochemically or genetically confirmed.
We have reviewed the neuroimaging features of 19 patients with biochemically and genetically proved CS, 1–53 years of age. Our goal was to update and improve the description of the neuroimaging characteristics of the different clinical subtypes of CS.
Materials and Methods
Patients
Nineteen patients were included in our study (12 males, 7 females) and were evaluated retrospectively. All included patients fulfilled the clinical criteria for CS1 and presented a lack of recovery of RNA synthesis on cultured skin fibroblasts after ultraviolet irradiation. CSB mutations were found in 14 patients, and the CSA mutations, in 5 patients. Demographic, clinical, and genetic data are given in On-line Table 1. Patients 7 and 10 were brothers. Patients were assigned to the different clinical subtypes on the basis of the age of onset according to previously proposed classifications.1 There were 2 cases of COFS, 6 of CS II, 8 of CS I, and 3 of CS III.
The study was approved by the institutional ethics board. Informed written consent was given by the patients' parents or legal guardians.
Imaging Protocol
Brain CT and MR imaging studies of these patients were retrospectively analyzed. All patients had at least 1 CT or MR imaging examination, and some patients had ≥2 examinations 1–9 years apart. These imaging studies were performed during a 9-year period, at various institutions and, therefore, varied in thickness and sequence parameters among the individual patients.
The most recent imaging data were obtained as described below.
CT scans were performed on a 16-section CT scanner (Sensation 16; Siemens, Erlangen, Germany). Cerebral axial images were obtained over the entire brain with a spiral study reconstructed as 3-mm-thick contiguous sections. MR imaging studies were performed on a 1.5T MR imaging system (Magnetom Avanto, Siemens) with an 8-channel phased array head coil. Sedation with chloral hydrate (50–75 mg/kg orally) or midazolam (2 mg/kg orally) was used in some patients. The imaging protocol included axial turbo spin-echo proton attenuation and T2-weighted (TR/TE/excitations, 4000 ms/14–109 ms/1), axial FLAIR fast spin-echo (TR/TE/TI/excitations, 9290 ms/116 ms/2500 ms/1), sagittal T1-weighted spin-echo (TR/TE/excitations, 452 ms/9 ms/1), and 3D fast low-angle shot axial T1-weighted (TR/TE/excitations, 11 ms/4.94 ms/1) images. Multiplanar reconstruction images were obtained from the 3D T1 sequence.
Short (TE = 30 ms) and long (TE = 135 ms) TE single-voxel 1H-MR spectroscopy of the medial parietal gray matter and parietal white matter was performed. The scan parameters for the point-resolved spectroscopy sequence were voxel size, 20 × 20 × 20 mm (8 mL); TR, 1500 ms; TE, 30 ms; averages, 128. Metabolite concentrations were estimated by using LCModel software (Stephen Provencher, Oakville, Ontario, Canada).7
The oldest images (CT and/or MR imaging) were available on films or compact discs.
The CT section thickness was 3 mm. The MR imaging studies included at least sagittal T1- and axial T2-weighted sequences. Some studies included axial FLAIR images as well.
Data Analysis
The images were reviewed separately and then jointly by 2 experienced neuroradiologists who were blinded to the clinical type and patient age. Consensus was reached on all findings. CT scans were evaluated with a visual grading system for the presence, extent, and attenuation of calcifications (absent, −; punctuate/subtle, +; mild, ++; severe, +++) and white matter hypoattenuation (absent, −; mild, +; severe, ++). The grading system used for brain calcifications is illustrated in Figs 1 and 2 . On MR imaging, atrophy was scored qualitatively (absent, −; mild, +; moderate, ++; severe, +++) and separately for the posterior fossa (brain stem, vermis, and cerebellum) and the supratentorial area (corpus callosum, white matter, cortex, and basal ganglia). Ventricular dilation was scored in the same way.

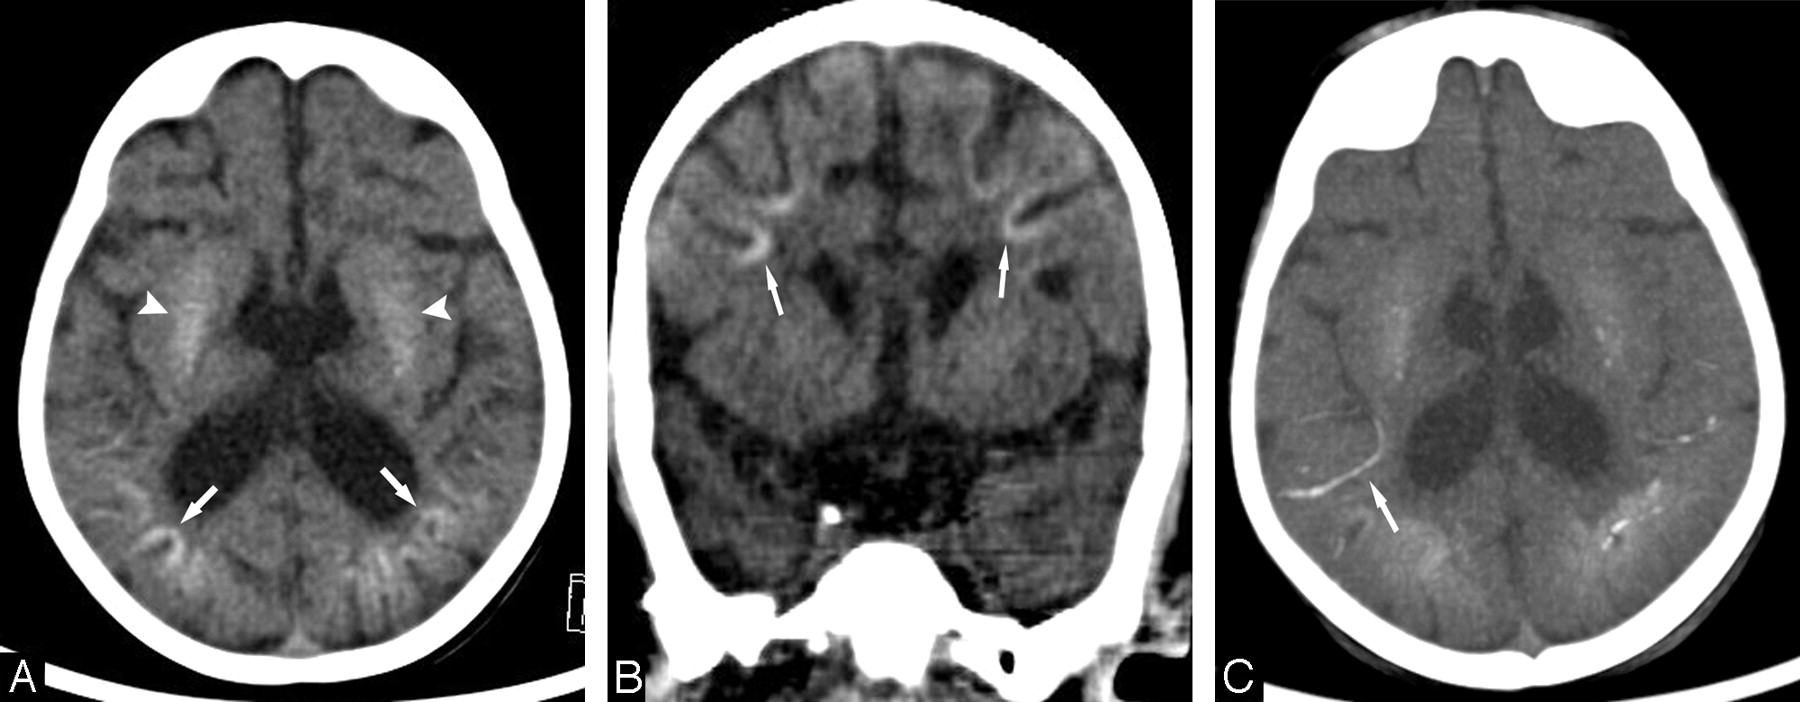
Patient 6 at 6 years of age (CS I). A, Axial CT scan at the basal ganglia level shows severe bilateral calcifications in the putamen. Subtle calcifications are seen in the frontal and parietal cortex at the depths of the sulci (arrows). B, Axial CT scan of the posterior fossa shows bilateral slight calcifications in the dentate nuclei (arrows).

Patient 14 (CS II) at 2 years of age. A, Axial CT scan at the basal ganglia level shows bilateral calcifications in the cortex at the depths of the sulci in the parietal regions (arrows), in addition to mild bilateral putaminal calcifications (arrowheads). B, Coronal reformatted CT scan shows bilateral calcifications in the cortex at the depths of the sulci in the frontal regions (arrows). C, Axial maximum-intensity-projection reformation of the CT scan (A) shows calcified leptomeningeal vessels, notably in the right insular region (arrow).
For grading atrophy, all of the patients were reviewed and compared with each other and with a healthy control, and atrophy for each structure was classified by increasing gravity among all the patients. Patient 10 at 13 years of age was judged to have severe global atrophy (Fig 3). Atrophy was scored as mild or moderate by determining 2 intermediate grades of atrophy between patient 10 and the healthy control. The white matter signal intensity was analyzed in different areas (brain stem, cerebellum, internal capsule posterior and anterior limbs, corpus callosum, and hemispheric white matter).

Patient 10 (CS I) at 4 (A and B) and 13 (C and D) years of age. A and C, Midline sagittal T1-weighted images demonstrate the progressive development of generalized cerebral and cerebellar atrophy, which is very severe at 13 years of age, with substantial corpus callosum and brain stem thinning. Note the thickened cranial vault and frontal and sphenoid sinus dilation at 13 years of age related to brain atrophy. B and D, Axial T2-weighted images show only a slight ventricular dilation at 4 years of age but considerable atrophy of the cortex as well as the white matter at 13 years of age, with increased ventricular dilation.
Results
The neuroradiologic results are detailed for each patient in On-line Table 2.
CT Findings
Eighteen of the 19 patients had at least 1 CT scan. Brain calcifications, cerebral atrophy, and white matter hypoattenuation were the main imaging features.
Cerebral Calcifications
Brain calcifications were present in 16 of 18 patients. Calcifications were only absent in patients 12 and 18 (type II and COFS) at 4 months and 2 years of age, respectively. In patient 19 (COFS), calcifications were absent at 9 months but present at 2 years. Regarding the entire cohort, brain calcifications could be detected from 1 year of age (patients 5 and 13) and were observed in all patients older than 3 years of age (CS type I and III). Calcifications were typically bilateral and symmetric, ranging from punctuate to severe, and were most frequently seen in the putamen (15/18). Putaminal calcifications were either isolated (5/15) or associated with calcifications in the cortex, the dentate nuclei, the caudate nuclei, the pallidum, and, more rarely, the white matter or the thalami (Fig 1). Cortical calcifications were larger at the depths of the sulci in the occipital, parietal, and frontal lobes. In the frontal lobes, they extended to the white matter in 2 patients (patient 5, type I, and patient 13, type II). Patient 17 (type II) had vermian calcifications associated with calcifications of the dentate nuclei. Patient 6 (type III, 28 years of age) had tentorial calcifications.
Overall, there was no strict correlation between the extent or severity of the calcifications and the age of the patients, the severity of their neurologic symptoms, or the degree of cerebral atrophy. Nevertheless, the largest calcifications were seen in the oldest patient of our series (patient 3, type III, CT scan at 44 years of age) in the dentate nuclei, the putamen, and the caudate nuclei. Additionally, a particular pattern of brain calcifications was seen in 4 of the most severely affected patients (3 patients with CS II and 1 with COFS). These patients (13, 14, 17, and 19) had almost identical distribution of calcification, including bilateral involvement of the lenticular nuclei and major and bilateral calcifications in the cortex in the depths of the sulci and in the nearby leptomeningeal vessels in the frontal and parieto-occipital subarachnoid spaces (Fig 2).
Other Findings
White matter hypoattenuation was noted in the semioval center and/or in the periventricular white matter, mainly in the frontal regions, in 10 patients. This was present from 2 years of age, and it was the most substantial in patient 3. Calvarial thickening was seen in 12 patients, associated with dilation of all facial sinuses in 4 patients.
MR Imaging Findings
MR imaging studies revealed infra- and supratentorial cerebral atrophy with predominantly white matter loss and abnormal white matter signal intensity in all patients.
Brain Atrophy
MR imaging investigations revealed brain atrophy in all 19 patients, ranging from mild to severe. In all patients, cerebral supratentorial atrophy was related to progressive and extensive white matter loss, with subsequent ventricular dilation. White matter loss seemed to be the earliest neuroradiologic finding that could be identified when images were available at very early stages of disease progression (patients 4 and 5, type I). White matter loss and lateral ventricular dilation were slightly more evident in the parieto-occipital regions. The corpus callosum and the internal capsules were thin in most patients. The cerebral cortex and the basal ganglia showed pronounced atrophy in advanced stages only.
The brain stem and cerebellum showed variable but usually moderate or severe atrophy, resulting in an enlarged cisterna magna. Cerebellar atrophy included white matter and cortical atrophy in the vermis and cerebellar hemispheres and was moderate or severe in most patients.
Cerebellar atrophy and an enlarged cisterna magna were already present in 2 patients with COFS and CS II (patients 12 and 18) before 4 months of age, whereas the size of the cerebellum was still within normal limits in 2 patients with CS I (patients 4 and 5) examined at 4 months and 1 year of age. Cerebral atrophy in patient 1 (type III) at 6 years of age was far less pronounced than that in patients 6, 7, 9, and 10 (type I), all between 4 and 7 years of age. There was a gross correlation between age and degree of atrophy within each subtype. Cerebral and cerebellar atrophy had clearly progressed with increasing age in patients with CS III, CS I, CS II, and COFS, who were scanned at 2 time points (patients 1, 10, 17, and 18) (Figs 3 and 4).

Patient 18 (COFS) at 3 months (A) and 2 years (B) of age. A, Coronal T2-weighted image shows cerebellar hypoplasia. B, Coronal reformatted T1-weighted image demonstrates on follow-up that the cerebellum is now extremely atrophic.
White Matter Abnormalities
The supratentorial white matter showed high signal intensity on T2-weighted and moderately high signal intensity on T1-weighted images in most patients. This pattern is consistent with hypomyelination and appeared more severe in patients with COFS and CS II involving the corpus callosum and the internal and external capsules as well (Fig 5).

Axial T2-weighted images of patient 18 (COFS) at 3 months (A) and 2 years (B–D) of age. A, High signal intensity is present in the posterior limb of the internal capsule, consistent with an early lack of myelin. B–D, At 2 years of age, the myelination in the posterior fossa is normal (B), but no myelin is seen in the supratentorial white matter (C and D), which shows diffuse mild hyperintensity, including in the internal and external capsules (C). This aspect is consistent with hypomyelination. Note also the progressive cerebral atrophy.
In patients with CS I and CS III, a low signal intensity of myelination was observed on T2-weighted images in the corpus callosum and the posterior limb of the internal capsule but very rarely in the anterior limb (Fig 6 B). Conversely, the posterior fossa always showed normal myelination in all patients (Figs 5B and 6A).

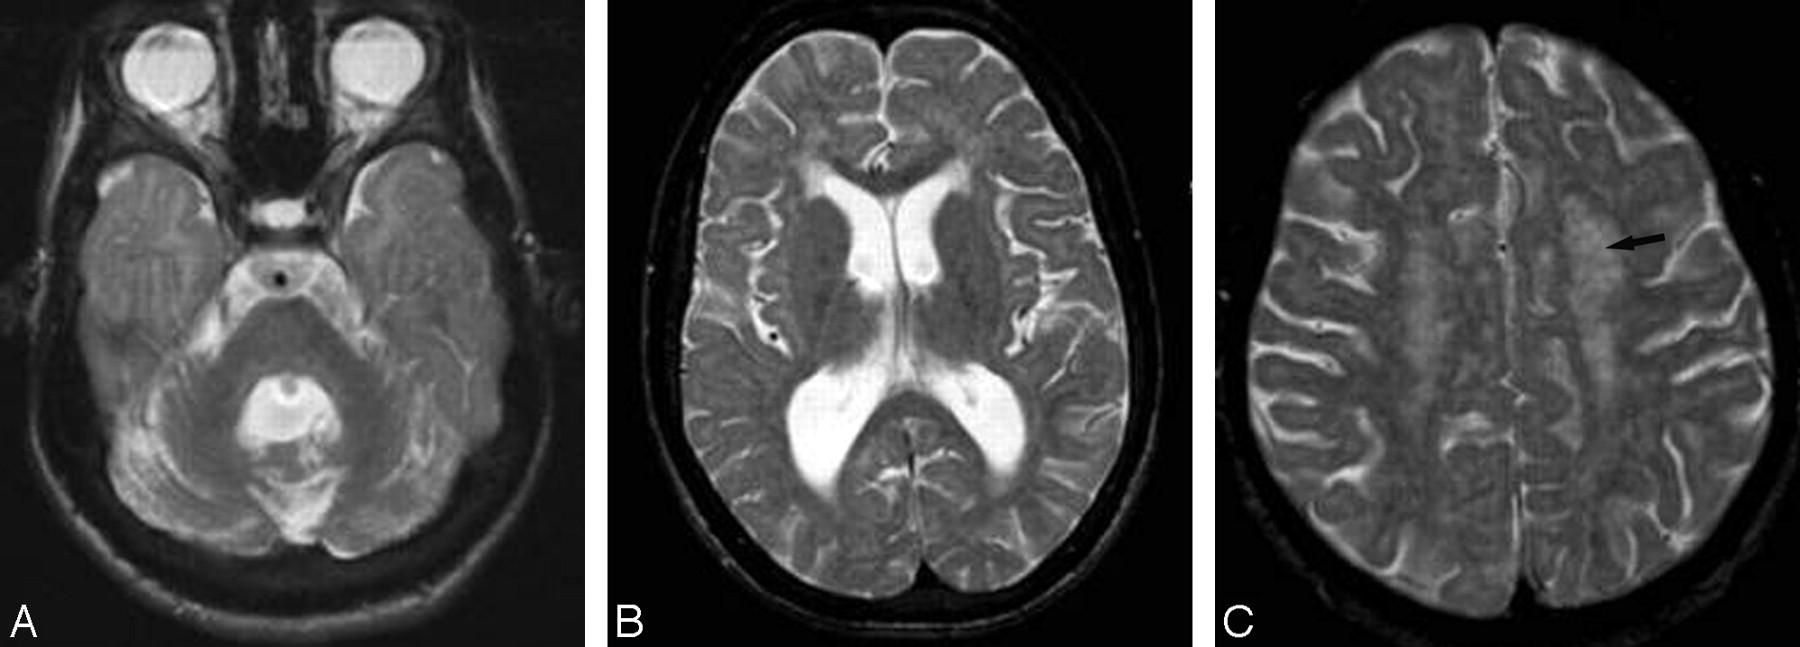
Axial T2-weighted images of patient 1 (CS III) at 15 years of age. A, The cerebellum and the brain stem are fully myelinated. B, Myelination is also seen in the corpus callosum and the posterior limb of the internal capsule. The T2 hyperintensity lining of the medial part of the right internal capsule is probably the result of its progressive atrophy. C, The semioval center shows a punctuate appearance (arrow), with hypointense foci within the hyperintense white matter, reflecting preserved perivascular myelin. This corresponds to the tigroid leukodystrophy found in CS neuropathology.
In some patients with CS I and CS III, the signal intensity was heterogeneous on T2-weighted images with small low-intensity foci within the hyperintense supratentorial white matter. This finding was particularly pronounced in the patient with CS III (patient 1) at 6 years of age (Fig 6C).
Altogether, the data from patients with CS I and CS III consistently showed a severe delay or arrest in the brain myelination process, which never surpassed the normal myelination stage of a 6-month-old child. In addition, small areas of the subcortical frontal white matter showed low signal intensity on T1-weighted images in some patients with CS I and CS III after 6 years of age. In 1 of these patients (patient 1), these areas showed normal hyperintensity on T1-weighted images on a previous MR imaging. This progression suggests an additional ongoing demyelination process and may account for the high signal intensity occasionally observed on T2-weighted images in the midpons and the genu of the corpus callosum in the oldest patients with CS III.
In most patients, especially those several years into the disease process, the hemispheric white matter signal intensity was very high on FLAIR, which could be suggestive of progressive astrogliosis in myelin-deficient areas.
Areas of increased signal intensity on T1-weighted images and occasionally areas of decreased signal intensity on T2-weighted images were visible in the lenticular nuclei in some patients, corresponding to the calcifications visualized on CT scans.
1H-MR Spectroscopy Findings
1H-MR spectroscopy was performed on 2 patients with COFS (patients 18 and 19), 2 with CS type II (patients 13 and 17), 3 with CS type I (patients 6, 7, and 10), and 2 with CS type III (patients 1 and 2). The Cr level was normal in the white and gray matter in all cases, relative to healthy controls. The NAA/Cr ratios were decreased in the white and gray matter in all patients, and the Cho/Cr ratios were decreased in the white matter in all patients. The Cho/Cr ratios were normal or decreased in the gray matter. Lactate was elevated in all patients.
Discussion
Since the first description in 1936, more than 200 CS cases have been reported. However, descriptions of neuroimaging studies in CS are uncommon in the literature, and few reports include cases that have been confirmed by genetic testing.3 This study included the analysis of 19 CT scans and 24 MR imaging studies in 19 patients with confirmed CS. It was limited by the relatively small number of patients in each CS subtype and by the lack of prolonged and systematic longitudinal follow-up. Nevertheless, our data have allowed us to describe the various neuroimaging features of this rare disease in detail, with regard to previous radiologic and neuropathologic findings and to discuss current pathophysiologic hypotheses.
Neuroimaging Diagnosis of CS
Clinical diagnostic criteria have been established since 1992. However, these do not include neuroimaging features, and CS remains largely underdiagnosed.8 Our data confirm not only that cerebral and cerebellar atrophy, calcifications, and white matter anomalies are cardinal neuroimaging features in CS but also that these items are not all simultaneously present from the earliest stages of the disease. Still, the association of these signs, their precise characteristics, and their gradual appearance during the natural course of the disease can be highly suggestive of the CS diagnosis.
White matter loss and ventricular dilation are probably the earliest detectable signs of CS on brain imaging. In our study, these signs were always present at the onset of neurologic symptoms, in all clinical subtypes. The amount of white matter decreases with time, with subsequent progressive ventricular enlargement and internal capsule, corpus callosum, and brain stem thinning. White matter loss shows slight parieto-occipital predominance, always with little residual frontocentral white matter at the end of progression and a posterior predominance of the ventricular dilation. Relative preservation of the cortex until the late stages is very consistent with the relative preservation of social skills (in comparison with the motor impairment seen), which has been noted since the very first reports by E. Cockayne himself.
Progressive cerebellar atrophy is also an early and common feature, with global volume loss, shrunken folia, and cisterna magna enlargement. In our cohort and in other reports, cerebellar atrophy included white and gray matter9,10 and clearly progressed with time in all clinical subtypes, together with the clinical dysmetria and action tremor observed in patients with CS.
White matter signal-intensity anomalies in CS have been diversely attributed to demyelination6 or hypomyelination4,5 in previous reports. Our data, including 1H-MR spectroscopy imaging, indicate that CS is primarily a hypomyelinating disorder.
The myelination process was clearly delayed in all patients who underwent imaging in the early stages. Brain stem and cerebellar white matter usually show a normal state of myelination, but the myelination process is clearly impaired in the hemispheric white matter. Complete absence of detectable myelination on T2-weighted imaging is observed from the first year of life in the supratentorial white matter in patients with the most severe COFS and CS II disease. In the patients with CS I and CS III, myelination seems to initially follow a normal course; then, it appears to be arrested at a stage equivalent to that of 6 months of age.
Our findings are in accordance with those of previous reports showing normal myelination in the compact pathways of projection and in the commissural fibers in patients with classic CS.5,6 In some of our patients, as in another similar study,11 foci of hypointensity were observed within the hyperintense white matter on T2-weighted images. This probably reflects the histopathologic “tigroid leukodystrophy,” which corresponds to areas of preserved perivascular myelin within a deficient myelin area.12 This sign, which is not specific to CS, has also been reported in Pelizaeus-Merzbacher disease, metachromatic leukodystrophy, globoid cell leukodystrophy, and Lowe syndrome.13
MR spectroscopic studies of white matter diseases are scarce and have sometimes had conflicting results, probably because of technical factors and differences in the phenotypes and stages of the diseases. Generally, demyelinating disorders showed increased Cho values, while hypomyelinating disorders showed a normal or decreased level, and white matter rarefaction diseases showed decreased values.14–16 Thus, the decreased level of Cho in the white matter in our patients points predominantly to hypomyelination and/or white matter rarefaction, rather than active demyelination, in agreement with our MR imaging findings. The metabolic profile of NAA in gray and white matter suggests a decrease in neuronal and axonal attenuation in all types of CS, and as in Pelizaeus-Merzbacher disease, this may be related to secondary neuroaxonal degeneration as well.15
Secondary demyelination and astrogliosis were present in some patients in our cohort and have been previously mentioned in MR imaging and pathology reports of CS cases,6–9 as well as in other hypomyelinating disorders such as Pelizaeus-Merzbacher disease.17
Brain calcifications were seen in infants as young as 1 year of age in our cohort and from 6 months of age in a previous report.18 They are usually observed within months or years after the onset of the neurologic symptoms. Conversely, this means that calcifications can be missing at early stages, especially in patients presenting the most severe forms of CS. Calcifications are noted in most patients with CS older than 3 years of age. There is no clear correlation between the presence of calcifications and specific neurologic symptoms, but 2 different patterns of calcifications can be recognized in different clinical subtypes. In patients with classic CS, symmetric, attenuated, and homogeneous putaminal calcifications are usually predominant but can sometimes appear punctuate and slightly asymmetric.11 In patients with severe CS II and COFS, diffuse cortical calcifications at the depths of the sulci are associated with the putaminal calcifications. This particular cortical topography has been reported previously in a neuropathologic study, along with calcifications of neighboring arteries.19 Calcified leptomeningeal vessels, also described in other CS neuropathologic reports,1,9,20 were present in 5 of our patients with CS II and COFS.
These combined neuroradiologic findings can help establish the differential diagnosis of CS versus other forms of leukoencephalopathies and/or cerebral calcifications in childhood. In congenital cytomegalovirus infections, brain calcifications typically show a periventricular subependymal distribution and may be associated with cortical gyral anomalies.21 In Aicardi-Goutières syndrome, calcifications are more frequently small and punctuate in the basal ganglia and the deep and periventricular white matter.22 Other hypomyelinating disorders, in particular Pelizaeus-Merzbacher disease, may show similar MR imaging aspects in the early stages. Progressive white matter loss, secondary demyelination, and even cerebellar and brain stem atrophy can be observed, but no calcification occurs. Mitochondrial diseases may also reveal MR imaging features that are very similar to the aspects observed in CS, including brain calcifications, white matter signal intensity abnormalities, and even elevated lactate levels in spectroscopic analysis; however, the severe and progressive white matter loss and cerebral and cerebellar atrophy are probably more suggestive of CS.
Pathophysiologic Hypotheses
The classic mechanism that has been proposed to explain the progressive neurodegeneration seen in DNA repair disorders is the accumulation of unrepaired oxidative DNA lesions in postmitotic neurons, leading to apoptosis. In CS, severe neuronal loss is particularly observed in the cerebellar cortex (granular and Purkinje cells and the molecular layer) with distortion of Purkinje cell apical dendrites, associated with white matter loss.12 Signs of apoptosis have been found in cerebellar granular cells in patients with CS and in a CS mouse model (XPC −/CSB−) and signs of cellular stress in Purkinje cells.23 In another CS mouse model (XPA−/CSB−), the cerebellum became progressively reduced in size after birth, with impaired foliation, reduced thickness, and stunted Purkinje cells.24 Reduced neurogenesis was evident in cerebellar cortical layers with altered proliferation and increased apoptosis in the external granular layer and altered Purkinje cell differentiation.
Progressive cerebellar atrophy is a major feature in most patients with CS, and cerebellar hypoplasia has even been documented in some severe CS/COFS cases.1,25 As the cerebellum continues to develop during the first year of life and shows a massive proliferation and differentiation of granule cell precursors in the external granular layer, neuronal apoptosis could lead to hypoplasia or atrophy depending on the age of onset and the rate of cell death. Most interesting, progressive cerebellar atrophy is observed in many other DNA repair disorders such as ataxia-telangiectasia, ataxia with oculomotor apraxia, and spinocerebellar ataxia with sensorimotor neuropathy, which may suggest a common mechanism.26–28
The hypomyelination observed in patients with CS is more likely explained by a defect in transcription coactivation. Several observations indicate a deregulated transcription response to thyroid hormones. Thyroid hormones are necessary for oligodendrocytes to multiply and mature, and a defect in the MCT8 gene coding for a thyroid hormone transporter has previously been linked to a hypomyelinating Pelizaeus-Merzbacher-like phenotype.29 In a trichothiodystrophy mouse model,30 a deregulation of the hormone thyroid receptor was shown to be responsible for the defective myelination observed in the disease, by deregulating myelin-related gene expression. Focal demyelination and astrogliosis would then be secondary features due to the disorganization of dysmyelinated white matter.
The presence of preserved myelin in perivascular areas (accounting for the so-called tigroid leukodystrophy) and the presence of string vessels (obliterated vessels) in unmyelinated areas are arguments in favor of the hypothesis of a potential microangiopathic process in CS.12 This hypothesis has recently gained renewed interest because it was shown that microvascular changes were also a common finding in Aicardi-Goutières syndrome, which also presents with brain calcifications and altered myelination.27 Other authors have blamed a “calcifying angiopathy” owing to the frequent calcic deposits found in the wall of leptomeningeal and parenchymal vessels, in addition to parenchymal calcospherites and premature arteriosclerosis.12,20,31 The calcification of the leptomeningeal vessels that we observed in patients with CS II and COFS may reflect even more pronounced vascular lesions.31 However, white matter lesions were not correlated to the intensity of brain calcifications or vascular changes in a neuropathologic study, again suggesting that different mechanisms may play a role in the neurologic anomalies in CS.32
Conclusions
Hypomyelination, supratentorial white matter loss, cerebellar atrophy or hypoplasia, and bilateral putaminal calcifications are the most typical pattern recognized in classic and late-onset CS, often associated with cortical calcifications in early-onset types of the disease. These features can help differentiate CS from other leukodystrophies.
Footnotes
-
indicates article with supplemental on-line tables.
References
- Copyright © American Society of Neuroradiology
In this issue


Jump to section
Related Articles
Cited By...
- Global huntingtin knockout in adult mice leads to fatal neurodegeneration that spares the pancreas
- Global Huntingtin Knockout in Adult Mice Leads to Fatal Neurodegeneration that Spares the Pancreas
- Ketones facilitate transcriptional resolution of secondary DNA structures in premature aging
- Spectrum of Neuroradiologic Findings Associated with Monogenic Interferonopathies
- Adult diagnosis of Cockayne syndrome
- Neuroradiologic patterns and novel imaging findings in Aicardi-Goutieres syndrome
- Teaching NeuroImages: Cockayne syndrome with extensive intracranial calcification
- Dysregulation of gene expression as a cause of Cockayne syndrome neurological disease