
Abstract
BACKGROUND AND PURPOSE: Hemodynamics are thought to play an important role in the mechanisms of aneurysm pathogenesis, progression, and rupture. The purpose of this study was to define quantitative measures related to qualitative flow characteristics previously analyzed and to investigate their relationship to aneurysm rupture.
MATERIALS AND METHODS: The hemodynamic environments in 210 cerebral aneurysms were analyzed by using image-based CFD under different flow conditions. Quantitative hemodynamic variables were defined and extracted from the simulation results. A statistical analysis of the relationship to the previous history of aneurysm rupture was performed, and the variability with flow conditions was assessed.
RESULTS: Ruptured aneurysms were more likely to have larger inflow concentrations, larger MWSS, larger shear concentrations, and lower viscous dissipation ratios than unruptured aneurysms. Areas under low WSS and measures of abnormally low shear force distributions of ruptured and unruptured aneurysms were not statistically different. Although the values of hemodynamic quantities changed with different flow conditions, the statistical differences or ratios between their mean values over the ruptured and unruptured groups were maintained, for both pulsatile and steady flows.
CONCLUSIONS: Concentrated inflow streams and WSS distributions with elevated levels of MWSS and low aneurysmal viscous dissipation are statistically associated with a clinical history of prior aneurysm rupture. In contrast, the area and total viscous shear force applied in the aneurysm region subjected to abnormally low WSS levels are not. This study highlights the potential for image-based CFD for investigating aneurysm-evolution mechanisms and for clinical assessment of aneurysm risks.
Abbreviations
- bpm
- beats per minute
- CFD
- computational fluid dynamics
- 3DRA
- 3D rotational angiography
- HR
- heart rate
- ICI
- inflow concentration index
- KER
- kinetic energy ratio
- LSA
- low shear area
- LSI
- low shear index
- MWSS
- maximum WSS
- SCI
- shear concentration index
- VDR
- viscous dissipation ratio
- WSS
- wall shear stress
Precise assessment of cerebral aneurysm rupture risk is very valuable for clinicians because current treatments carry a small but significant risk that can exceed the small natural risk of rupture.1–3 Currently, aneurysm size is the main variable used to assess aneurysm-rupture risk, with large aneurysms more likely to rupture than smaller aneurysms.4,5 However, many small aneurysms do rupture; therefore, aneurysm size alone may not be enough for a precise evaluation of the risk of rupture. Thus, several researchers have attempted to better stratify the rupture risk with more sophisticated geometric measures.6–9 However, planning elective interventions requires a better understanding of the underlying mechanisms of aneurysm formation, progression, and rupture so that a sound judgment between the risks and benefits of possible therapies can be made. Although these processes are not well-understood, hemodynamics and, in particular, flow-induced WSS are thought to play a fundamental role.10–13 For this reason, several investigators have used image-based CFD models to extract patient-specific hemodynamic information.14–16 Although these studies have suggested interesting relationships between hemodynamic characteristics and aneurysm rupture, statistically significant results have not been achieved because the studies have been mostly limited to small numbers of aneurysms. Only recently has it been shown that ruptured and unruptured aneurysms had statistically different qualitative hemodynamic characteristics.17 In particular, that study showed that ruptured aneurysms were more likely to have concentrated inflow jets, small impingement regions, and complex and unstable flow patterns than unruptured aneurysms. The purpose of this study was to define quantitative hemodynamic variables related to these qualitative characteristics that can be objectively extracted from patient-specific CFD models and to study their relationship to aneurysm rupture.
Materials and Methods
Patients and Imaging Data
A total of 210 cerebral aneurysms in 128 patients imaged by 3DRA were included in this study for analysis, irrespective of aneurysm location, size, or morphology. The patients' medical and radiologic records were reviewed and evaluated for evidence of aneurysmal intracranial hemorrhage. In 27 patients with multiple aneurysms, the clinical and radiologic information were considered and a judgment of the most likely source of hemorrhage was made. The other coincident aneurysms were classified as unruptured. Cases with poor image quality (n = 8) or incomplete filling of the vessels (n = 9), evidence of vasospasm (n = 6), or incomplete or inconclusive clinical information (n = 3) as well as dissecting aneurysms (n = 2) were excluded from the study. All angiographic images were obtained under conventional transfemoral catheterization of the cerebral blood vessels. Rotational angiograms were acquired during a 6-second contrast injection for a total of 24 mL of contrast agent on an Integris biplane unit (Philips Healthcare, Best, the Netherlands). Bilateral 3DRA images were acquired for aneurysms of the anterior communicating artery accepting blood from the left and right A1 segments of the anterior cerebral arteries. 3D voxel datasets were reconstructed from the projection images by using standard proprietary software (XtraVision, Philips Healthcare).
Computational Modeling
Patient-specific models of the cerebral aneurysms and connected vessels were constructed from the 3DRA images by using seeded region-growing algorithms that reconstruct the vascular topology, followed by isosurface deformable models that recover the vascular geometry.18,19 As much of the proximal parent artery that was visible in the 3D images was included in the models to ensure proper representation of secondary flows and inflow to the aneurysms.20 Unstructured tetrahedral grids were then generated with a resolution of 0.01–0.02 cm for CFD simulation. Pulsatile blood-flow simulations were performed by numerically solving the 3D Navier-Stokes equations for a Newtonian incompressible fluid under the assumption of rigid vessel walls. Because patient-specific flow conditions were not available, typical flow waveforms derived from measurements on healthy subjects at different heart rates were used to prescribe inlet boundary conditions.21,22 The flow waveforms were scaled to achieve a given mean WSS at the inlets, which were located in internal carotid, vertebral, or basilar arteries. A total of 5 simulations were carried out for each aneurysm, 2 under pulsatile conditions corresponding to heart rates of 60 and 100 bpm and a mean inlet WSS of 15 dyne/cm2 and 3 under steady flow conditions of “low,” “medium,” and “high” flow rates corresponding to inlet WSS of 10, 15, and 20 dyne/cm2, respectively. The unsteady flow solutions were advanced in time by using 100 time steps per cardiac cycle for 2 cycles with a fully implicit scheme and efficient solution algorithms.23,24 Results of the second cycle were used for hemodynamic aneurysm characterization.
Data Reduction and Analysis
To extract quantitative measures of the aneurysm hemodynamic environment, we first partitioned the vascular models into different geographic regions as follows: First, the aneurysm necks were interactively delineated on the vascular models and the aneurysm orifices were triangulated. The regions of the vascular models on each side of the ostium surface triangulations were then classified as “aneurysm” or “vessel.” The vessel regions were further subdivided into 2 subregions labeled as “near vessel” and “far vessel,” corresponding to distances to the ostium surface less than or larger than 1.0 cm respectively, as seen in Shojima et al.14 Similarly, the aneurysm region was subdivided into “neck,” “body,” and “dome” subregions corresponding to geodesic distances (distance measured along the surface) to the ostium between 0% and 10%, 10% and 40%, and 50% and 100% of the maximum aneurysm distance. The methodology is illustrated in Fig 1(top row). Using this geographic vascular subdivision, schematically illustrated in Fig 1, we defined a number of hemodynamic measures. The mathematic definition of the different vascular regions and hemodynamic variables are detailed in the Appendix. The following variables were defined.
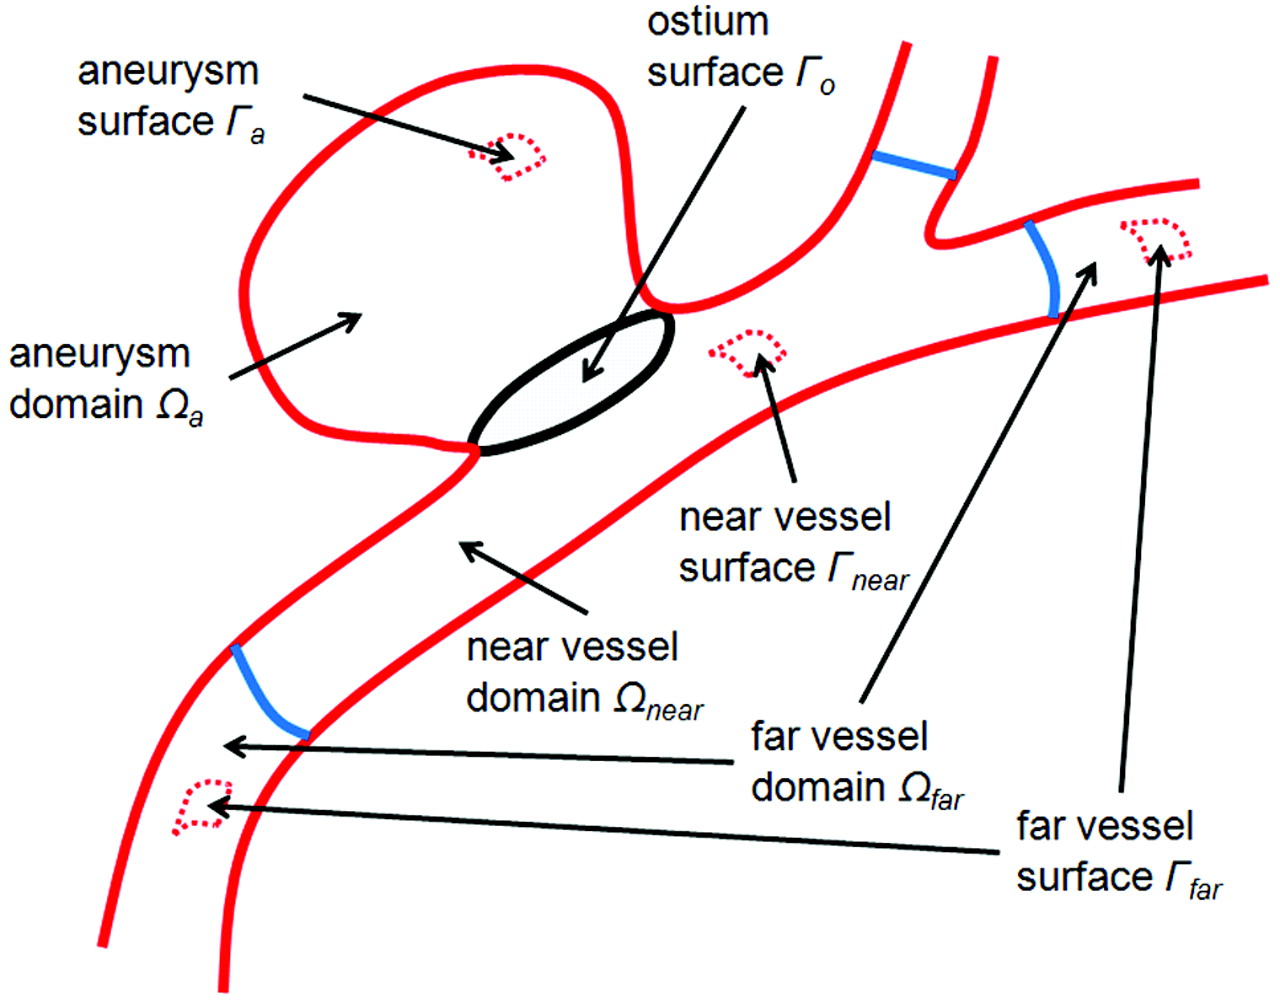
Subdivision of the volumetric vascular domain and its surface into geographic regions: aneurysm, near-parent vessel, far-parent vessel, and ostium surface.
ICI measures the degree of concentration of the flow stream entering the aneurysm. It is defined as the percentage of the flow rate of the parent artery that enters the aneurysm divided by the percentage of the aneurysm ostium area that corresponds to positive inflow velocity:
 where Qin is the flow rate into the aneurysm (inflow), Qv is the flow rate in the parent artery, Ain is the area of the inflow region, and Ao is the area of the ostium surface.
MWSS is the maximum wall shear stress computed over the aneurysm region.
SCI measures the degree of concentration of the WSS distribution. The region of the aneurysm sac where the WSS is higher than the mean WSS over the “near-vessel” region by 1 SD is defined as a region of “high WSS.” If we denote Ah as the area of this region and Aa as the area of the aneurysm sac, the SCI is defined as
 where Fh and Fa represent the total viscous shear forces computed over the region of high WSS (Ah) and the entire sac (Aa):
 with τ the shear stress vector. This index will take a value of zero if no part of the aneurysm has abnormally high WSS and will become large when the WSS distribution has a peak with high WSS concentrated on a small region of the sac.
LSA measures the extent of the aneurysm that is subjected to an abnormally low WSS. It is defined as the percentage of the area of the aneurysm sac that has WSS below the mean WSS in the parent artery by 1 SD:
 where Al is the area under low WSS. This variable will tend to 1 if the aneurysm is entirely under abnormally low WSS and to zero if there is no region with abnormally low WSS.
LSI measures the relative amount of the total shear force applied in regions of abnormally low WSS:
 where Fl represents the total shear force applied in the area of low WSS (Al):

This variable changes from zero (no frictional force applied in regions of abnormally low WSS) to 1 (total frictional force applied in region of abnormally low WSS).
KER measures the kinetic energy content of the aneurysm relative to that in the near-parent artery:

VDR measures the amount of dissipation of mechanical energy by viscous effects in the aneurysm relative to that in the near-parent artery:
 where eij is the strain rate tensor:

For each aneurysm, the values of these variables were computed at each instant of time and averaged over the cardiac cycle. Then, the average values of these variables over the groups of ruptured and unruptured aneurysms were computed and statistically compared by using the Student t test. The differences in the mean values were considered statistically significant if the 2-tailed P values were <.05 (95% confidence interval). The methodology for extraction of hemodynamic quantities from the CFD results is illustrated in Fig 2, with a patient-specific model.

Hemodynamic data reduction. Top row, left to right: aneurysm neck delineation, aneurysm orifice triangulation, and vascular model geographic subdivision. Middle row: flow visualization, left to right: flow streamlines, isovelocity surface, WSS distribution. Bottom row, left to right: normal velocity magnitude at the aneurysm orifice; inflow (red) and outflow (blue) regions of the ostium; and regions of high (red), normal (gray), and low (blue) WSS.
Results
A total of 1050 CFD simulations, 420 pulsatile and 630 steady, on 210 patient-specific aneurysm geometries were carried out. Quantitative hemodynamic measures were obtained for each geometry and flow condition as explained before. The results are presented in Table 1. This Table lists, for each flow condition, the average of hemodynamic variables computed over the ruptured and unruptured aneurysm groups, along with the corresponding 2-tailed P values. These results are also summarized in Fig 3. This figure shows the ratio of mean hemodynamic variables computed over the ruptured group with respect to the mean values computed over the unruptured group, for each flow condition considered. The asterisks above the bars indicate statistically significant differences between the mean values of the ruptured and unruptured groups.
Mean values of hemodynamic variables computed over the ruptured and unruptured groups for each of the flow conditions considereda

Ratio of mean hemodynamic variables of ruptured aneurysms to unruptured aneurysms for each flow condition considered. The green bars represent the mean values over the unruptured aneurysm group used as reference values (ie, normalized to 1). The asterisks indicate that the differences in mean values between ruptured and unruptured groups are statistically significant (for all flow conditions).
Ruptured aneurysms were statistically more likely to have larger inflow concentration indices (ratio = 1.52 ± 0.01, P < .004), larger MWSS values (ratio = 1.41 ± 0.03, P < .0039), larger shear concentration indices (ratio = 1.54 ± 0.14, P < .0159), and lower viscous dissipation ratios (ratio = 0.38 ± 0.02, P < .017) than unruptured aneurysms. They also tended to have larger KERs (ratio = 1.31 ± 0.01, P < .241); however, this association did not reach statistical significance with the current sample. We also observed that the areas under low WSS (ratio = 1.08 ± 0.04, P < .462) and the LSIs (ratio = 1.04 ± 0.04, P < .741) of ruptured and unruptured aneurysms were not statistically different.
The variability with respect to the different flow conditions of the average hemodynamic variables over ruptured and unruptured groups is presented in Table 2. This Table lists the maximum relative difference of each hemodynamic variable obtained with the different flow conditions. Additionally, this Table shows the maximum relative difference of the ratio of ruptured-to-unruptured averaged hemodynamic variables obtained with the different flow conditions. It can be seen that as expected, hemodynamic measures change with the flow conditions while the ratio of ruptured-to-unruptured averaged values has a relatively low variability (<10%, except for the SCI, which reaches a maximum of a 17% relative difference). The data thus suggest that though the values of hemodynamic quantities change with the flow conditions, the statistical differences or ratios between their mean values over the ruptured and unruptured groups are maintained for both pulsatile and steady flows.
Variability with flow conditions of average hemodynamic measures and ratios of ruptured to unruptured aneurysms
Discussion
The natural history of intracranial aneurysms consists of 3 stages: genesis, enlargement, and rupture. It is generally accepted that the pathogenesis is associated with abnormally high hemodynamic stresses.25,26 Rupture occurs when wall stress exceeds wall strength. Enlargement of aneurysms appears to be governed by the interaction between hemodynamic loads and mechanobiologic responses of the cellular elements of the wall, resulting in a weakening of the wall.27–29 However, there is significant controversy regarding the mechanisms responsible for growth and ultimate rupture of cerebral aneurysms, which can be divided into 2 theories: high- and low-flow effects. The distinguishing feature between the 2 schools of thought is in the mechanisms responsible for wall weakening. The high-flow theory focuses on the effects of elevation of WSS, which can cause endothelial injury and thus initiate wall remodelling and potential degeneration,30–33 which would result in an imbalance between the blood pressure and the internal wall stresses and subsequent local dilation of the arterial wall. The resulting abnormal blood WSS field is the driving factor for further progression of the aneurysm geometry. On the other hand, the low-flow theory points to localized stagnation of blood flow against the wall in the dome as causing a dysfunction of the endothelium, as well as accumulation and adhesion of platelets and leukocytes along the intimal surface, which then induce intimal damage and inflammation and subsequent wall degradation.34–36 The aneurysm wall would progressively thin and may result finally in a tearing of the tissue.
Previously, Cebral et al37 analyzed a series of 62 cerebral aneurysms and found that ruptured aneurysms were more likely to have concentrated inflow jets, small flow impingement regions, and complex unstable intra-aneurysmal flow patterns than unruptured aneurysms. These results were recently statistically confirmed with a larger series of aneurysms.17 The current study thus focused on defining quantitative hemodynamic variables that attempt to capture some of these qualitative characteristics as well as new variables that can help discriminate among theories of aneurysm progression based on low- or high-flow effects.
The statistical analysis indicates that the concentration of the inflow stream, determined by the ICI; the MWSS; the concentration of the WSS distribution determined by the SCI; and the viscous dissipation of the aneurysm with respect to that on the parent artery assessed by the VDR are all strongly correlated with aneurysm rupture. In particular, these associations suggest that ruptured aneurysms tend to have more concentrated inflows and WSS distributions, larger MWSS, and lower viscous dissipation. Note that as suggested in Speelman et al,38 the use of the 99th percentile may yield more robust and reproducible results than the peak WSS used here. On average, ruptured aneurysms also had larger kinetic energy contents than their parent artery as determined by the KER, but this trend did not reach statistical significance. In contrast, the percentage of the aneurysm area under low WSS (measured by the LSA) as well as the percentage of the viscous shear forces applied over this area (measured by the LSI) did not correlate with rupture. Mechanistically, these results seem to point to regions of concentrated rapid-flow activity as correlating with rupture rather than to regions of low or stagnant flows. However, establishing the dependence or independence of the hemodynamic measures considered requires a more sophisticated multivariate analysis than the simplistic analysis performed in this study and will be part of future research.
During the modeling process, a number of assumptions and approximations were made that need to be considered when interpreting the results. The most important approximations are perhaps the vascular geometry, the flow boundary conditions, the blood rheology, and the wall compliance. In this study, blood was approximated by a Newtonian model, and the vessel walls were considered rigid. Previous sensitivity analyses on a small number of aneurysms indicated that these 2 factors are secondary with respect to the geometry and flow conditions.18,20 Vascular geometries were obtained from 3D rotational angiograms with special attention paid to the reconstruction of the parent artery to properly represent the swirling flows that determine the way blood flows into the aneurysms.39 Images that failed to properly depict the parent vessel because of incomplete filling or images that were too noisy due to low contrast dose were discarded. Because patient-specific flow conditions were not available, the models were run under a range of physiologic flow conditions derived from measurements performed on healthy subjects, including both pulsatile and steady flows. The results of this study indicate that though the values of the hemodynamic measures considered do change with different flow conditions as expected, the statistical differences between ruptured and unruptured groups as well as their ratios are mostly unaffected. In other words, the same associations between hemodynamic quantities and rupture would be obtained if one decided to use 1 set of flow conditions or another. In particular, this conclusion implies that one could use steady flow conditions to extract some hemodynamic measures that are related to aneurysm rupture. This could allow the use of image-based CFD models for quick evaluation of cerebral aneurysms during clinical examinations to enhance current risk assessment and ultimately improve patient care.
Conclusions
A hemodynamic analysis of a series of cerebral aneurysms by using image-based CFD has shown that concentrated inflow streams and WSS distributions with elevated levels of MWSS and low aneurysmal viscous dissipation are statistically associated with a clinical history of prior aneurysm rupture. In contrast, the area and total viscous shear force applied in the aneurysm region subjected to abnormally low WSS levels did not correlate with rupture. These results seem to favor theories of aneurysm progression based on high-flow effects; however, further multivariate analyses are necessary to establish the dependence of the high- or low-flow measures defined in the current study and to shed further light onto these mechanisms. This study also highlights the potential for image-based CFD for investigating aneurysm-evolution mechanisms and in the clinical assessment of aneurysm risks.
Appendix
This Appendix lists the mathematic definitions of the vascular regions of Fig 1 as well as fluid dynamic (Table 3), geographic (Table 4), and hemodynamic (Table 5) variables used for analysis.
Fluid dynamic variables
Vascular regions and geographic variables
Aneurysm hemodynamic variables
Footnotes
-
This work was supported by Philips Healthcare and the National Institutes of Health (grant R01NS059063).
Indicates open access to non-subscribers at www.ajnr.org
References
- Received July 30, 2010.
- Accepted after revision October 15, 2010.
- Copyright © American Society of Neuroradiology
In this issue


Jump to section
Related Articles
Cited By...
- A practical strategy for data assimilation of cerebral intra-aneurysmal flows using a variational method with boundary control of velocity
- Hemodynamic Characteristics in Ruptured and Unruptured Intracranial Aneurysms: A Prospective Cohort Study Utilizing the AneurysmFlow Tool
- Non-contrast enhanced silent MR angiography to evaluate hemodynamics and morphology of unruptured intracranial aneurysms: a comparative computational fluid dynamics study
- Evaluation of aneurysm rupture risk based upon flowrate-independent hemodynamic parameters: a multi-center pilot study
- Geometric versus hemodynamic indexes for rupture-destined aneurysms: a retrospective cohort and a repeated-measures study
- Evaluation of aneurysm rupture risk based upon flowrate-independent hemodynamic parameters: a multi-center pilot study
- Fluid-structure interaction simulation of tissue degradation and its effects on intra-aneurysm hemodynamics
- Geometric variations associated with posterior communicating artery aneurysms
- Nature, content and shifts over time of the most impactful unruptured intracranial aneurysms articles: a bibliometric analysis
- Comparing Morphology and Hemodynamics of Stable-versus-Growing and Grown Intracranial Aneurysms
- Differences in Cerebral Aneurysm Rupture Rate According to Arterial Anatomies Depend on the Hemodynamic Environment
- Local Hemodynamic Conditions Associated with Focal Changes in the Intracranial Aneurysm Wall
- Towards the Clinical utility of CFD for assessment of intracranial aneurysm rupture - a systematic review and novel parameter-ranking tool
- Identification of Hostile Hemodynamics and Geometries of Cerebral Aneurysms: A Case-Control Study
- Vessel Wall Enhancement in Unruptured Intracranial Aneurysms: An Indicator for Higher Risk of Rupture? High-Resolution MR Imaging and Correlated Histologic Findings
- China Intracranial Aneurysm Project (CIAP): protocol for a prospective cohort study of interventional treatment and craniotomy for unruptured aneurysms
- Shared and Distinct Rupture Discriminants of Small and Large Intracranial Aneurysms
- Nonsphericity Index and Size Ratio Identify Morphologic Differences between Growing and Stable Aneurysms in a Longitudinal Study of 93 Cases
- Hemodynamic Characteristics of Ruptured and Unruptured Multiple Aneurysms at Mirror and Ipsilateral Locations
- Angioarchitectures and Hemodynamic Characteristics of Posterior Communicating Artery Aneurysms and Their Association with Rupture Status
- REPLY:
- Differences in Hemodynamics and Rupture Rate of Aneurysms at the Bifurcation of the Basilar and Internal Carotid Arteries
- Flow Conditions in the Intracranial Aneurysm Lumen Are Associated with Inflammation and Degenerative Changes of the Aneurysm Wall
- Hemodynamic characteristics of large unruptured internal carotid artery aneurysms prior to rupture: a case control study
- Hemodynamics in growing and stable cerebral aneurysms
- Hemodynamic-morphological discriminant models for intracranial aneurysm rupture remain stable with increasing sample size
- Hemodynamic Differences in Intracranial Aneurysms before and after Rupture
- Guidelines for the Management of Patients With Unruptured Intracranial Aneurysms: A Guideline for Healthcare Professionals From the American Heart Association/American Stroke Association
- Rupture Resemblance Score (RRS): toward risk stratification of unruptured intracranial aneurysms using hemodynamic-morphological discriminants
- Effect of aneurysm and ICA morphology on hemodynamics before and after flow diverter treatment
- MR Imaging of Myeloperoxidase Activity in a Model of the Inflamed Aneurysm Wall
- Morphologic and hemodynamic analysis of paraclinoid aneurysms: ruptured versus unruptured
- CFD: Computational Fluid Dynamics or Confounding Factor Dissemination? The Role of Hemodynamics in Intracranial Aneurysm Rupture Risk Assessment
- High WSS or Low WSS? Complex Interactions of Hemodynamics with Intracranial Aneurysm Initiation, Growth, and Rupture: Toward a Unifying Hypothesis
- Computational fluid dynamics simulation of an anterior communicating artery ruptured during angiography
- Mind the Gap: Impact of Computational Fluid Dynamics Solution Strategy on Prediction of Intracranial Aneurysm Hemodynamics and Rupture Status Indicators
- Quantifying the Large-Scale Hemodynamics of Intracranial Aneurysms
- Wall Shear Stress Distribution of Small Aneurysms Prone to Rupture: A Case-Control Study
- Review of Cerebral Aneurysm Formation, Growth, and Rupture
- Analysis of Morphologic and Hemodynamic Parameters for Unruptured Posterior Communicating Artery Aneurysms with Oculomotor Nerve Palsy
- Computational fluid dynamics simulation of an anterior communicating artery ruptured during angiography
- Thrombosis Heralding Aneurysmal Rupture: An Exploration of Potential Mechanisms in a Novel Giant Swine Aneurysm Model
- Low Wall Shear Stress Is Independently Associated With the Rupture Status of Middle Cerebral Artery Aneurysms
- Effect of Bifurcation Angle Configuration and Ratio of Daughter Diameters on Hemodynamics of Bifurcation Aneurysms
- Analysis of Intra-Aneurysmal Flow for Cerebral Aneurysms with Cerebral Angiography
- Counterpoint: Realizing the Clinical Utility of Computational Fluid Dynamics--Closing the Gap
- 1-Hexyl n-cyanoacrylate compound (Neucrylate™ AN), a new treatment for berry aneurysm. III: Initial clinical results
- Reply: