
Abstract
BACKGROUND AND PURPOSE: The identification of plaque characteristics that determine its vulnerability is extremely important. The purpose of this work was to evaluate CPE after administration of contrast material and to assess whether there is a statistical association between CPE and cerebrovascular symptoms.
MATERIALS AND METHODS: Ninety-seven consecutive patients (69 men, 28 women; mean age, 62 years; age range, 39–82 years), studied by using an MDCT scanner, were retrospectively analyzed. Examinations were performed before and after administration of contrast medium. Plaque enhancement was analyzed, and the obtained data were compared with the patient's symptoms. Patients were classified as symptomatic (TIA or stroke with a temporal window of 6 months) or asymptomatic according to neurologic assessment and the TOAST criteria. The ROC curve and Az were calculated, and multiple logistic regression analysis was performed.
RESULTS: Thirty-nine patients were excluded because they had calcified plaques (40.2%). CPE was observed in 74% of the remaining 58 patients. A statistically significant difference was observed between symptomatic and asymptomatic patients for the presence of CPE (P = .0013; OR = 7.5). Moreover, we observed that CPE was higher in fatty plaques (P = .035) than in mixed ones and more frequent in the former (P = .0119). The ROC curve demonstrated that a threshold of 15 HU is associated with a specificity and sensitivity of 83.33% and 76.47%, respectively. Multiple logistic regression showed that CPE and symptoms are associated (P = .0315).
CONCLUSIONS: The results of our study suggest that for noncalcified carotid plaques, the presence of CPE is associated with cerebrovascular symptoms. Fatty plaques are more likely to have CPE compared with mixed plaques.
Abbreviations
- Az
- area under the ROC
- CAD
- coronary artery disease
- CI
- confidence interval
- CPE
- carotid plaque enhancement
- HU
- Hounsfield Units
- ICA
- internal carotid artery
- +LR
- positive likelihood ratio
- −LR
- negative likelihood ratio
- MDCT
- multidetector row CT
- MDCTA
- multidetector row CT angiography
- NASCET
- North American Symptomatic Carotid Endarterectomy Trial
- NC
- not calculable
- ROC
- receiver operating characteristic
- TIA
- transient ischemic attack
- TOAST
- Trial of Org 10172 in Acute Stroke Treatment
- US
- sonography
Atherosclerotic disease in the carotid artery is an important cause of ischemic stroke, which, in turn, represents the second highest cause of mortality worldwide and the third highest cause of permanent disability.1–3 Atherosclerosis affecting the extracranial ICAs is a common treatable cause of symptomatic cerebral vascular disease, and currently most surgeons/interventional radiologists base their decision to intervene primarily on the degree of stenosis.4,5
Several studies have demonstrated the relationship between lesion type progression and clinical events, which has led to efforts to characterize the types of lesions present, not only in terms of degree of stenosis but also with regard to the composition and morphology of the plaque.6–11 In fact, carotid plaques may be associated with compensatory remodelling that normalizes the area of the vessel lumen, making quantification of carotid stenosis unsuitable for determining the risk of stroke.12,13 It is hypothesized that neovascularization as well as inflammatory changes in the carotid plaque accompany the processes that lead to plaque rupture.14,15
Previous studies by using MR imaging and US have tried to analyze the relationship between plaque enhancement, histology, and cerebrovascular symptoms and have demonstrated that enhancement of the carotid plaque is a complex issue16–18; it is not only plaque areas that are rich in neovascularization and inflammation that enhance but also the fibrous cap, so it is not clear whether enhancement ipso facto is a good marker of plaque instability.
Current high-speed MDCT scanners enable evaluation and measurement of the carotid lumen and provide detailed information about plaque morphology,7–12 but we are not aware of studies performed to analyze the arterial enhancement of plaques by using MDCT, with the exception of an article by Romero et al,19 which analyzed arterial wall enhancement.
The purpose of this work was to evaluate CPE after administration of contrast material and to assess whether there is a statistical association between CPE and cerebrovascular symptoms.
Materials and Methods
Patient Population
In our institute, we created a data base from retrospective case material and then searched the data base prospectively as a hypothesis-driven scientific study. Ninety-seven consecutive patients (69 men, 28 women; mean age, 62 years; age range, 39–82 years) who were examined with MDCTA from October 2008 to July 2009 were included in this study. Each patient underwent MDCTA for suspected carotid artery pathology. The inclusion criteria for performing MDCTA in our institution have previously been published and are as follows: the presence of an US examination that showed a pathologic stenosis (NASCET stenosis of >50% or the presence of a blood flow velocity of >1.2 m/s) and/or a plaque alteration; or cases in which US cannot provide sufficient information about the degree of stenosis and plaque type—for example, in the presence of large calcified plaques with acoustic shadowing, high carotid bifurcation, or a thick neck (edema, obese patients).20,21 “Plaque alteration,” as visualized by US, was considered as the presence of a heterogeneous plaque, homogeneous soft plaque, an irregular surface, intraplaque hemorrhage, and/or the presence of ulceration in the plaque. In US analysis, we considered an “intraplaque hemorrhage” to be the presence of a plaque containing an echo-poor area.22 The exclusion criterion for the MDCTA examination was a known allergy to iodinated contrast material or elevated renal function test findings.
Those patients with a potentially confounding condition (ie, suspected embolism from a cardiac source, follow-up after carotid endarterectomy, intracerebral aneurysms, brain tumors) or with posterior cerebrovascular symptoms were not included in this study. Patients with lacunar strokes were also excluded.
This retrospective review evaluated existing clinical data and records. No additional procedures were performed. The review was conducted in accordance with the guidelines of the research committee of our institution. Part of our patient cohort had taken part in previous studies.
Classification of Cerebrovascular Symptoms
Patients were classified as symptomatic or asymptomatic according to the neurologic assessment documented in the clinical chart review by using the TOAST criteria.23 We considered as “symptomatic” a patient with a TIA or stroke. TIA was regarded as a brief (<24 hours) episode of neurologic dysfunction, such as hemiparesis, hemiparesthesia, dysarthria, dysphasia, or monocular blindness. If the episode of neurologic dysfunction exceeded 24 hours, it was classified as a stroke. We considered a lacunar stroke to have occurred when the patient showed 1 of the traditional clinical lacunar syndromes and did not have evidence of cerebral cortical dysfunction. Such patients also had normal CT/MR imaging examination findings or a relevant brain stem or subcortical hemispheric lesion with a diameter of <0.5 cm. The time window for inclusion in the symptomatic group was 6 months; when a patient underwent an MDCTA examination >6 months after the TIA/stroke event, he or she was excluded from the symptomatic group and included in the asymptomatic group. We considered as “asymptomatic” a patient who had no present history of symptoms or who had a remote (>6 months) history of symptoms at the time of examination. In our institution, the carotid arteries of asymptomatic patients were studied in patients with diabetes who were older than 50 years of age and in patients who underwent cardiac interventions for CAD, aortic interventions, and lower leg artery surgery.
Cardiovascular Risk Factors
Cardiovascular risk factors, coexisting comorbidities, and treatment known before a stroke or TIA are systematically recorded in our institution, as described previously. In this study, we considered the following parameters: CAD, high blood pressure, dyslipidemia, diabetes, and cigarette smoking status. The presence of CAD was identified in the clinical charts of patients, and we considered the patient positive for CAD with the following criteria: 1) the presence of visible luminal narrowing of coronary arteries documented by coronary angiography or MDCTA, 2) a previous history of myocardial infarction, and 3) having undergone coronary interventional/surgical procedures. “Essential hypertension” was defined in those individuals who had a systolic blood pressure >140 mm Hg and/or diastolic blood pressure >90 mm Hg or were being treated with blood pressure−lowering drugs. “Dyslipidemia” was defined as abnormal fasting plasma cholesterol (low-attenuation lipoprotein cholesterol) levels (fasting cholesterol >5.0 mmol/L), or the current use of lipid-lowering agents. “Diabetes” was indicated by an abnormal fasting plasma glucose level (>7.9 mmol/L) or the current use of insulin or an oral hypoglycemic agent. Cigarette smoking status was categorized as never or current (if the patient had stopped smoking within the past 24 months he or she was considered a current smoker).
MDCTA Technique
All patients underwent MDCTA of the supra-aortic vessels by using a 40 MDCT system (Somatom Sensation; Siemens, Erlangen, Germany) and a previously described technique. A basal scan was obtained and was followed by the angiographic phase in which 80 mL of contrast medium (iomeprol, Iomeron 400; Bracco, Milan, Italy) followed by 30 mL of saline flush was injected into a cubital vein. A bolus-tracking technique was used to calculate the correct timing of the scan. CT technical parameters were as follows: 180–200 mAs; 120–140 kV; collimation, 40 × 0.6 mm. Images were reconstructed with a 150-mm FOV and a matrix size of 512 × 512 (real in-plane resolution 0.6 × 0.6 mm). Angiographic acquisition included the carotid siphon.
First Plaque Type Analysis (Contrast-Enhanced Phase)
Two radiologists performed all HU measurements. Window/level settings were usually at width, 850 HU; level, 300 HU, progressing to very wide settings in the case of attenuated calcifications.24,25 The observers were blinded as to whether the plaque they were analyzing was symptomatic. In the symptomatic patients, the carotid artery ipsilateral to the cerebrovascular symptoms was selected, whereas in the asymptomatic patients, the carotid artery with the largest luminal stenosis was selected. The degree of stenosis of each carotid artery was measured by using the NASCET criteria24–28 and was calculated by selecting a reformat plane perpendicular to the lumen centerline. We measured the diameter of the normal ICA wall beyond the bulb where walls are parallel,24–28 4–6 cm distal to the plaque, and the near-occlusion condition was identified by 2 criteria: 1) evidence of a narrowed poststenotic ICA, and 2) the poststenotic ICA being similar to or smaller than the ipsilateral external carotid artery. Next, we measured the diameter of the normal ICA wall beyond the bulb where walls are parallel,24–28 4–6 cm distal to the plaque.
In the first plaque-type analysis, we assessed only the contrast material dataset. A circular or elliptical region of interest (≥1 mm2) in the predominant area of the plaque was used to measure the HU value. Areas showing contamination by contrast material or calcification that did not contribute to the stenosis were avoided. Regions of beam-hardening in calcified areas were also excluded (Fig 1). Moreover, a note was made of the corresponding section to identify any differences between the observers in the choice of the plaque along the z-axis. The presence of plaque ulceration was also assessed and recorded; we considered plaque “ulceration” an irregularity or break in the surface of the plaque with a depth of at least 1 mm.9

A 67-year-old asymptomatic male patient. MDCT axial images before (A) and after (B) administration of contrast material. White arrows indicate the region of interest in the plaque. The red rectangle incorporates the region-of-interest area values, including area; and mean HU values, minimum and maximum.
Exclusion Analysis and Cohort Composition
Calcified plaques were excluded (n = 39) from the second plaque-type analysis; therefore, only fatty and mixed plaques were included. No patients were excluded because the region of interest was <1 mm2.
Second Plaque-Type Analysis (Precontrast Phase)
After the exclusion of 39 patients with calcified plaques, the remaining 58 patients were assessed further. The observers first selected the precontrast baseline MDCT dataset and after identified the section correspondent to the contrast-enhanced. To obtain a correct registration between the 2 datasets, they visually assessed whether the sections corresponded or whether it was necessary to select another section along the z-axis. The section used was recorded to calculate the difference between the basal and contrast phase along the z-axis. Following this “matching phase,” a region of interest of the same area as that used in the contrast phase was placed in the same position on the plaque to measure the basal HU value (Fig 1).
Contrast-Enhancement Measurement
To measure the HU enhancement in each carotid artery plaque, we considered the plaque HU values in precontrast and postcontrast material and calculated the difference in HU from the average value recorded by the 2 radiologists. As in previous studies,12,29 the plaques were classified as the following: 1) fatty plaque, a plaque with an attenuation of <60 HU; 2) mixed plaque, a plaque with an attenuation between 60 and 129 HU; and 3) calcified plaque, a plaque with a attenuation of >130 HU. This classification was based on the precontrast scan. In cases in which 50% of the plaque contained calcium components, we considered the plaque to be calcified. The amount of time taken by the 2 observers to perform the CPE analysis was recorded.
Statistical Analysis
The normality of each continuous variable group was tested by using the Kolmogorov-Smirnov Z-test. Continuous data were described as the mean value ± SD and were compared by using the Wilcoxon signed rank test. χ2 was used to test the hypothesis that the presence of symptoms is associated with the contrast enhancement of a plaque. Correlation coefficients (Pearson product moment) were calculated with 2-tailed significance to evaluate the interobserver agreement for all measurements. We evaluated plaque-enhancement concordance between observers by using a Bland-Altman analysis. The Student t test for unpaired samples was used to test the difference in plaque enhancement in the fatty plaque group versus the mixed plaque group and to test the difference between observers in the time required for CPE measurement. ROC curve analysis was performed to identify the contrast-enhancement thresholds (sensitivity and specificity) associated with symptoms, and the Az was calculated. Multiple logistic regression analysis was performed to determine the relationship between the presence of symptoms, contrast enhancement, degree of stenosis, and the other independent variables: hypertension, dyslipidemia, diabetes mellitus, smoking, type of plaque, and plaque ulceration. A P value < .05 was considered statistically significant. R software (www.r-project.org) was used for statistical analyses.
Results
General Results
Thirty-nine (40.2%) calcified carotid artery plaques were excluded, and in the remaining 58 plaques (30 fatty and 28 mixed plaques), CPE was observed in 42 (74%) cases. There were cerebrovascular symptoms in 34 patients (a prevalence of 58.6%). The χ2 test demonstrated a statistically significant difference between symptomatic and asymptomatic patients for the presence of CPE (P = .0013, OR = 7.5).
We observed that plaque enhancement was higher in fatty plaques (Student t test, P = .003) than in mixed ones; in fact, the mean enhancement was 23.23 ± 6.8 HU in the 26 fatty plaques that showed CPE and 16.18 ± 7.4 HU in the 16 mixed plaques that showed CPE. Moreover, we observed that CPE was more frequent in fatty plaques (86.7%, 26/30) than in mixed ones (57.14%, 16/28) (χ2, P = .0119, OR = 4.88).
Analysis of the relationship between the type of plaque (fatty and mixed) and the presence of cerebrovascular symptoms revealed a highly significant association between fatty plaques and symptoms, with a P value of .0016. The mean degree of stenosis was 63% in carotid arteries with fatty plaques and 68% in those with mixed plaques (P = .214), indicating that there is no statistically significant difference in the stenosis degree according to the plaque type. Symptomatic carotid arteries had a mean symptomatic stenosis of 74% compared with 53% in asymptomatic ones (P = .001), confirming that the symptomatic carotid arteries usually have a more severe degree of stenosis. A quite weak correlation between the degree of stenosis and CPE was detected (Pearson ρ = 0.2581, P = .0505).
For HU measurements, the observers used an elliptic or circular region of interest of at least 1 mm2 (mean value, 2.3 ± 0.86 mm2; range, 1–4.2 mm2). No statistically significant difference was observed between the region-of-interest area measured by observer 1 and observer 2 (Wilcoxon signed rank test, P = .74; Fig 2), and the correlation between the 2 was extremely high (Pearson ρ = 0.954). The differences in the z-axis regarding section selection for the measurement of HU varied from 0.5 to 2.5 mm (mean value, 0.65 ± 0.18 mm).
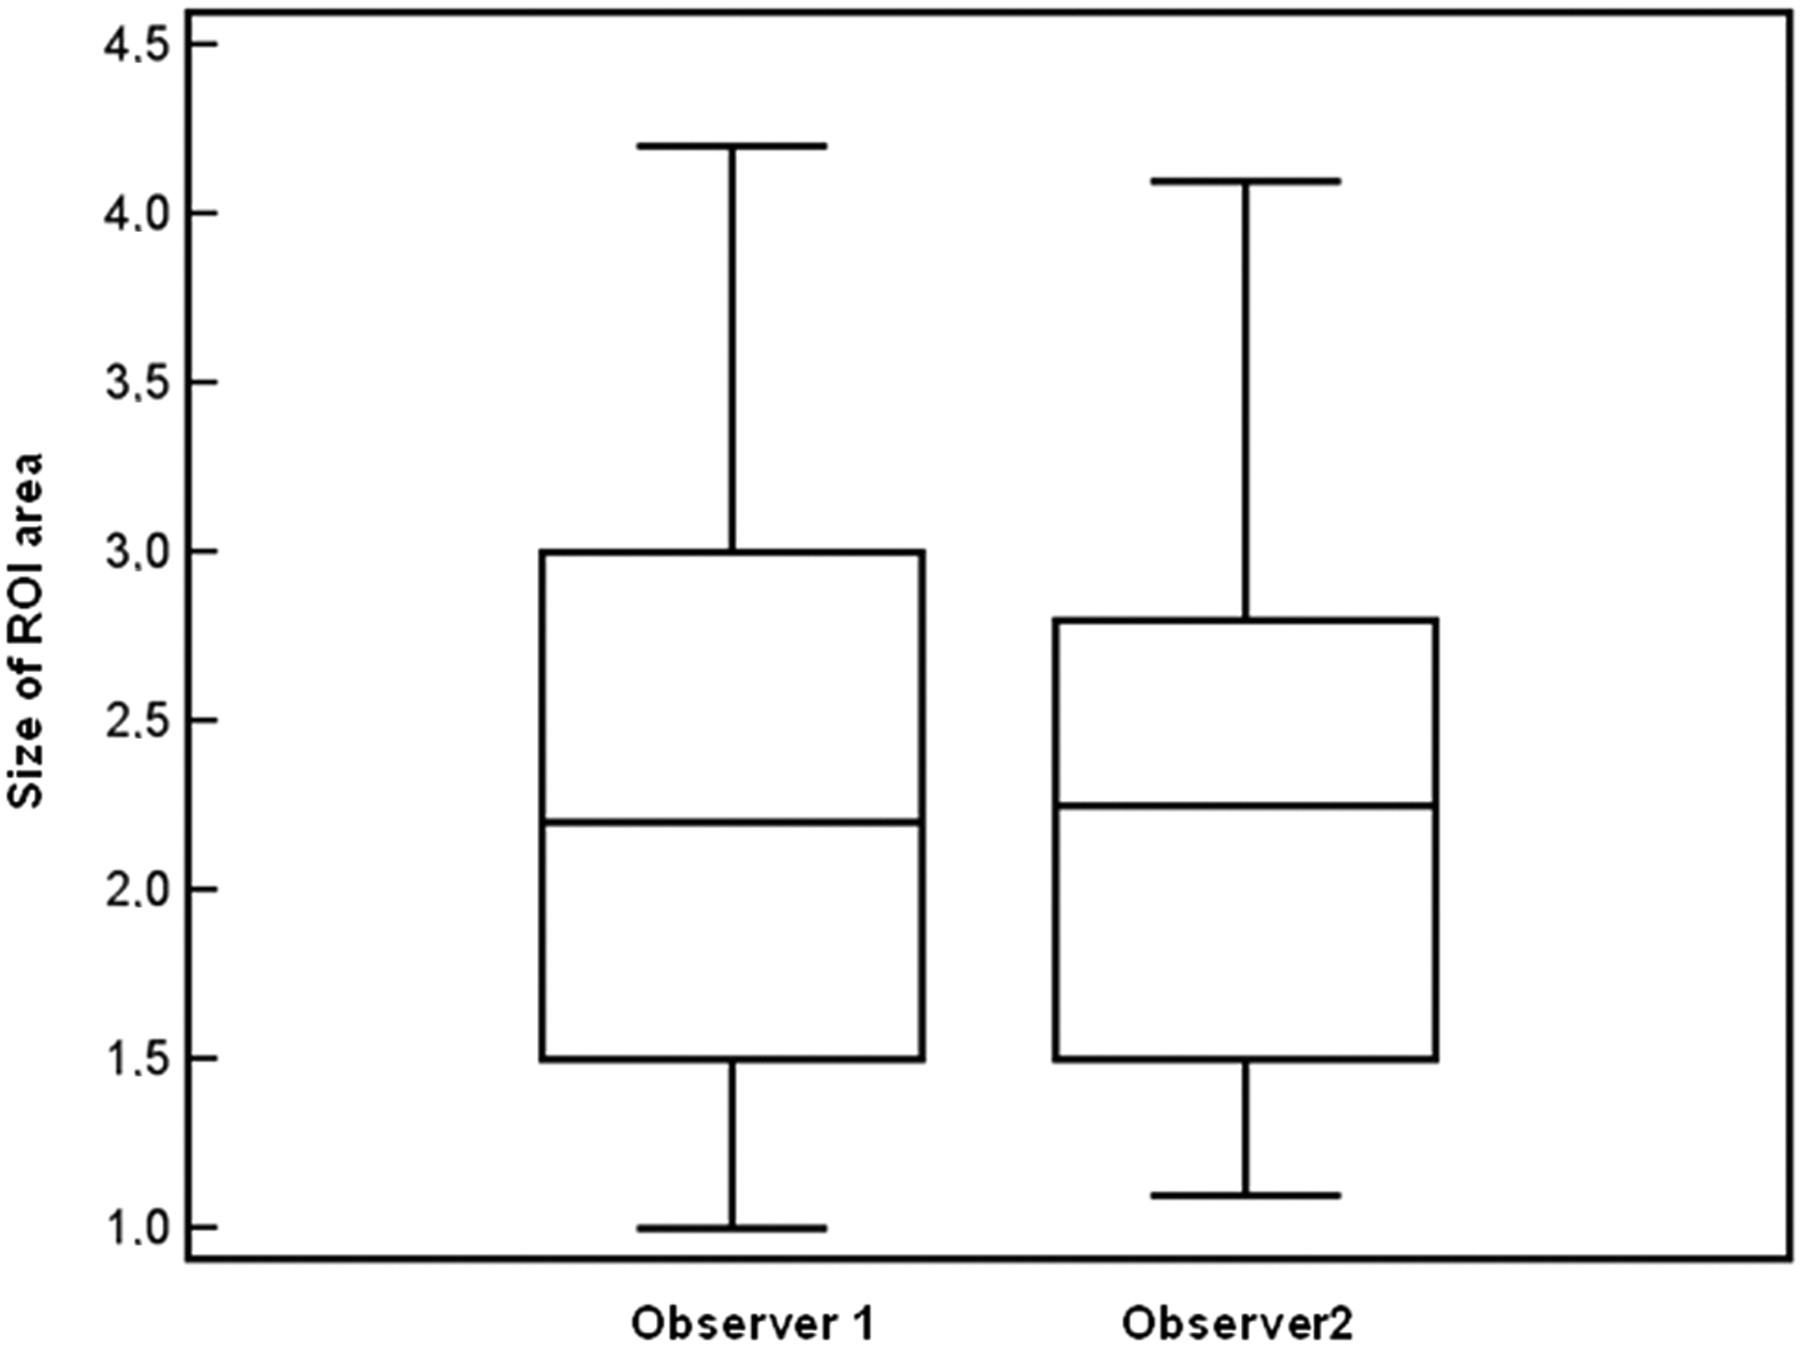
Box-and-whisker plot between the observers for the region-of-interest area quantification.
For CPE measurements, we calculated the average values recorded by the 2 radiologists. We observed a strong correlation according to linear regression between the 2 observers (Spearman ρ correlation coefficient = 0.8296; P < .001). The Bland-Altman plot is shown in Fig 3.

Interobserver variability in the HU plaque enhancement.
The amount of time required for plaque analysis was 5.05 minutes for observer 1 and 4.86 minutes for observer 2, with no significant difference between the 2 (P = .448).
ROC Curve Analysis
In the ROC analysis (Fig 4), we calculated the sensitivity, specificity, and +LR and −LR values, and a summary of these is given in Table 1. The area under the curve was 0.816 ± 0.055 (P = .0001). By analyzing threshold values, we observed that a plaque enhancement of 15 HU seems to be a well-balanced threshold between sensitivity and specificity, and it is associated with a specificity of 83.33% and a sensitivity of 76.47% (for the presence of cerebrovascular symptoms). Fifteen HU is associated with a specificity of 62.5% and a sensitivity of 85.29%, 20 HU is associated with a specificity of 89.6% and a sensitivity of 61.35%, and 30 HU is associated with a specificity of 95.83% and a sensitivity of 14.71%,

ROC curve analysis between HU plaque enhancement and cerebrovascular symptoms.
ROC curve analysis
Logistic Regression Analysis
The results of the multiple logistic regression analysis are presented in Table 2. A statistically significant association between plaque enhancement and symptoms (P = .0315) and between fatty plaques and symptoms (P = .0423) was observed. A statistical association was also detected between symptoms and the carotid artery stenosis (NASCET > 70%; P = .0366). Other variables showed no statistically significant association, with the exclusion of a statistical trend for hypertension (P = .688). Therefore, from the logistic regression analysis, the independent predictors of symptoms were CPE, the degree of stenosis, and the presence of a fatty plaque.
Multiple logistic regression analysis
Discussion
There is a working hypothesis that the rupture of so-called vulnerable carotid atherosclerotic plaques can lead to many acute cerebrovascular events; for this reason, the identification of carotid plaque characteristics by using noninvasive methods is of major clinical interest.30 Our results reveal 3 major points: 1) Carotid plaques, and in particular symptomatic carotid plaques, show enhancement; 2) a basal scan should be performed to study the characteristics of plaque enhancement; and 3) the plaque type (fatty, mixed) changes according to the phase (basal scan or postcontrast scan) and should probably be determined from the baseline scan.
Our results demonstrate that CPE is associated with the presence of preceding cerebrovascular symptoms. This has important clinical implications because such data may be used to stratify plaque risk, while identifying the characteristics of vulnerable plaques is of utmost importance because of the high risk of precipitating acute thrombotic occlusion. The plaque enhancement that we observed may be attributed to neovascularization within the carotid plaque. The contrast agent that we used in MDCT (iomeprol; Iomeron 400) has a well-described rheology blood kinetic,31–33 which leads to enhancement where there are blood vessels, and has already been used to investigate brain tumor perfusion34,35 and angiogenesis.36 It has previously been demonstrated, by using different imaging techniques,17,18,37 that enhancement of carotid plaques with contrast material is correlated with the histologic attenuation of neovessels within the carotid plaque and that the cause of the enhancement is thought to be the increased vascularity of the adventitial vasa vasorum feeding the plaque neovasculature.17,18,37 Plaque neovascularization has been confirmed in histologic studies as a consistent feature of plaques in patients with cerebrovascular symptoms,38,39 and researchers have indicated that neovascularization is an important factor contributing to the vulnerability of atherosclerotic plaques.39,40 In fact, plaque neovascularization was found to be more extensive in symptomatic and vulnerable plaques.14,38,39 To our knowledge, this is the first study to compare patient symptoms and contrast-enhanced MDCT in atherosclerotic plaques, with the exception of an article by Romero et al,19 which analyzed arterial wall enhancement.
We observed that plaque enhancement is a relatively common phenomenon, with a prevalence of 74% in our cohort, and that 50% (12/24) of patients without symptoms also showed CPE. In our opinion, this is an interesting point because it demonstrates that enhancement is possible even in “stable” asymptomatic plaques, whereas it is extremely prevalent in “unstable” symptomatic plaques (in this study, 88% [30/34] of patients with symptoms showed enhancement).
Previous studies have demonstrated that several plaque components may show enhancement (plaque areas rich in neovascularization, the fibrous cap, and the carotid wall), indicating that plaque enhancement is a complex problem, and our study confirms that the presence of enhancement ipso facto is not a good marker of plaque instability (in our study, 50% of patients without symptoms showed CPE). A possible solution involves measuring the degree of enhancement. By using MDCT, one can reliably quantify HU variation in tissues, and the ROC analysis indicated that 15 HU may represent a suitable threshold for considering the CPE as symptomatic. To reach a higher sensitivity (85.29%), one could use 10 HU as a threshold. In our opinion, the use of a threshold value <10 HU should not be used because the specificity becomes too low (Table 1).
Several researchers have studied carotid arteries in the angiographic phase only,12,25 but our results indicate that the use of a basal scan may play a significant role in the analysis of carotid plaques because it allows calculating the CPE of the plaque, which may represent a valuable parameter identifying the plaque vulnerability. The ROC analysis demonstrated a good association (Az = 0.816) between the degree of contrast enhancement and patient symptoms. These data are concordant with Coli et al,17 who demonstrated, by using a semiquantitative visual analysis in US, that the degree of contrast enhancement was highly correlated with the attenuation of neovessels in the plaque. Moreover, we observed that the entity of enhancement is different in fatty (mean CPE, 23.23 HU) and mixed (16.18 HU) plaques. From these results, it is possible to hypothesize that when measuring the HU value of a carotid plaque after administration of contrast material, the degree of neovascularization, other than the histologic composition, plays a significant role. For this reason, we think that plaque type analysis should be performed in the precontrast scan, when there is no contrast enhancement effect.
We also observed that enhancement is more frequent in fatty plaques than in mixed ones (P = .0119). This was an unexpected finding, and in fact, de Weert et al29,41 demonstrated that fatty plaques (attenuation, <60 HU) are associated with the presence of a lipid, hemorrhage, or necrotic debris; and Yuan et al42 and Wasserman et al,43 in MR imaging studies, observed that enhancement was related to the presence of fibrous tissue. However, our results are concordant with the study of de Boer et al,44 which indicated that lipid-rich plaques had more neovasculature. Moreover, we observed that plaque enhancement was greater in fatty plaques (Student t test, P = .003) than in mixed plaques, and this finding was concordant with those of Xiong et al18 and Coli et al,17 who found that soft plaques have a greater enhancement in US than other types of plaque.
The multiple logistic regression analysis confirmed that CPE (by using 15 HU as the threshold) is statistically associated with cerebrovascular symptoms. Moreover, the degree of stenosis showed a statistically significant association with cerebrovascular symptoms. To include the degree of stenosis in the logistic model as a dichotomous variable, we considered severe stenosis to be a NASCET percentage luminal narrowing of ≥70% (in the case of discrepant values between the 2 observers [ie, 68% and 72%], the discrepancy was solved in consensus; moreover, 2 cases of detected near-occlusion were considered as severe stenosis). This is certainly a simplification of the statistical model, but the purpose of this multiple logistic regression was to evaluate plaque enhancement and not the impact of the different degrees of carotid stenosis. The logistic regression analysis also confirmed the statistically significant association between fatty plaques and cerebrovascular symptoms. These results indicate that 3 independent elements seem to play a role in the development of cerebrovascular symptoms: degree of stenosis, CPE, and type of plaque (fatty plaque). Moreover, there was a trend toward an association between symptoms and hypertension. Other variables showed no statistically significant association.
To measure the HU, we used a circular or elliptic region of interest (≥1 mm2), and radiologists were free to choose the size and morphology of the region of interest. They were instructed to trace a region of interest as large as possible, trying to avoid areas showing contamination by contrast material or calcification. Most interesting, there was no significant difference between the area of the regions of interest measured by observer 1 and observer 2 (Fig 2), indicating that region-of-interest tracing is a highly reproducible procedure. This was an unexpected result because we hypothesized that the reproducibility of the region-of-interest area may be suboptimal. However, it is our opinion that these results should be further tested in reproducibility studies to confirm our results.
To obtain plaque enhancement values, we calculated the average values of enhancement recorded by the 2 radiologists. We observed a good correlation according to linear regression (Spearman ρ correlation coefficient = 0.8296, P < .001), and the Bland-Altman plot indicated good concordance. The amount of time required for plaque analysis was approximately 5 minutes for both observers (with no significant differences between the 2). In our experience, the procedure used to select and measure the CPE is quite fast, and after initial training, the observers had no difficulties in performing this procedure.
We should discuss 2 further points: CPE localization and enhancement time. In this work, no attempt was made to localize differences in CPE within the cross-sectional images because of the limited spatial resolution of the CT scanner. However, the location of CPE within the plaque may be important because focal CPE may indicate an area of vulnerability.44 The second point concerns the enhancement time: Due to the retrospective nature of this study, we only acquired precontrast and arterial phases, and the CPE analysis was, therefore, based on measurements made from 13 to 24 seconds (mean, 15 ± 4 seconds) after the injection of contrast material. It is possible that the enhancement rate may be an important parameter and should be investigated; in fact some authors37 have hypothesized that slowly enhancing regions are likely to indicate areas with considerable amounts of loose matrix.
In this article, calcified plaques were excluded because their HU values are usually extremely high (>500) with a high variability in the SD of the HU values. This means that only a small spatial difference in region-of-interest position can markedly change the HU value in calcified plaques. This can dramatically affect the measurement of HU variation due to the enhancement, because the variation is probably due to the positional mismatch between the basal and postcontrast scans. The second reason we excluded the calcified plaque is that calcium has a very high linear attenuation coefficient and this may determine artifacts.
There were several limitations in this study. First, it was a retrospective analysis. However, we used the same hardware, techniques, operators, and data standardization throughout, so the variability in the retrospective analysis should have been minimized. Second was the registration problem; in our analysis, it was difficult to ensure the correct registration between the precontrast scan and the postcontrast material scan. In fact breathing and deglutition can alter the position of the carotid artery and change the z-position of the sections between the basal and contrast phases. We tried to manually record the exact section in the 2 phases, but this may have led to bias. Third, the analysis of the relationship between the degree of stenosis and the CPE showed a statistical trend (Pearson ρ = 0.2581, P = .0505); however, our patient cohort was quite small, and this association should be explored further in a larger patient population to confirm this observation. Fourth, the region of interest we used (≥1 mm2) represents an averaged value between voxels of different HU (some of these in the HU ranges of fatty plaques and others in the HU ranges of mixed plaques), and this approach may lead to bias. It would be more appropriate to consider each subcomponent (fatty, mixed, and calcified) for each plaque, but this approach requires semiautomated plaque analysis systems.
Conclusions
The results of our study indicate that CPE is associated with the presence of preceding cerebrovascular symptoms and that a threshold of 15 HU provides good specificity. Moreover, fatty plaques are more likely to have CPE compared with mixed plaques, strengthening the hypothesis that fatty plaque should be considered as “vulnerable.”
Acknowledgments
The authors are deeply indebted to Professor Allan J. Fox for his help and advice.
References
- Received January 20, 2011.
- Accepted after revision February 14, 2011.
- © 2011 by American Journal of Neuroradiology
In this issue


Jump to section
Related Articles
Cited By...
- Assessment of Attenuation in Pericarotid Fat among Patients with Carotid Plaque and Spontaneous Carotid Dissection
- Perivascular Fat Density and Contrast Plaque Enhancement: Does a Correlation Exist?
- Carotid Artery Wall Imaging: Perspective and Guidelines from the ASNR Vessel Wall Imaging Study Group and Expert Consensus Recommendations of the American Society of Neuroradiology
- CT Attenuation Analysis of Carotid Intraplaque Hemorrhage
- Correlation between Fissured Fibrous Cap and Contrast Enhancement: Preliminary Results with the Use of CTA and Histologic Validation
- Carotid Artery Plaque Characterization Using CT Multienergy Imaging
- Association between Carotid Artery Plaque Type and Cerebral Microbleeds
- Carotid Artery Plaque Classification: Does Contrast Enhancement Play a Significant Role?