
Abstract
BACKGROUND AND PURPOSE: The m.3243A>G mutation is the most common pathogenic mutation in mtDNA; tissues with high dependence on aerobic energy metabolism, such as the brain, heart, and skeletal muscle, are most affected by the ensuing mitochondrial dysfunction. We hypothesized that the m.3243A>G mutation manifests as disturbances in white matter microstructural integrity and volumetric changes in the brain.
MATERIALS AND METHODS: DTI and structural MR imaging were performed on 15 adult patients with the m.3243A>G mutation and 14 healthy age-matched controls. Voxelwise analysis of the DTI data was performed to reveal possible differences in FA and MD values. Additionally, normalized brain tissue volumes of the subjects were measured, and voxelwise analysis of gray matter was performed to assess volumetric changes in the brain.
RESULTS: Among patients with m.3243A>G mutation, voxelwise analysis of the DTI data revealed significantly reduced FA in several areas located mainly in the occipital lobes, thalami, external and internal capsules, brain stem, cerebellar peduncles, and cerebellar white matter. There were no differences in MD values between the patients and the controls. Analysis of the structural MR imaging data revealed reduced total volume of gray and white matter in patients with m.3243A>G mutation, and VBM analysis identified areas of significant gray matter loss mainly in the occipital lobes and cerebellum.
CONCLUSIONS: Our findings show that patients with m.3243A>G mutation have mild microstructural damage leading to loss of directional organization of white matter and reduced brain volumes.
Abbreviations
- BET
- Brain Extraction Tool
- DTI
- diffusion tensor imaging
- FA
- fractional anisotropy
- FDT
- FMRIB Diffusion Toolbox
- FSL
- FMRIB Software Library
- fMRI
- functional MR imaging
- FMRIB
- Functional MR Imaging of the Brain
- FNIRT
- FMRIB Nonlinear Image Registration Tool
- mtDNA
- mitochondrial DNA
- MD
- mean diffusivity
- MELAS
- mitochondrial encephalomyopathy, lactic acidosis, and strokelike episodes
- MNI152
- Montreal Neurologic Institute 152
- SENSE
- sensitivity encoding
- SIENAX
- structural image evaluation, with normalization of atrophy
- TBSS
- tract-based spatial statistics
- VBM
- voxel-based morphometry
Mitochondrial disorders frequently affect the central nervous system because of its strong dependence on oxidative metabolism.1 The most common pathogenic mutation in mtDNA is m.3243A>G, with estimates of prevalence ranging from 18/100,000 to 0.24%.2–6 It is also the most common mutation causing the MELAS syndrome.7 The main clinical characteristics of the classic MELAS syndrome are myopathy, strokelike episodes, lactic acidosis, and encephalopathy leading to seizures. The most commonly described neuropathologic features of the MELAS syndrome are multifocal necrotic foci in the cerebral cortex and predominantly subcortical white matter gliosis.8,9 However, the classic MELAS syndrome is relatively rare, and most patients with m.3243A>G mutation present with other symptoms of mitochondrial disease, such as sensorineural hearing impairment, diabetes mellitus, myopathy, or cognitive impairment.10 The large variation in the clinical phenotypes is at least partly due to heteroplasmy of the mutation (ie, the co-occurrence of the 2 alleles within mitochondria, cells, and tissues). Thus, the proportion of the mutated mtDNA varies across patients and tissues11 and contributes to the phenotype.
DTI is a relatively new MR imaging technique, which can be used to study white matter integrity. With DTI, quantitative measurements, such as FA and MD of white matter tracts, can be acquired. DTI has been shown to detect brain white matter tract damage that cannot be visualized by conventional MR imaging techniques.
DTI findings have been reported in a few patients with mitochondrial disease12–14 but not in a group of patients with m.3243A>G. Therefore, we aimed to investigate whether disturbances in brain microstructural integrity can be demonstrated in patients with the m.3243A>G mutation. Here we performed a voxelwise comparison of the FA and MD values between 15 patients with m.3243A>G and 14 age-matched controls. We also analyzed the differences in brain volumes between these 2 groups.
Materials and Methods
Subjects
Study participants comprised 15 patients (mean age, 47 years; range, 31–64 years; 4 men, 11 women) with the m.3243A>G mutation and 14 healthy age-matched controls (mean age, 47 years; range, 31–64 years; 2 men, 12 women). Written informed consent was obtained from the study participants. The study protocol was approved by the Ethics Committee of the Hospital District of Southwest Finland. Control subjects were recruited with a newspaper advertisement.
A neurologic examination and an assessment of medical history revealed that the most common clinical manifestation among the patients was diabetes (n = 9). Six patients had chronic neurologic or neuropsychological symptoms, while 9 patients were considered neurologically asymptomatic. Only 1 patient with m.3243A>G fulfilled the diagnostic criteria of the MELAS syndrome.15 Controls were free from neurologic ailment. None of the patients or controls had any acute neurologic symptoms during the examinations or MR imaging data acquisition. The m.3243A>G mutation heteroplasmy was determined from the buccal epithelium.6 The proportion of mutated mtDNA in patients with m.3243A>G varied between 18% and 91%.
MR Imaging Data Acquisition
DTI and conventional MR imaging were performed by using a Gyroscan Intera 1.5T CV Nova Dual scanner (Philips Healthcare, Best, the Netherlands) with a SENSE head coil.
Axial DTI images were acquired by using a single-shot echo-planar imaging sequence. The imaging parameters were as follows: TE, 89 ms; TR, shortest possible to accommodate the necessary number of sections for full brain coverage (5451–5616 ms); echo-planar imaging factor, 111; FOV, 240 mm; rectangular FOV, 100%; scan percentage, 100%; number of signal-intensity averages, 2; SENSE factor, 2. The b-values for diffusion weighting were 0, 600 and 1200 s/mm2, with 16 gradient-encoding directions. Spectral presaturation with inversion recovery was used for fat suppression. Section thickness was 3 mm with an intersection gap of 1 mm. Data were obtained with a matrix size of 112 × 112 and reconstructed to a matrix size of 256 × 256. The imaging voxel size was 2.14 × 2.16 × 3.00 mm, and the reconstructed voxel size was 0.94 × 0.94 × 3.00 mm.
In addition to the DTI images, the imaging protocol included an axial thin-section 3D T1-weighted gradient-echo sequence (TR, 25 ms; TE, 5.5 ms; flip angle, 30°). The section thickness for the 3D T1 images was 1.60 mm, with −0.80 mm intersection gap (ie, overlapping sections).
Image and Data Analysis
Computer analysis of the image data was performed by using the FSL toolbox (FMRIB Software Library, Version 4.1; FMRIB, Oxford, United Kingdom). FSL is a comprehensive library of analysis tools for fMRI, MR imaging, and DTI brain imaging data,16,17 mainly written by members of the Analysis Group, FMRIB. All the tools mentioned below (TBSS, FDT, BET, FNIRT, randomise, fslstats, SIENAX, and FSL-VBM) are part of FSL. Image processing was also performed by using MRIcron (http://www.cabiatl.com/mricro/mricron/index.html).
Analysis of the FA data was performed by using the TBSS tool.18 The raw diffusion data were first corrected for the effects of eddy currents. Then, the FA images were created by using FDT, and automatic brain extraction was performed by using the BET.19 Next, a nonlinear registration by using FNIRT20–22 was run, aligning all subjects' FA images into a common space, and a mean FA image of all subjects was created. This mean FA image was then thinned to create a mean FA skeleton, representing the centers of all tracts common to all subjects. Aligned FA images of each subject were then projected onto this skeleton for voxelwise cross-subject statistics.
Analysis of the MD data was performed by applying a nonlinear registration to the data and projecting these data onto the original mean FA skeleton, by using the FA data to find the projection vectors; the resulting data were used for voxelwise analysis.
In addition, the mean skeleton FA and MD values of each subject were calculated, by using the fslstats program.
Brain-tissue volumes of the subjects, normalized for head size, were estimated by using the SIENAX tool.23 The 3D T1-weighted images were used for this particular analysis. First, brain and skull images were extracted from the data.19 Then, the extracted brain images were registered to the MNI152 (Montreal Neurologic Institute, Montreal, Quebec, Canada) space.24,25 Finally, a tissue-type segmentation procedure26 was carried out, resulting in estimates of total brain tissue volume, gray matter volume, and white matter volume.
Regional differences in gray matter volume were analyzed by VBM, by using the FSL-VBM tool.27,28 The 3D T1-weighted images were also used for this analysis. First, brain extraction was carried out,19 and the brain images were segmented into gray matter, white matter, and CSF.26 The resulting gray matter images were then aligned to the MNI152 standard space,24,25 and these images were then averaged to create a study-specific gray matter template. The native gray matter images were then nonlinearly re-registered to the template and modulated to correct for local expansion or contraction. The modulated images were then smoothed with an isotropic Gaussian kernel with a ς of 3 mm, and the resulting data were used for voxelwise analysis.
Statistical Analysis
Voxelwise analysis of the FA, MD, and structural imaging data was performed by means of permutation-based inference (5000 permutations) by using a threshold-free cluster enhancement method29 and correction for multiple comparisons. The randomise tool (FMRIB) was used for the analysis.
Additional statistical analysis was performed by using Prism software, Version 5 (GraphPad Software, San Diego, California). The nonparametric Mann-Whitney U test was used to analyze the differences in brain tissue volumes, measured with SIENAX, between patients with m.3243A>G and the controls. The Mann-Whitney U test was also used for differences in mean skeleton FA and MD values, calculated with fslstats, between the 2 groups. A result with P < .05 was considered statistically significant. To assess the possible correlation between the FA values and the m.3243A>G heteroplasmy, we determined a Spearman correlation coefficient between these 2 parameters.
Results
Mean MD, FA, and TBSS Analysis
The mean skeleton MD values did not differ significantly between patients with m.3243A>G (mean, 0.639 × 10⁻³ mm2/s; SD, 0.069) and the controls (mean, 0.615 × 10⁻³ mm2/s; SD, 0.021) (P = .95). The mean skeleton FA values were slightly but not significantly lower among patients with m.3243A>G (mean, 0.487 ± 0.014) than among the controls (mean, 0.513 ± 0.042) (P = .13). There was no correlation between the proportion of the m.3243A>G mutations and the mean skeleton FA values of the patients (Spearman correlation coefficient r = −0.235; P = .42).
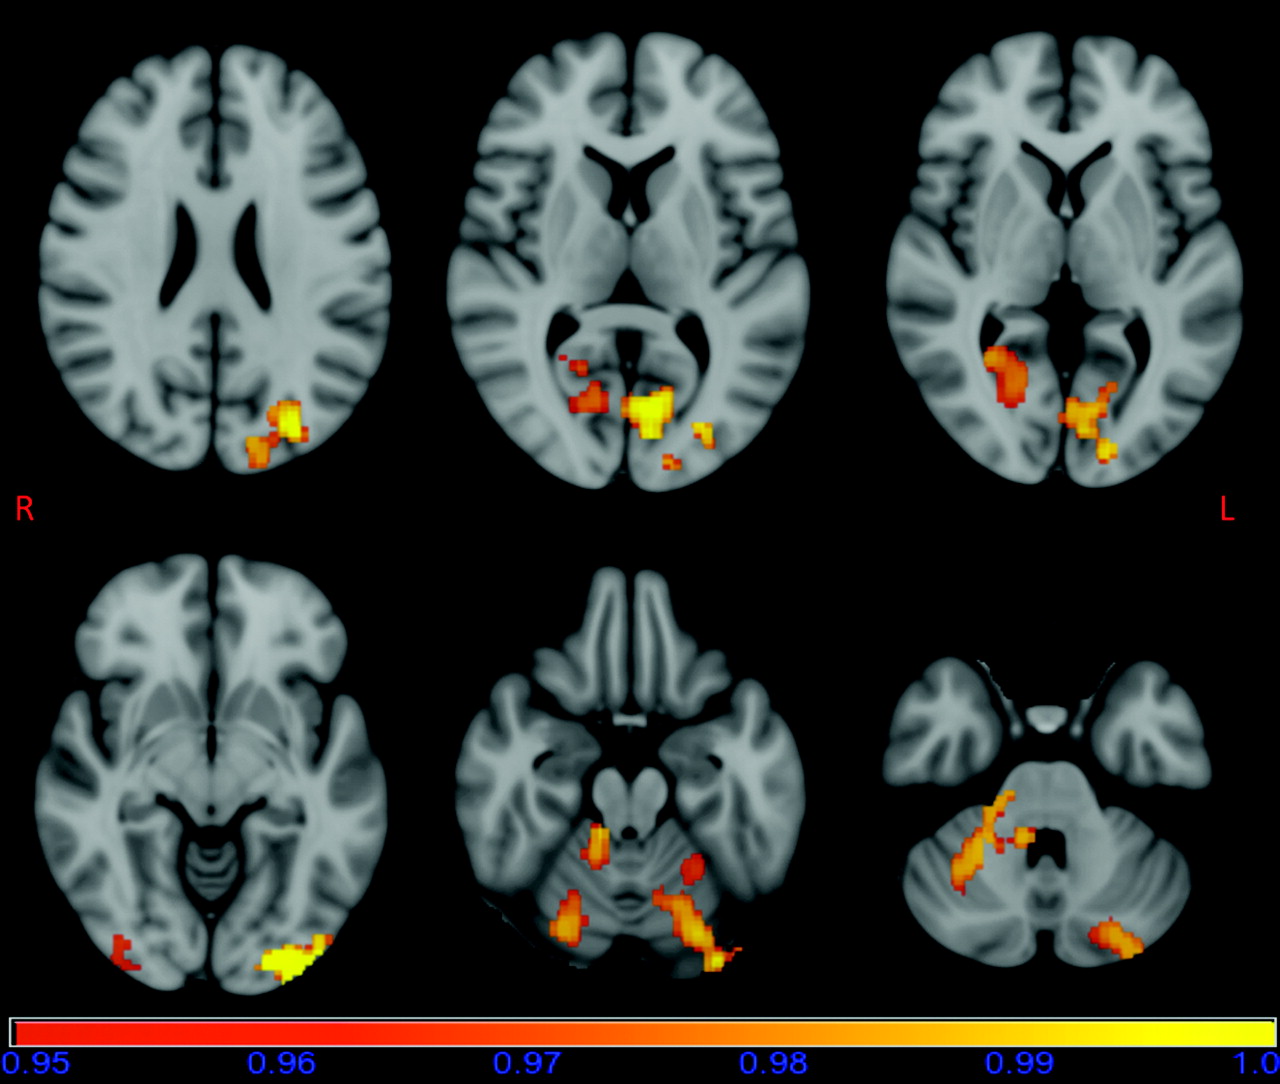
Most interesting, voxelwise TBSS analysis revealed regions of decreased FA values in patients with m.3243A>G compared with those in the controls (P < .05, fully corrected for multiple comparisons). Areas of reduced FA were seen bilaterally in occipital parts of the inferior longitudinal fasciculi, thalami, external capsules; the posterior limbs of internal capsules, mesencephalon, pons, superior, middle and inferior cerebellar peduncles; cerebellar white matter, and medulla oblongata (Fig 1). In addition, areas of decreased FA were seen in the tracts of the forceps major, the temporal part of the inferior longitudinal fasciculus, and the dorsal cingulum on the left side. Regional increases in the FA values of patients with m.3243A>G were not found.

Results of the TBSS analysis of the FA data overlaid on a standard MNI152 image. Areas of reduced FA in patients with m.3243A>G are seen bilaterally in occipital parts of the inferior longitudinal fasciculi, thalami, external capsules; the posterior limbs of internal capsules, mesencephalon, pons, superior, middle and inferior cerebellar peduncles; cerebellar white matter and medulla oblongata; on the left side in the tracts of forceps major; on the temporal part of the inferior longitudinal fasciculus; and on the dorsal cingulum. The horizontal bar shows the color scale, and the values under the bar are 1-P. The image is thresholded at P = .05, so that only statistically significant voxels are shown.
Voxelwise TBSS analysis of the MD values did not reveal regional differences between patients with m.3243A>G and controls.
Analysis of Brain Volume
Total brain tissue volume normalized for subject head size was significantly lower in patients with m.3243A>G (mean, 1400 ± 110 cm3) than in the controls (mean, 1504 ± 78.5 cm3) (P = .017). Normalized total white matter volume was significantly lower in patients (mean, 694 ± 45.0 cm3) than in controls (mean, 736 ± 44.3 cm3) (P = .023). Normalized total gray matter volume was also lower in patients (mean, 705 ± 75.4 cm3) than in controls (mean, 769 ± 47.1 cm3) (P = .029).
VBM analysis of the gray matter showed several clusters of significant (P < .05, fully corrected for multiple comparisons) reductions in regional gray matter volume in patients with m.3243A>G (Fig 2 ). Areas of reduced gray matter volume were seen bilaterally in the occipital pole regions, intracalcarine cortex regions, and cerebellar gray matter. In addition, gray matter volume was reduced in the superior part of the left occipital cortex.
Results of the FSL-VBM analysis overlaid on a standard MNI152 image. Areas of reduced gray matter volume in patients with m.3243A>G are seen bilaterally in the occipital pole regions, intracalcarine cortex regions and cerebellar gray matter, and on the left side in the superior part of the occipital cortex. The horizontal bar shows the color scale and the values under the bar are 1-P. The image is thresholded at P = .05, so that only statistically significant voxels are shown.
Discussion
To our knowledge, this is the first study on brain white matter tract microintegrity assessed by means of DTI in patients with the m.3243A>G mutation. We found that FA values were lower in several areas of white matter in patients with m.3243A>G compared with those in the controls, while there were no differences in MD values. We suggest that these findings reflect mild microstructural damage leading to loss of directional organization of white matter, while the cell density is mainly preserved and the volume of extracellular space is not markedly increased.
Structural analysis showed that the total brain volume, white matter volume, and gray matter volume were reduced in patients with m.3243A>G. Reduced FA was seen almost exclusively in the posterior and caudal parts of the brain (Fig 1), where the areas of reduced gray matter volumes were also located (Fig 2). The causal relationship between DTI findings and structural imaging findings is not clear. It is possible that gray matter degeneration leads to reduction of FA values and loss of white matter in corresponding white matter tracts or that white matter tract damage leads to loss of gray matter in corresponding areas. Such secondary damage to gray matter is thought to be at least in part responsible for the gray matter degeneration in multiple sclerosis, though other hypotheses have also been presented.30 However, the areas of reduced FA in white matter were more extensive than those of reduced gray matter. For example, the white matter of the corticospinal tract was involved, without a significant reduction in the gray matter volume of frontoparietal motor and sensory cortical areas. Thus, these findings suggest that mitochondrial dysfunction caused by the mutation affects both the gray and white matter. Some previous imaging31,32 and neuropathologic9,33 studies on MELAS syndrome also suggest that both gray and white matter are affected, and that white matter involvement is not only secondary to cortical damage.9,33
Brain glucose and oxygen metabolism were previously assessed with positron-emission tomography in 28 of the 29 subjects also participating in this study.34 The cerebral metabolic rate of oxygen is universally decreased in the gray and white matter of patients with the m.3243A>G mutation, whereas the metabolic rate of glucose is decreased with a predilection for the posterior parts of the brain.34 Most interesting, we found here that FA values and gray matter volume were also reduced in the posterior and caudal brain areas of patients with m.3243A>G. The sequelae of MELAS syndrome are known to be progressive atrophy of the basal ganglia and occipitoparietotemporal regions, with relative preservation of more anterior temporal and frontal structures. Acute strokelike lesions in MELAS syndrome are also known to have some predilection for the occipitoparietal areas of the brain.35 The cause of strokelike episodes is currently not well known, but impaired vascular autoregulation has been suggested as one possible explanation,36 because posterior cerebral circulation is thought to be more susceptible to disturbances in autoregulation.37
In a previous study on the same patient group, visual analysis of structural MR images for atrophy revealed that patients with m.3243A>G have more atrophy in the cerebellum but not in other parts of the brain, and visual analysis of white matter lesions did not reveal differences between patients with m.3243A>G and the controls.34 In the present study, computerized VBM enabled us to detect loss of cerebellar gray matter of patients with m.3243A>G but also reduced gray matter volume in occipital areas and a global reduction in gray and white matter volume. The white matter hyperintensities usually have elevated MD values,38 but we found no global or regional differences in MD values between the groups. Thus, we conclude that differences in FA values between the 2 groups are not due to white matter hyperintensities.
The clinical manifestations of the m.3243A>G mutation, such as sensorineural hearing loss and cognitive decline, are slowly progressive. In a 3-year follow-up study of patients with m.3423A>G, imaging findings were progressive in 16 of the 20 patients who completed the follow-up; most interesting, quantitative electroencephalography suggested slowly progressing encephalopathy in the occipital and parietal regions.10 This seems to be in line with our finding on a predilection for atrophic changes in the posterior parts of the brain. Furthermore, patients with mitochondrial disease caused by mutations in the POLG1 gene almost invariably develop an epileptic syndrome with initial features of occipital epilepsy.39 The reason for this predilection for occipital lobes is unknown, but it suggests that the occipital cortex is more vulnerable to injury by energy deficiency than other parts of the brain.39 Such a vulnerability could be due to the fact that the occipital cortex is one of the most active areas in the waking brain because of continuous visual input.
Reduction of the FA values in white matter is a nonspecific finding. While it is thought to be due to loss of microstructural integrity of white matter, the exact biologic process leading to white matter damage is difficult to determine. Thus, the neuropathologic correlate of our imaging findings remains unknown. Further studies are needed to validate and extrapolate our current imaging findings directly to neuropathologic changes.
Our current imaging findings indicate that patients with m.3243A>G have microstructural white matter changes and global or regional reduction of brain volume. We propose that DTI could be used as a quantitative marker in the assessment of white matter integrity in patients with m.3243A>G. Longitudinal studies will be needed to assess the possible prognostic value of DTI and the temporal evolution of FA values in patients with m.3243A>G.
We analyzed images with operator-independent and unbiased methods that surpass measurements performed by using manual region of interest−based methods. Our study is potentially limited by the use of a DTI sequence with only 16 diffusion-encoding gradient directions and moderate spatial resolution. Furthermore, the typical limitations of VBM analysis have to be taken into account.40–42
Conclusions
We found that FA values were lower in patients with the m.3243A>G mutation than in the controls. Areas with decreased FA had a predilection for the posterior and caudal parts of the brain, even when previous visual analysis showed no significant difference in white matter hyperintensities. The patients also had lower gray and white matter volumes than control subjects. Patients with m.3243A>G seem to have a diffuse microstructural disturbance in the white matter, and DTI may be used as a quantitative method to assess white matter integrity in these patients.
References
- Received May 24, 2010.
- Accepted after revision July 15, 2010.
- Copyright © American Society of Neuroradiology


