
Abstract
BACKGROUND AND PURPOSE: MSDE preparation is a technique for black-blood imaging. Our purpose was to evaluate the usefulness of a 3D TSE sequence with MSDE preparation in detecting brain metastases by comparing it with conventional sequences.
MATERIALS AND METHODS: Postcontrast images of 227 patients who were suspected of having brain metastasis were prospectively obtained by using 3 T1-weighted 3D sequences: a gradient-echo sequence (MPRAGE), TSE-noMSDE, and TSE-MSDE. The number of visualized blood vessels and the lesion-to-normal CNR were compared among the 3 sequences. An observer test involving 9 radiologists was performed, and their diagnostic performance by using TSE-MSDE, MPRAGE, and combined TSE-MSDE and MPRAGE was compared by means of an FOM as an index of diagnostic performance derived by the JAFROC analysis, sensitivity, FP/case, and reading time.
RESULTS: TSE-MSDE resulted in significantly better vessel suppression than the other 2 methods. TSE with and without MSDE resulted in significantly higher CNRs than MPRAGE. In the observer test, significantly higher sensitivity and FOM as well as significantly shorter reading time were achieved by TSE-MSDE compared with MPRAGE, but FP/case was significantly higher with TSE-MSDE. Combined TSE-MSDE/MPRAGE resulted in significantly higher sensitivity and FOM and similar FP/case and reading time compared with MPRAGE alone.
CONCLUSIONS: With blood vessel suppression and increased CNR, TSE-MSDE improves radiologists' performances in detecting brain metastases compared with MPRAGE, but it may increase FP results. Combined with MPRAGE, TSE-MSDE achieves high diagnostic performance while maintaining a low FP rate.
Abbreviations
- ANOVA
- analysis of variance
- CNR
- contrast-to-noise ratio
- FA
- flip angle
- FOM
- figure of merit
- FP
- false-positive
- FP/case
- false-positive results per case
- G
- gradient
- GRE
- gradient-recalled echo
- JAFROC
- Jackknife Free-Response Receiver Operating Characteristic
- LCD
- liquid crystal display
- LSMeans
- least square means
- MPRAGE
- magnetization-prepared rapid acquisition of gradient echo
- MSDE
- motion-sensitized driven-equilibrium
- NS
- not significant
- RF
- radio-frequency
- TSE
- turbo spin-echo
- TSE-MSDE
- TSE with MSDE preparation
- TSE-noMSDE
- TSE without MSDE preparation
- VENC
- velocity-encoding
Brain metastases are the most common intracranial tumors in adults, affecting ≤20% of patients with cancer.1,2 They represent one of the most frequent neurologic complications of systemic cancer as a major cause of morbidity and mortality. Not only the presence or absence but also the number of brain metastases critically affects therapeutic strategies.3,4 For example, in the management of patients with multiple brain metastases, stereotactic radiosurgery along with whole-brain radiation therapy has been recommended when the number of lesions is ≤4.4,5 Thus, accurate pretreatment diagnosis by MR imaging is crucial.
Postcontrast 3D T1-weighted GRE imaging is widely used to detect brain metastases.6,7 In these images, a high signal intensity of enhancing blood vessels is a disturbing factor because it can be mistaken for enhancing metastases. The suppression of blood vessel signals may simplify radiologists' reading processes and, in turn, improve their performance. In this study, we introduced an MR image with MSDE preparation,8,9 aiming for blood vessel suppression. MSDE preparation is a technique for black-blood imaging and was first optimized to efficiently suppress signals from blood in imaging of the arterial wall.8–10 With MSDE preparation, the flow-sensitizing gradient pair introduces the phase dispersion among moving spins, as opposed to the stationary spins, resulting in selective suppression of signals from flowing blood. We implemented an MSDE preparation with a T1-weighted 3D TSE sequence because it has recently been shown that 3D TSE imaging can increase the CNR for brain metastases compared with a conventional GRE sequence.11,12 Therefore, our purpose was to evaluate the usefulness of TSE-MSDE in detecting brain metastases by comparison with conventional GRE imaging.
Materials and Methods
This study was approved by the institutional review board of our hospital. Written informed consent was obtained from volunteers and patients.
This study consisted of 3 parts. First, we performed a volunteer study to determine an appropriate VENC setting for TSE-MSDE. Next, we evaluated the image quality of the MSDE-TSE sequence by comparing it with conventional sequences. Specifically, the number of visualized vessels and lesion-to-normal CNR was compared. Finally, we conducted an observer test. For the latter 2 parts, we constructed a data base of patients' images from which appropriate cases were selected for the respective purposes.
Volunteer Study
With MSDE preparation, the degree of blood signal-intensity suppression depends on the VENC setting because lower VENC values result in the suppression of blood with a slower flow. 3D TSE-MSDE images of the brains of 2 healthy men (33 and 45 years old) were obtained by using a 3T MR imaging scanner (Achieva Quasar Dual; Philips Electronics, Best, the Netherlands) and an 8-channel array head coil after administration of a contrast agent (gadoteridol, ProHance; Eisai, Tokyo, Japan; 0.2 mmol/Kg). Figure 1 shows our TSE-MSDE sequence.13 Imaging parameters were as follows: TR/TE, 345/20 ms; FA, 90°; echo-train length, 11; refocus angle, 130°; sensitivity-encoding factors, 2.4 (phase) and 1.8 (section); FOV, 240 mm; voxel size, 1.0 × 1.0 × 1.0 mm3. Images were sequentially obtained at 6 VENC values: 7.2, 9.2, 10.8, 20.8, 39.6, and 55.0 mm/s. In our MSDE sequences, motion-sensitized gradients were inserted in all 3 directions. Therefore, the VENC values are indicated as resultant values. The first scan was started at 5 minutes after the contrast injection. To evaluate the possible effect of imaging order on the results, we reversed the order of the 6 scans in the second subject. The images were obtained in a sagittal plane, reconstructed into 2-mm-thick contiguous transverse sections, and displayed on an LCD monitor of a PACS (Rapideye; Toshiba Medical, Tokyo, Japan). For each VENC setting, blood vessels were visually counted by a board-certified radiologist (E.N.) in a single section at the level of the centrum semiovale.
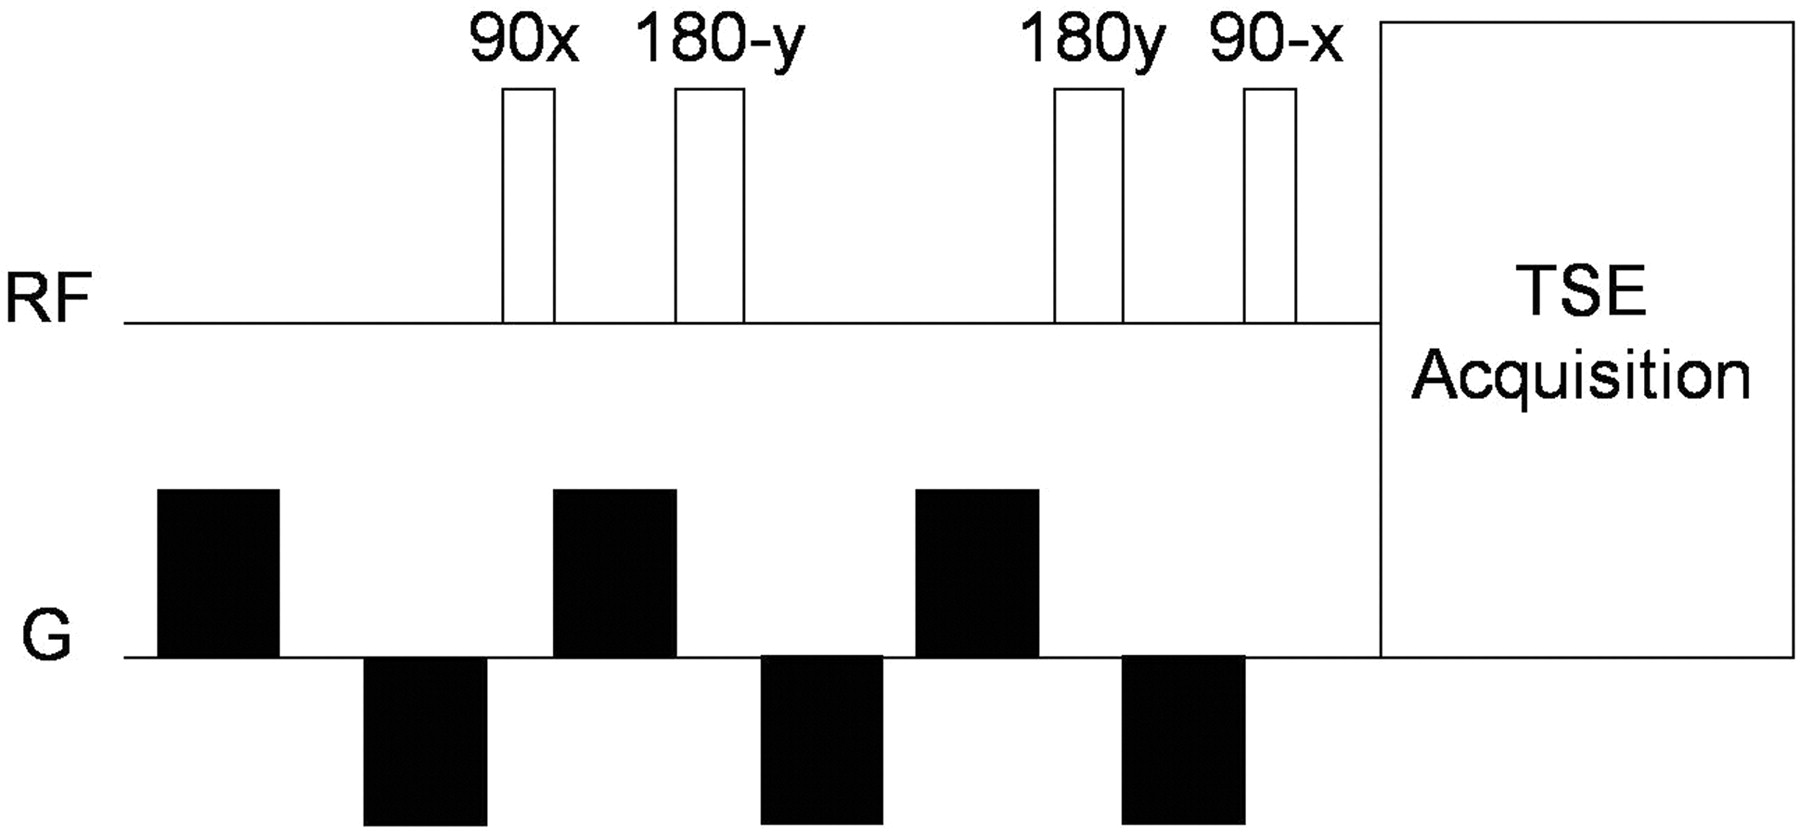
Diagram of a TSE-MSDE used in this study. The MSDE preparation consists of a 90° excitation pulse, two 180° Malcolm Levitt refocusing pulses with each pulse sandwiched by bipolar motion-sensitizing gradients, and a −90° flip back pulse. The motion-sensitized gradients are inserted in all 3 (x, y, and z) directions. All refocusing pulses are implemented as composite pulses (90x-180y-90x). Bipolar gradients are used to reduce eddy current effects. An additional bipolar gradient is inserted in front of the sequence for further eddy current compensation.
Data Base of Patient Images
We constructed a data base of patient images by prospectively imaging consecutive patients who were referred for MR evaluation for possible brain metastasis. A total of 259 head MR imaging examinations from 227 patients were included in the data base. The MR imaging hardware and the contrast agent were the same as those used for the volunteer study. For each patient, we obtained 3 types of 3D postcontrast T1-weighted images sequentially: GRE (MPRAGE), TSE-noMSDE, and TSE-MSDE sequences. The parameters of the TSE-MSDE sequence are shown in the previous section. VENC was set at an appropriate value determined in the volunteer study, and the resultant shortest preparation duration was 14.7 ms. The parameters for MPRAGE were TR/TE, 8.2/3.8 ms; TI, 1028 ms; FA, 8°; sensitivity-encoding factors, 1 (phase) and 2.5 (section). The parameters for TSE-noMSDE were exactly the same as those for TSE-MSDE except for the absence of MSDE preparation. Imaging times for MPRAGE, TSE-noMSDE, and TSE-MSDE were 5 minutes 20 seconds, 7 minutes, and 7 minutes, respectively. All 3 sequences were obtained in a sagittal plane with the same FOV (240 mm) and voxel size (1.0 × 1.0 × 1.0 mm3) and were reconstructed in 2-mm-thick contiguous transverse images. The first postcontrast scan was started at 5 minutes after the contrast injection. The imaging order was MPRAGE, TSE-noMSDE, and TSE-MSDE (order 1 hereafter) in the first 62 examinations. The reverse order (order 2) was used for the remaining 197 examinations.
Determination of Metastatic Lesions
From the image data base, patients with a history of pathologically proved cancer and with at least 1 follow-up MR imaging examination were selected. There were 132 such patients. Two board-certified radiologists (E.N., T.Y.) reviewed all images of these patients in a consensus reading and selected intraparenchymal enhancing lesions that were visualized in both MPRAGE and TSE-MSDE. We excluded lesions visualized on only 1 of the 2 sequences, to stay conservative in determining the criterion standard. An effort was made to exclude artifacts and enhancing vessels, by carefully comparing the 2 images. Among the selected lesions, those satisfying any of the following conditions were determined to be metastases: 1) the size of the lesion increased in the follow-up period, 2) the lesion newly appeared during the follow-up period, and 3) the lesion received a treatment (either systemic chemotherapy or brain radiation therapy). Four hundred eighty-five lesions of 31 patients were recognized as metastases. During the same review, 174 patients were found to have no enhancing lesions.
Evaluation of Image Quality
Fifty patients with no enhancing lesion (35 men, 15 women; age, 26–87 years), including 25 imaged in order 1 and 25 in order 2, were randomly selected from the image data base. The images of these patients were further evaluated on the PACS by 1 board-certified radiologist (E.N.). For each of the 3 imaging methods, the degree of blood vessel suppression was evaluated by counting the visualized blood vessels in a single section at the level of the centrum semiovale. In addition, the lesion-to-normal CNR was compared. For the CNR evaluation, we selected lesions with a diameter ≥ 5 mm and homogeneous solid enhancement. As a result, 29 metastatic lesions, including 11 imaged in order 1 (1 man, 2 women; age, 46–74 years; 2 patients with lung cancer and 1 with thyroid cancer) and 18 in order 2 (8 male patients with lung cancer; age, 47–77 years) were selected. The CNR was calculated as follows:
 where SIlesion and SIbackground represent the mean signal intensities of the lesion and normal-appearing white matter in the same section, respectively, and SDlesion and SDbackground are the corresponding SDs.14 These parameters were obtained by defining circular regions of interest of 5 mm in each location.
Observer Study
Cases with 1–9 metastases were selected from the image data base, and as a result, 17 cases (12 men, 5 women; age, 37–87 years; 14 patients with lung cancer, 1 with oral floor carcinoma, 1 with breast cancer, and 1 with pancreatic cancer) with 50 lesions were chosen. Among the 17 cases, 1 case was imaged in order 1 and 16 in order 2. Figure 2 shows the distribution of lesion size. In addition, 17 cases without any enhancing lesions (12 men, 5 women; age, 48–84 years; 15 patients with lung cancer, 1 with gastric cancer, and 1 with renal cell carcinoma) were selected, among which 2 cases were scanned in order 1 and the other 15 in order 2. These 34 cases were used for the observer tests. We included only MPRAGE and TSE-MSDE for the observer test because an evaluation of image quality revealed that TSE-MSDE showed better blood vessel suppression than TSE-noMSDE and similar CNR.

The distribution of the 50 metastatic lesions used in the observer study according to lesion diameter, which ranged from 2 to 36 mm, with an average of 6.8 mm.
Nine radiologists who were blinded to the patients' clinical information, including 4 first-year radiology residents who each had 6 months of experience in radiology practice and 5 board-certified radiologists who had 16, 13, 10, 9, and 7 years of experience, respectively, participated in the observer test. None of the 9 radiologists participated in the case selection. Each radiologist took part in 3 reading sessions, which were each at least 1 month apart. They read TSE-MSDE, MPRAGE, and both of these, in the first, second, and third reading sessions, respectively. All images were displayed on a 20.8-inch LCD monitor. The radiologists were allowed to freely increment the sections by using a mouse with a wheel. In each reading session, the 34 cases were presented in a randomized order. For a training session before the test, 3 training cases, each of which had 10–12 metastases, were provided to the radiologists to familiarize them with the operation of the PACS and the rating system. The radiologists were asked to place an arrow electronically in each location where they found a metastasis, to record the results of the readings. In the third reading session, in which both TSE-MSDE and MPRAGE were read, the observers were instructed to use TSE-MSDE to pick up high-signal-intensity areas as candidates for metastases and MPRAGE as a second opinion to reject FPs such as enhancing vessels and artifacts, taking advantage of the synchronized section increment capability of the PACS. The radiologists were asked to report their level of confidence in the presence of metastasis at each location by using a rating bar scale, on which the right and left ends corresponded to the highest (100) and lowest (0) confidence levels, respectively. The reading time for each case was recorded.
Statistical Analyses
The number of blood vessels and CNR was compared by using LSMeans Student t test when 2-way ANOVA was significant.
To evaluate the radiologists' performances in the observer test, we used JAFROC analysis.15,16 This analysis has been proposed to statistically estimate the differences in diagnostic performance between different modalities when location issues are relevant. We applied JAFROC analysis with method 1 of Chakraborty and Berbaum15 to estimate an FOM value as an index of each radiologist's performance in each session. A free software package (JAFROC1, http://www.devchakraborty.com) was available. We also obtained the sensitivity and the number of FPs/case. Imaging findings related to the FP results judged by the consensus of the 2 board-certified radiologists (E.N., T.Y.) were reported. Additionally, sensitivities were compared among the 3 sessions according to lesion size: small (≤5 mm in shorter diameter) and large (>5 mm).
The sensitivity, FP/case, and reading time among the 3 reading sessions were compared by using a LSMeans Student t test when 2-way ANOVA was significant. The difference in sensitivity between small and large lesions was analyzed by using the t test. For all analyses, P < .05 was considered statistically significant.
Results
Volunteer Study
The number of vessels in TSE-MSDE decreased with decreasing VENC values until reaching a plateau at 10.8 mm/s and below (Figs 3 and 4). Similar results were reproduced in the 2 subjects independent of the imaging order. On the basis of these results, we decided to use a VENC value of 10.8 mm/s for the following studies.

Number of blood vessels visualized in a single section of a postcontrast image obtained by using TSE-MSDE sequences at different VENC settings in 2 healthy volunteers. Lower VENC settings were used in earlier scans for volunteer 1, whereas the imaging order was reversed for volunteer 2.

Postcontrast TSE-MSDE images for a volunteer (volunteer 1) obtained at 6 different VENC settings that are indicated in millimeters per second. Note that fewer blood vessels are visualized at lower VENC settings.
Evaluation of Image Quality
Figure 5 shows the number of vessels counted in imaged orders 1 and 2. In both imaging orders, significantly fewer blood vessels were visualized in TSE-MSDE than in either MPRAGE or TSE-noMSDE (P < .001, respectively), and significantly fewer blood vessels were visualized in TSE-noMSDE than in MPRAGE (P < .001). In each imaging order, both TSE-noMSDE and TSE-MSDE showed significantly higher CNRs compared with MPRAGE (P < .05, respectively), whereas no significant difference was seen between TSE-noMSDE and TSE-MSDE (Fig 6).
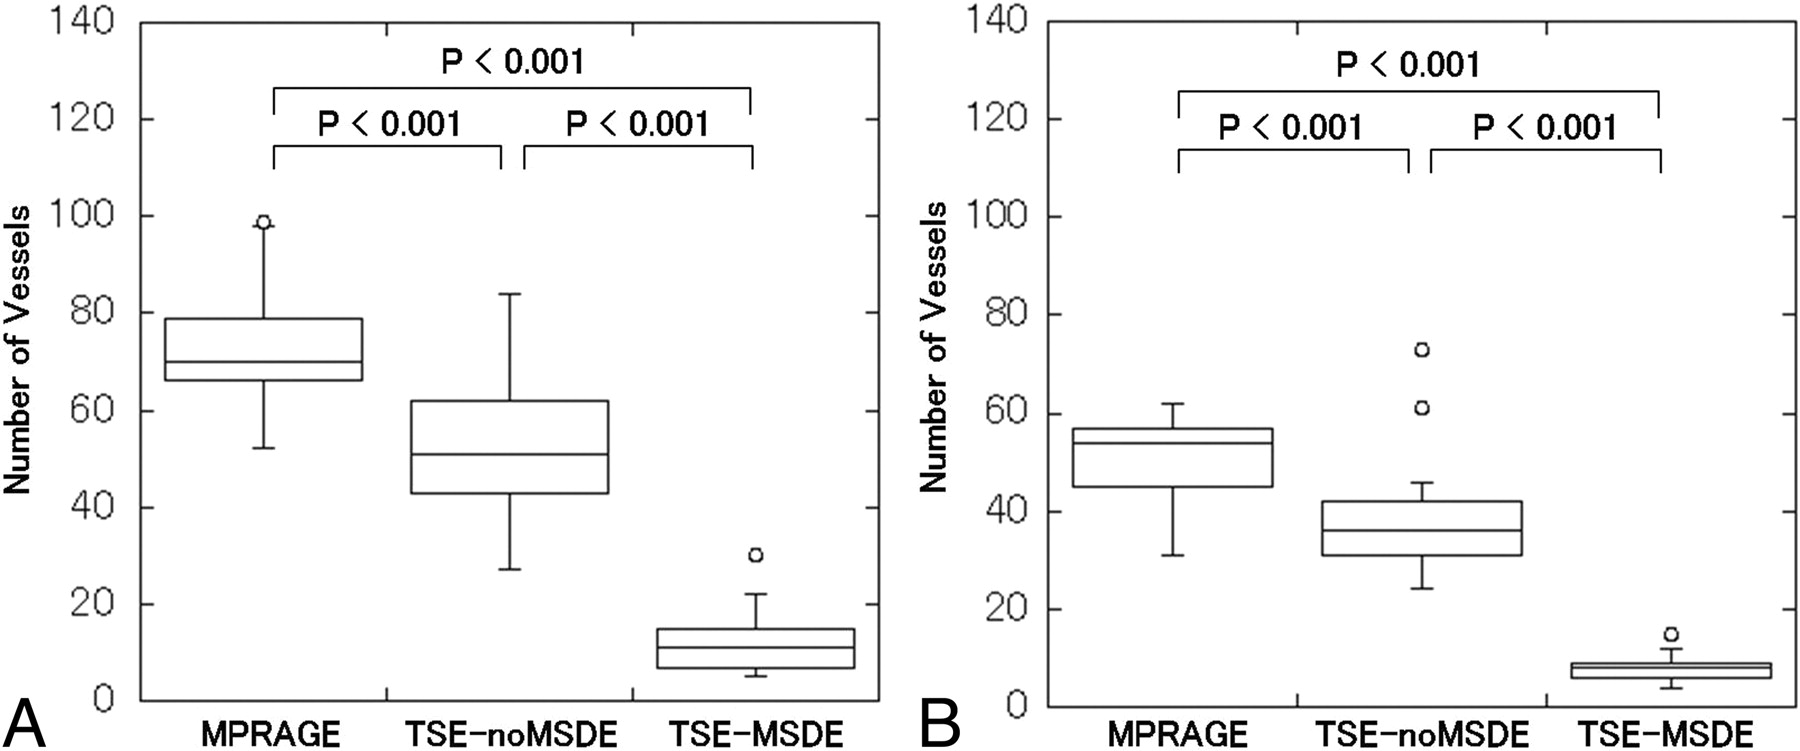
Comparison of blood vessel numbers in the MPRAGE, TSE-noMSDE, and TSE-MSDE. A, The results for cases in which postcontrast images were obtained in the order of MPRAGE, TSE-noMSDE, and then TSE-MSDE (order 1, n = 25). B, The results for the reverse order (order 2, n = 25). Significant differences are found among the 3 imaging methods for both orders (P < .001, respectively).

Comparison of CNRs for metastatic lesions for MPRAGE, TSE-noMSDE, and TSE-MSDE. A and B, Results for order 1 (n = 25) and order 2 (n = 25), respectively. Significant differences are found between MPRAGE and TSE-noMSDE and between MPRAGE and TSE-MSDE for both orders (P < .05, respectively), whereas no significant difference is found between TSE-noMSDE and TSE-MSDE for either imaging order.
Observer Study
Figure 7 shows an example of a metastasis imaged with TSE-MSDE and MPRAGE.

A brain metastasis imaged with TSE-MSDE (A) and MPRAGE (B). Note that the lesion is clearly visualized in TSE-MSDE (arrow), whereas it is poorly visualized in MPRAGE (arrow). Also note the well-suppressed blood vessels in TSE-MSDE. In the observer study, this lesion was overlooked by all 4 residents and by 2 of the 5 board-certified radiologists on MPRAGE, while it was correctly detected by 2 residents and all 5 board-certified radiologists on TSE-MSDE.
The On-line Table summarizes the results of the observer study. Sensitivity with TSE-MSDE was higher than that with MPRAGE for all radiologists (P < .001). On the other hand, FP/case increased with the use of TSE-MSDE compared with MPRAGE among residents (P < .001) and all 9 radiologists (P = .002), whereas no significant difference was found among board-certified radiologists. The FOM with TSE-MSDE was significantly higher than that with MPRAGE for all radiologists (P < .05).
The combined use of TSE-MSDE and MPRAGE resulted in significantly higher overall sensitivity than the use of MPRAGE alone (P < .001), whereas it did not significantly differ in sensitivity from TSE-MSDE alone. FP/case with the combined TSE-MSDE/MPRAGE was significantly lower than that with TSE-MSDE alone (P = .004), whereas it did not significantly differ from that with MPRAGE alone. FOM with combined TSE-MSDE/MPRAGE was significantly higher than that with MPRAGE alone among residents (P < .05) and among all 9 radiologists (P < .05), whereas FOMs with these 2 methods did not significantly differ among board-certified radiologists. Only among residents, FOM with combined TSE-MSDE/MPRAGE was significantly higher than that with TSE-MSDE alone (P < .05).
The average reading time with TSE-MSDE was significantly shorter than that with MPRAGE for all radiologists (P < .001) (Table 1). Among the residents, the reading time with combined TSE-MSDE/MPRAGE was significantly shorter than that with MPRAGE alone (P < .001), whereas the reading times with the 2 methods did not significantly differ among board-certified radiologists or among all 9 radiologists (Table 1). The reading time with combined TSE-MSDE/MPRAGE was significantly longer than that with TSE-MSDE alone (P < .001) (Table 2).
Average reading time per case for each observer for each reading sessiona
Comparison of the sensitivity for 3 reading sessions according to the lesion sizea
Sensitivities with both TSE-MSDE and combined TSE-MSDE/MPRAGE were significantly higher than that with MPRAGE in detecting small (≤ 5 mm) lesions (P < .001, respectively), whereas no significant difference was found in sensitivity in detecting large (>5 mm) lesions among the 3 methods (Table 2).
For each reading session, vessels were the most common imaging finding resulting in FPs, followed by artifacts (Table 3).
Summary of imaging findings related to false-positive results for 3 reading sessionsa
Discussion
Our volunteer study confirmed that MSDE preparation at lower VENC settings effectively suppresses blood vessel signals in postcontrast T1-weighted images (Figs 3 and 4). However, a certain number of blood vessels remained visualized even at the lowest VENC setting (7.2 mm/s), suggesting that they had very slow blood flow.
Our vessel-counting results demonstrated that TSE-MSDE achieves better blood vessel suppression than both MPRAGE and TSE-noMSDE (Fig 5). They also showed that blood vessel suppression occurred in TSE even without MSDE (Fig 5), which is consistent with a previous report11 in which the variable FA echo-train technique was used, though that is not directly comparable with our result because we did not use such a technique in our TSE sequences. The better suppression of vessels by TSE-MSDE than by TSE-noMSDE suggests that MSDE preparation effectively suppressed vessels with slower blood flow, such as small veins.
Comparisons of CNRs showed that both TSE-noMSDE and TSE-MSDE improved CNR compared with MPRAGE (Fig 6); these results are consistent with previous reports.11,12
Our observer test revealed that TSE-MSDE significantly improved sensitivity compared with MPRAGE (On-line Table), especially for small lesions (Table 2). This high sensitivity of TSE-MSDE is likely due to the blood vessel suppression and high CNR, which was found in our evaluation of image quality (Figs 5 and 6). Because 16 of 17 cases with metastases used in the observer study were imaged in order 2 (TSE-MSDE, TSE-noMSDE, and then MPRAGE), a possible effect of delayed enhancement17 would have favored MPRAGE rather than TSE-MSDE, though such an effect should be minimized over a postinjection period of 5–20 minutes.18 In careful reading, high signal intensities of enhancing vessels can be distinguished from metastases on the basis of the curvilinear shapes of the former. However, they might have distracted the radiologists, possibly causing the real metastases to be overlooked.
The mean FOM value for TSE-MSDE was significantly higher than that for MPRAGE, not only among the residents but also among the board-certified radiologists (On-line Table). Moreover, the reading time for TSE-MSDE was significantly shorter than that for MPRAGE (Table 1), suggesting that radiologists' reading processes were simplified with TSE-MSDE. Nevertheless, TSE-MSDE was associated with significantly higher FPs/case compared with MPRAGE among the residents and all 9 radiologists (On-line Table). Analyses of FP results revealed that enhancing vessels were the most common mimickers of metastasis, even in TSE-MSDE (Table 3). As shown in our results (Figs 3 and 5), a fraction of the vessels remained visible in TSE-MSDE, presumably due to their lower flow velocity. We consider that vessels can closely mimic small enhancing nodules, especially when they are partially faded by the MSDE preparation (Fig 8). Although TSE-MSDE proved to have a higher FOM than MPRAGE, its higher risk for producing FP results should not be ignored.

An enhancing blood vessel mimicking a metastatic tumor. TSE-MSDE shows a nodulelike enhancement (arrow) in the right frontal lobe (A), which is not visualized in the next section at 2 mm below (arrow) (B). C and D, In MPRAGE, an enhancing blood vessel (arrows) running across the 2 contiguous sections is visualized in the corresponding area, revealing that the nodulelike enhancement in TSE-MSDE is a partially faded blood vessel.
When TSE-MSDE and MPRAGE were used in combination, sensitivity was comparable with that with TSE-MSDE alone and was significantly higher than that with MPRAGE alone (On-line Table). Moreover, there was no significant difference in FP/case between combined TSE-MSDE/MPRAGE and MPRAGE alone (On-line Table). We assume that the better vessel visualization on the MPRAGE allowed the observers to eliminate the vessels as FPs on the concomitantly used TSE-MSDE sequence. FOM was significantly higher with combined TSE-MSDE/MPRAGE than with MPRAGE alone among residents and all 9 radiologists (On-line Table). FOM was higher with combined TSE-MSDE/MPRAGE than with MPRAGE alone among 4 of 5 board-certified radiologists, though the difference did not reach statistical significance. Furthermore, the reading time with combined TSE-MSDE/MPRAGE was not longer than that with MPRAGE alone (Table 1). We speculate that the observers were successful in combining 2 images as instructed, taking advantage of the synchronized section-increment function of PACS. Taken together, our results suggested that combined TSE-MSDE/MPRAGE was superior to either TSE-MSDE or MPRAGE alone, though this combined method would require an extended imaging time.
The limitations of this study include a lack of pathologic confirmation of the diagnosis of metastasis. Instead, we used clinical criteria customized for this study, which may have been too generous. Contamination of other pathologies with enhancement, such as subacute infarction, cannot be completely eliminated from imaging findings alone. In addition, because we included only lesions that were visualized on both MPRAGE and TSE-MSDE, true metastatic lesions that were seen only in 1 of the 2 sequences might have been excluded. Nevertheless, we believe that our performance comparisons among the different imaging/reading methods are convincing enough. Among the 17 cases with metastasis used in our observer study, only 1 was obtained in order 1 while the other 16 cases were imaged in order 2. This unevenness was partly due to the inequality in the number of examinations performed with these 2 orders (see “Materials and Methods”). Inclusion of a similar number of cases scanned in orders 1 and 2 would have simplified the interpretation of the results of our observer study, though we believe that this unevenness has not distorted our conclusion. Another possible limitation is the relatively small number of cases included for the observer test. However, tests with more cases would have been exceedingly exhausting. Although our results suggest the usefulness of TSE-MSDE in detecting brain metastases, this does not necessarily indicate the superiority of the TSE-MSDE over the conventional sequences for general purposes. For example, we noticed that the contrast between the gray matter and white matter is reduced in TSE-MSDE compared with MPRAGE as seen in Figs 7 and 8. This may hamper accurate anatomic localization of certain brain lesions. Moreover, a longer imaging time (7 minutes) for TSE-MSDE compared with MPRAGE (5 minutes 20 seconds) may lead to higher risk for motion-related artifacts.
Conclusions
Our results showed that compared with conventional MPRAGE, TSE-MSDE improved the radiologists' performances in detecting brain metastases through the suppression of blood vessels and increased lesion-to-normal CNR, but it increased the risk of FP results. Combined with MPRAGE, TSE-MSDE achieves high diagnostic performance while maintaining a low FP rate.
Footnotes
-
Indicates article with supplemental on-line table.
References
- Received July 5, 2010.
- Accepted after revision August 18, 2010.
- Copyright © American Society of Neuroradiology
In this issue


Jump to section
Related Articles
Cited By...
- Prospective Comparison of T1-SPACE and MPRAGE for the Identification of Intrinsic T1 Hyperintensity in Patients with Intracranial Melanoma Metastases
- Improved Blood Suppression of Motion-Sensitized Driven Equilibrium in High-Resolution Whole-Brain Vessel Wall Imaging: Comparison of Contrast-Enhanced 3D T1-Weighted FSE with Motion-Sensitized Driven Equilibrium and Delay Alternating with Nutation for Tailored Excitation
- Usefulness of the Delay Alternating with Nutation for Tailored Excitation Pulse with T1-Weighted Sampling Perfection with Application-Optimized Contrasts Using Different Flip Angle Evolution in the Detection of Cerebral Metastases: Comparison with MPRAGE Imaging
- Evaluation of Diffusivity in the Anterior Lobe of the Pituitary Gland: 3D Turbo Field Echo with Diffusion-Sensitized Driven-Equilibrium Preparation
- Visualization of the Trochlear Nerve in the Cistern with Use of High-Resolution Turbo Spin-Echo Multisection Motion-Sensitized Driven Equilibrium