
Abstract
BACKGROUND AND PURPOSE: TDLs may be indistinguishable from high-grade gliomas on conventional MR imaging. The role of DTI in differentiating TDLs from high-grade gliomas is not clear, and quantitative comparison between the 2 has not been reported. Here we aimed to differentiate TDLs from high-grade gliomas by using DTI.
MATERIALS AND METHODS: DTI was performed in 8 TDLs and 13 high-grade gliomas. The presence of 3 findings (ie, intralesional hyperintensities on the FA map, restricted diffusion in the lesion periphery, and a perilesional hyperintense FA rim) was assessed by visual inspection. The FA and MD values were measured in the central nonenhancing portion, peripheral enhancing portion, and perilesional edema for each lesion and compared between the 2 groups respectively.
RESULTS: TDLs had a significantly higher incidence of intralesional hyperintensities on FA maps (P = .049) but a lower incidence of a perilesional hyperintense FA rim (P < .001), compared with those of high-grade gliomas on visual inspection. TDLs had significantly higher FA (P = .004) and lower MD (P = .001) values in the peripheral enhancing portions of the lesions compared with those of high-grade gliomas. In perilesional edema, FA values were significantly higher in high-grade gliomas (P = .001).
CONCLUSIONS: DTI is helpful in differentiating TDLs from high-grade gliomas by using visual inspection and quantitative analysis.
ABBREVIATIONS:
- FA
- fractional anisotropy
- MD
- mean diffusivity
- MPRAGE
- magnetization-prepared rapid acquisition of gradient echo
- TDL
- tumefactive demyelinating lesion
TDLs are defined as demyelinating lesions larger than 2 cm that often have conventional MR imaging findings indistinguishable from high-grade gliomas.1 A TDL misdiagnosed as a neoplasm could lead to unnecessary surgical intervention or even radiation therapy, which could exacerbate demyelinating diseases.2 Certain conventional MR imaging features, including a relative lack of mass effect, less substantial perifocal edema, and an open ring of enhancement,1,3,4 which were previously thought to be characteristics of TDLs, were considered to be nonspecific in a more recent study reviewing the conventional MR imaging findings of 168 patients with biopsy-confirmed TDLs.5
TDLs can also be confused with high-grade gliomas on histopathologic evaluation because of the presence of hypercellularity and atypical reactive astrocytes with mitotic figures.6 The presence of demyelination must be confirmed with myelin- and axon-specific staining by demonstrating demyelination and relative axonal preservation,7 which is not routinely performed in intracerebral masses unless a TDL is considered preoperatively.
DTI is a noninvasive imaging technique that provides information about tissue microstructure and architecture by measuring the average and directional variation of water diffusivity for a given voxel in terms of MD and FA, respectively.8,9 In normal brain tissue, the diffusion anisotropy is related to the myelination of white matter. Therefore, DTI is sensitive in detecting alterations in the integrity of white matter structures and allows accurate characterization of intrinsic tissue damage in multiple sclerosis, the most common demyelinating disease of the CNS.10
Recently, 2 imaging findings of TDLs have been reported. Malhotra et al11 found peripheral restricted diffusion on DWI in 11 of 18 patients with TDLs, while Masu et al12 observed that intralesional fibers appeared to be a pyramidal tract on diffusion tractography in a patient with TDL. Conversely, the perilesional hyperintense FA rim that is frequently found in the perifocal edema of high-grade gliomas13 has not been described in TDLs. We aimed to differentiate TDLs from high-grade gliomas with DTI because the contributory role of DTI in differentiating TDLs from high-grade gliomas is not clear and quantitative comparison between the 2 has not been reported, to our knowledge.
Materials and Methods
Patients
Approval for this study was obtained from the Institutional Board of Research Associates, and signed informed consent was obtained from all patients. This study was Health Insurance Portability and Accountability Act–compliant. No patients had begun corticosteroid or other treatments at the time of their MR imaging.
Preoperative MR imaging studies were performed in 8 patients (2 men, 6 women; mean age, 37.3 years; age range, 23–51 years) with TDLs (mean size, 6.4 ± 2.4 cm). The diagnosis of TDL was made by surgical biopsy in 4 patients with special stains for myelin and axons. The other 4 patients were diagnosed clinically with documented regression of the lesions on images following corticosteroid treatment and clinical follow-up for at least 6 months. Among the 4 patients diagnosed clinically, 2 had additional cervical spinal cord lesions that were suggestive of a demyelinating lesion. All of the 8 TDLs showed peripheral contrast enhancement. The enhancement patterns were incomplete rim (n = 2), complete rim (n = 2), and heterogeneous (n = 4), as defined in a previous study.5 Mass effect was considered mild in 5 and moderate in 3 patients. Perifocal edema was mild in 3, moderate in 3, and marked in 2 patients. The largest lesion was selected for evaluation in 2 patients who each had 2 lesions.
Thirteen patients (10 men, 3 women; mean age, 59.3 years; age range, 27–81 years) with high-grade gliomas (10 glioblastomas, 3 anaplastic astrocytomas; mean size, 4.9 ± 1.0 cm) that had similar MR imaging findings including size, location, and degree of perifocal edema were retrospectively selected from another prospective study for comparison. The high-grade gliomas were relatively well-defined with rim enhancement on postcontrast T1-weighted imaging. Infiltrative high-grade gliomas with diffuse heterogeneous enhancement were not included. Histologic diagnosis was obtained in all patients with high-grade gliomas by surgical resection.
MR Imaging
All patients underwent MR imaging studies including axial T1-weighted imaging, axial T2-weighted imaging, DTI, and postcontrast 3D MPRAGE with intravenous administration of 0.1 mmol per kilogram body weight gadopentetate dimeglumine (Magnevist; Schering, Berlin, Germany). All MR imaging studies were performed on a single occasion by using a 3T unit (Magnetom Tim Trio; Siemens, Erlangen, Germany). DTI was performed in the axial plane by using single-shot echo-planar imaging with the following parameters: TR/TE, 5800/83 ms; diffusion gradient encoding in 20 directions; b = 0, 1000 s/mm2; FOV, 256 × 256 mm; matrix size, 128 × 128; section thickness, 2 mm; and number of signals acquired, 4. A total of 50–60 sections without intersection gap were used to cover the cerebral hemispheres, upper brain stem, and cerebellum. To minimize artifacts such as signal-intensity drop-out and gross geometric distortions associated with the echo-planar imaging, we used a parallel imaging technique (generalized autocalibrating partially parallel acquisition; reduction factor = 2) during DTI acquisitions.
Image Postprocessing
Diffusion tensor data were transferred to an independent workstation and processed by using the software nordicICE (Version 2, Nordic Imaging Lab, Bergen, Norway). The DWI was coregistered to the non-diffusion-weighted (b = 0) images to minimize the artifacts induced by eddy currents and subject motion. The diffusion tensor was diagonalized to yield the major (λ1), intermediate (λ2), and minor (λ3) eigenvalues. FA and MD were calculated by using standard algorithms as described in previous studies.14,15 Isotropic DWI was obtained by averaging the anisotropic DWI encoded in 20 different directions. By using the coregistration module integrated in the software nordicICE, T2-weighted isotropic DWI, MD, and FA images were coregistered to postcontrast MPRAGE on the basis of 3D nonrigid transformation and mutual information before all visual inspections and quantitative measurements. Regions with susceptibility artifacts from hemorrhage were excluded for analysis by carefully viewing T1-weighted and T2-weighted images and DWI (b-value = 0). Coronal and sagittal views were reconstructed from axial images for visual inspection of isotropic DWI and MD and FA maps.
Visual Inspection
Two experienced neuroradiologists evaluated all lesions independently for the presence of 3 imaging findings on DTI (ie, intralesional hyperintensities and their locations on FA maps) (Fig 1D, -E), restricted diffusion in the lesion periphery (Fig 1B, -C), and a perilesional hyperintense FA rim (Fig 2D–F), respectively. “Intralesional hyperintensities” on FA maps were defined as areas of high signal intensity found within the lesion. “Restricted diffusion” in the lesion periphery was defined as hyperintensity on isotropic DWI and hypointensity on MD maps in the peripheral part of the lesion that was inside the enhancement. “Perilesional hyperintense FA rims” were defined as rimlike structures that were bright on FA maps found in the perifocal edema. An imaging sign was determined as present if seen on at least 2 orthogonal views. Interobserver differences were resolved by consensus.
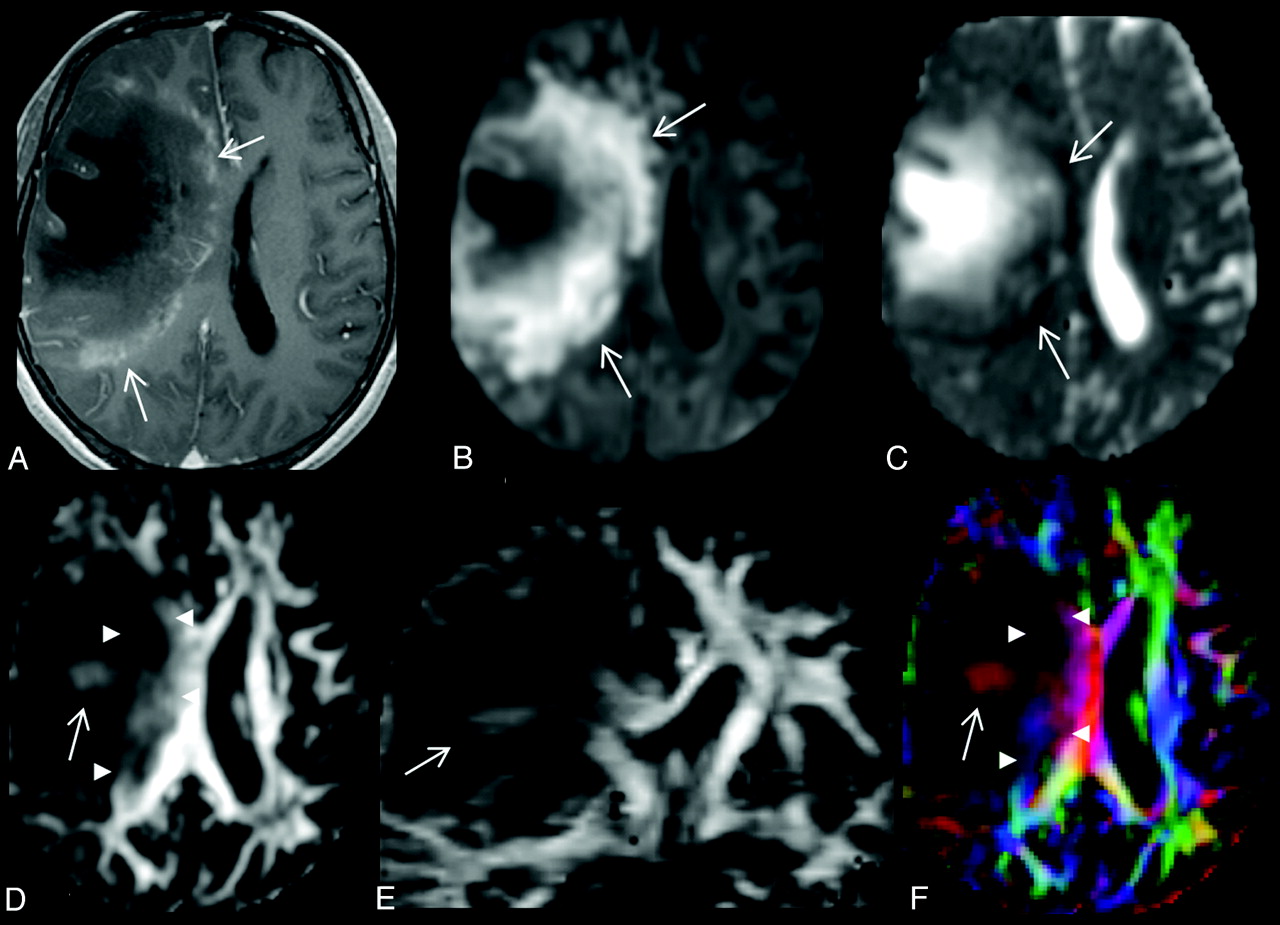
A 28-year-old woman with a large TDL in the right frontal lobe. A, There is heterogeneous enhancement at the medial margin (arrows) of the lesion on the axial contrast-enhanced T1-weighted image. B and C, On the axial DWI (B) and MD map (C), the peripheral portion of the lesion shows restricted diffusion (arrows). D and E, Intralesional hyperintensities (arrow) are seen in both the lesion center (arrow) and periphery (arrowheads) on axial (D) and coronal (E) FA maps. F, Directional-coded FA map displays the directionality of these intralesional hyperintensities. The FA values are 0.06 for central nonenhancing portion and 0.21 for peripheral enhancing portion. The MD values (× 10−3 mm2/s) are 1.966 for central nonenhancing portion and 0.704 for peripheral enhancing portion.
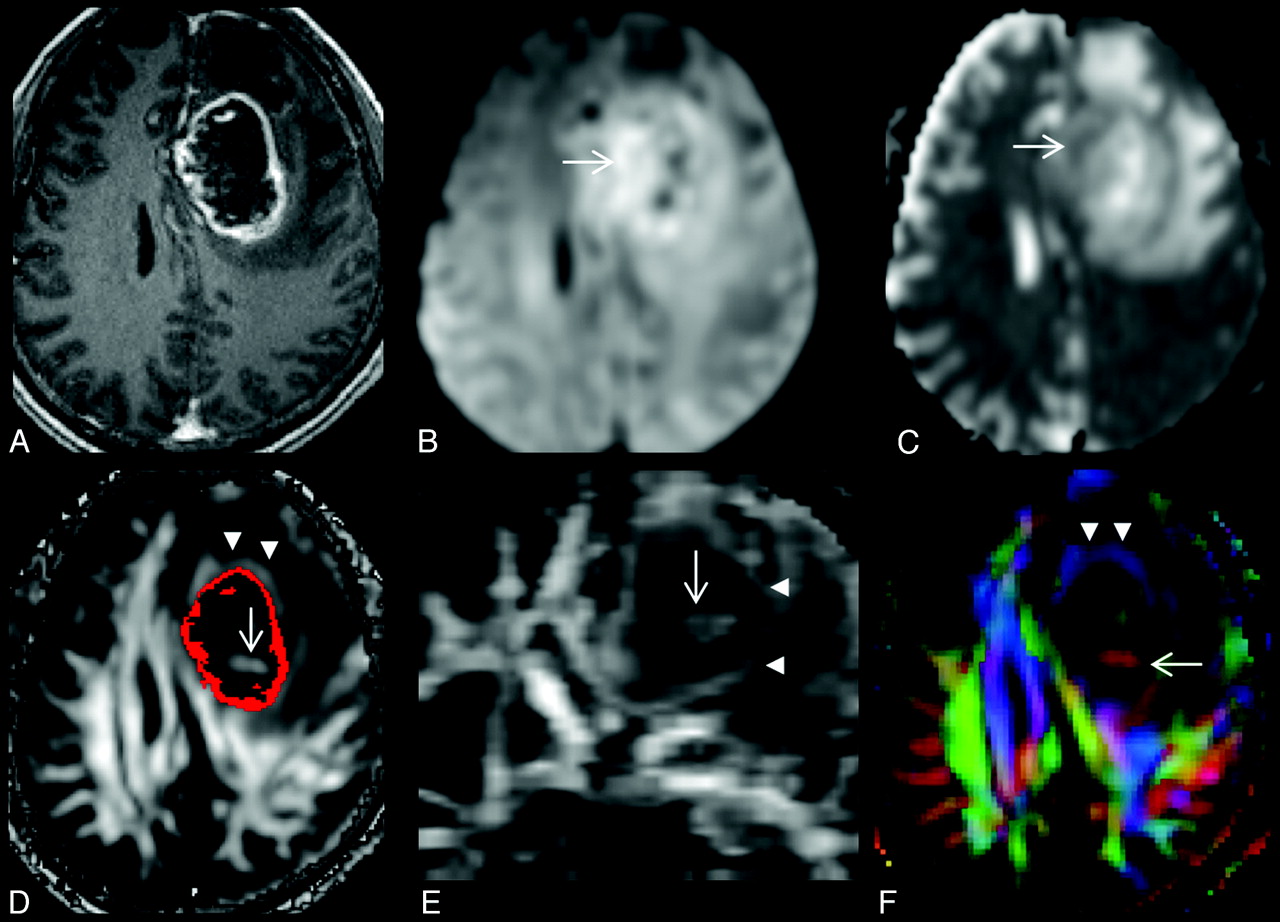
A, A 68-year-old man with a left frontal glioblastoma, which appears as a rim-enhancing mass on the axial contrast-enhanced T1-weighted image. B and C, On the axial DWI (B) and MD map (C), restricted diffusion is present at the lesion periphery (arrow). D and E, Intralesional hyperintensities (arrow) are seen on axial (D) and coronal (E) FA maps. A red scattered ROI representing a contrast-enhancing rim is overlaid on the FA map (D). F, Note that there is a hyperintense FA rim (arrowheads in D, E, and F) in the perifocal edema, external to the enhancing rim. Directional-coded (F) FA map displays the directionality of hyperintense FA rim and intralesional hyperintensity. The FA values are 0.09 for the central nonenhancing portion and 0.13 for the peripheral enhancing portion. The MD values (× 10−3 mm2/s) are 1.530 for the central nonenhancing portion and 1.252 for the peripheral enhancing portion.
FA and MD Measurements
On the basis of T2-weighted and postcontrast MPRAGE imaging, each lesion was manually segmented section by section by into 3 nonoverlapping ROIs (ie, nonenhancing portions, enhancing portions, and perilesional edema) from which MD and FA were measured and then averaged, respectively. A polygonal ROI was first drawn to include entire lesion. A threshold pixel value was manually chosen to create a scatter ROI to segment the enhancing portion of the lesion. The adequacy of segmentation was visually assessed by a neuroradiologist. Then the nonenhancing portion of the lesion and the perilesional edema were segmented sequentially. To avoid overlapping of the ROI, we nulled all pixels within each created ROI before segmentation of the next one. The perifocal edema would include only the hyperintense FA rim if it was present or arbitrarily chosen as a 6-mm-wide band, which was the mean width of the hyperintense FA rim in this study. The segmentation of the ROI and measurement of MD and FA were performed by 1 neuroradiologist.
Statistical Analysis
The incidence of intralesional hyperintensities on FA maps, restricted diffusion in the lesion periphery, and a perilesional hyperintense FA rim of TDLs and high-grade gliomas was examined by using a χ2 test. Sensitivity, specificity, and accuracy in differentiating TDLs from high-grade gliomas were calculated for the imaging signs with statistically significant differences. The mean FA and MD values for each ROI were compared with a 2-sample t test. A commercially available statistical software package (Statistical Package for the Social Sciences, Version 17; SPSS, Chicago, Illinois) was used for analysis, and P values < .05 were considered statistically significant.
Results
Visual Inspection
Intralesional hyperintensities on FA maps were observed in 6 of 8 TDLs (75%) and 4 of 13 high-grade gliomas (30.8%). The incidence was significantly higher in TDLs (P = .049, odds ratio = 6.8, sensitivity = 75%, specificity = 69.2%, accuracy = 71.4%). In TDLs, the intralesional hyperintensities were visualized in the lesion center (n = 3) and periphery (n = 6) that was close to or within the region having contrast enhancement. In high-grade gliomas, the intralesional hyperintensities were present in the lesion center. Restricted diffusion in the lesion periphery was present in 7 of 8 TDLs (87.5%) and 7 of 13 high-grade gliomas (53.8%). Their incidence was not different statistically (P = .112). A perilesional hyperintense FA rim in the perifocal edema was found in 1 of 8 TDLs (12.5%) and 12 of 13 high-grade gliomas (92.3%). The incidence was significantly higher in high-grade gliomas (P < .001, odds ratio = 84, sensitivity = 92.3%, specificity = 87.5%, accuracy = 90.4%).
Results of visual inspection of TDLs and high-grade gliomas
MD and FA of TDLs and high-grade gliomasa
FA and MD Measurement
The mean FA values of the central nonenhancing portions of the lesions were 0.06 ± 0.02 for TDLs and 0.07 ± 0.03 for high-grade gliomas. The mean MD values (×10−3 mm2/s) of the central nonenhancing portions of the lesions were 1.702 ± 0.414 for TDLs and 1.806 ± 0.578 for high-grade gliomas. Both FA and MD values measured in the central nonenhancing portions of the lesions were not statistically different between TDLs and high-grade gliomas.
The mean FA values of the peripheral enhancing portions of the lesions were 0.18 ± 0.05 for TDLs and 0.12 ± 0.01 for high-grade gliomas. The mean MD values (×10−3 mm2/s) of the peripheral enhancing portions of the lesions were 0.887 ± 0.265 for TDLs and 1.237 ± 0.124 for high-grade gliomas. TDLs had significantly higher FA (P = .004) and lower MD (P = .001) compared with high-grade gliomas.
The mean FA values of the perilesional edema were 0.11 ± 0.01 for TDLs and 0.17 ± 0.03 for high-grade gliomas. The mean MD values (×10−3 mm2/s) of the perilesional edema were 1.411 ± 0.262 for TDLs and 1.270 ± 0.121 for high-grade gliomas. The perilesional FA values were significantly higher in high-grade gliomas (P = .001). The perilesional MD values were not different between TDLs and high-grade gliomas.
Discussion
Our study shows that TDLs had a significantly higher incidence of intralesional hyperintensities on FA maps but a lower incidence of a perilesional hyperintense FA rim compared with high-grade gliomas on visual inspection. On quantitative analysis, the peripheral enhancing portions of TDLs had significantly higher FA but lower MD compared with high-grade gliomas. In perilesional edema, FA values were significantly higher in high-grade gliomas. Their differences on DTI suggest that their microscopic water diffusion properties were different.
The pathology of TDLs is similar to that of prototypic multiple sclerosis.16 In acute active demyelinating plaques, inflammation and demyelination occurs with myelin-laden foamy macrophages distributed throughout the lesions. In chronic active demyelinating plaques, active inflammation and demyelination are limited at the lesion periphery but subside in the lesion center with the formation of demyelinated axons and traversing glial tissue.17 On MR imaging, the peripheral enhancing portion of TDLs is believed to be the leading edge of demyelination due to transient impairment of the blood-brain barrier associated with inflammatory infiltration.
In this study, MD values in the peripheral enhancing portions of TDLs were lower than those of high-grade gliomas. We speculate that the lower MD is due to hypercellularity secondary to the infiltration of inflammatory cells and reactive astrocytosis.17 For the higher FA found in the peripheral enhancing portions of TDLs, we propose 2 possible explanations. First, positive correlations between FA and the number of inflammatory cells have been reported in brain abscesses.18,19 We speculate that active inflammation found in the lesion periphery may partly contribute to the higher FA. Second, because the WM in the periphery of TDLs is incompletely demyelinated, maintaining some residual diffusion anisotropy, its FA values will be greater than those in the enhancing rim of high-grade gliomas, which consists of viable tumor cells and is absent of WM. This could also explain the presence of hyperintensities in the periphery of TDLs visible on FA maps.
Intralesional hyperintensities on FA maps were also found in the central portion of TDLs. The pathologic basis of these hyperintensities is not known. In patients with multiple sclerosis treated with natalizumab, an anti-inflammatory drug, an elevation of FA in demyelinating plaques following therapy was proposed to be related to remyelination.20 Therefore, we speculate that these hyperintensities found in the central nonenhancing portion of TDLs may represent remyelination, an explanation in accordance with observations of others.21,22 However, because their volumes were small compared with entire TDLs, their effect on overall MD and FA values was limited. As a result, both FA and MD values were not different between TDLs and high-grade gliomas in the central nonenhancing portion of the lesions. The absence of differences indicated that water diffusivity in the central necrotic tumor tissue and completely demyelinated WM was similar. This finding supports MD and FA values being closely related to myelination.23
On the other hand, intralesional hyperintensities were also present in central nonenhancing portions of high-grade gliomas. They were unlikely to be artifacts from tumor hemorrhage24 because the susceptibility effect was not evident on pulse sequences like T1-weighted and T2-weighted images and DWI (b-value = 0) included in our study. Although the causes of these hyperintensities in high-grade gliomas are not known, their presence had been reported in previous studies.15,25⇓–27 We speculate that these hyperintensities may represent tumor parts with focal high cellularity.13
On visual inspection, the perilesional hyperintense FA rim is the most sensitive, specific, and accurate sign in differentiating TDLs from high-grade gliomas. The lower incidence of a hyperintense FA rim associated with TDLs was concurrently supported by quantitative analysis finding that perilesional FA values were significantly lower in TDLs than in high-grade gliomas. The presence of a perilesional hyperintense FA rim might not simply be due to a compressive effect on surrounding tissues by the tumor. Rather, we speculate it may be related to the duration of the gliotic response present in the perifocal edema.28 In TDLs, the gliotic response may occur at a relatively earlier stage when glial fibers are arranged irregularly. In the relatively long-standing edema surrounding high-grade gliomas, glial fibers may assume a more regular arrangement, resulting in a more organized water diffusion that appears as a hyperintense FA rim on DTI.
Our study is limited by the relatively small number of patients with TDLs, but overall, in our experience, TDLs are uncommon lesions. Because we did not have direct histopathologic correlation with DTI findings, we could not definitely correlate tissues leading to the differences between TDLs and high-grade gliomas on visual inspection and quantitative measurements.
Conclusions
The enhancing portions of TDLs were significantly different from those of high-grade gliomas on quantitative DTI analysis. The presence of intralesional hyperintensities on FA maps and the absence of a perilesional hyperintense FA rim favors the diagnosis of TDLs. DTI is able to help differentiate TDLs from high-grade gliomas.
Footnotes
-
This work was partly supported by grants from the National Science Council (NSC-98-2314-B-182A-051-MY3 to C.H. Toh, NSC-98-2627-B-010-008, NSC-98-2923-B-010-001-MY3, and NSC 100-2627-B-010-004 to C.-P. Lin) and the National Health Research Institute (NHRI-EX99-9813EC to C.-P. Lin). The authors also acknowledge support from the Animal Molecular Imaging Center, Chang Gung Memorial Hospital at Linkou, and the MRI Core Laboratory of National Yang-Ming University that was funded from the Ministry of Education of Taiwan (Aim for the Top University Plan)
-
Disclosures: Cheng Hong Toh—RELATED: Grant: National Science Council, Comments: The grant will help cover the following: 1) significant portion of the cost of MR imaging for each patient, 2) office supplies, and 3) salary and health insurance of a research assistant. Mauricio Castillo—UNRELATED: Employment: American Society of Neuroradiology, Comments: American Journal of Neuroradiology Editor-in-Chief; Royalties: Elsevier, Lippincott, Cambridge, Comments: book royalties. Ching-Po Lin—RELATED: Grant: National Science Council and National Health Research Institute of Taiwan, Comments: to cover the cost of MR imaging for each patient.
Indicates open access to non-subscribers at www.ajnr.org
References
- Received June 17, 2011.
- Accepted after revision July 28, 2011.
- © 2012 by American Journal of Neuroradiology
In this issue


Jump to section
Related Articles
Cited By...
- MRI Findings in Tumefactive Demyelinating Lesions: A Systematic Review and Meta-Analysis
- Combining Diffusion Tensor Metrics and DSC Perfusion Imaging: Can It Improve the Diagnostic Accuracy in Differentiating Tumefactive Demyelination from High-Grade Glioma?
- Diagnostic Utility of Diffusion Tensor Imaging in Differentiating Glioblastomas from Brain Metastases
- Assessment of Angiographic Vascularity of Meningiomas with Dynamic Susceptibility Contrast-Enhanced Perfusion-Weighted Imaging and Diffusion Tensor Imaging