
Abstract
BACKGROUND AND PURPOSE: Preoperative evaluation of pituitary macroadenoma tumor consistency is important for neurosurgery. Thus, we aimed to retrospectively assess the role of contrast-enhanced FIESTA in predicting the tumor consistency of pituitary macroadenomas.
MATERIALS AND METHODS: Twenty-nine patients with pituitary macroadenomas underwent conventional MR imaging sequences and contrast-enhanced FIESTA before surgery. Two neuroradiologists assessed the contrast-enhanced FIESTA, contrast-enhanced T1WI, and T2WI. On the basis of surgical findings, the macroadenomas were classified by the neurosurgeons as either soft or hard. Finally, Fisher exact probability tests and unpaired t tests were used to compare predictions on the basis of the MR imaging findings with the tumor consistency, collagen content, and postoperative tumor size.
RESULTS: The 29 pituitary macroadenomas were classified as either solid or mosaic types. Solid type was characterized by a homogeneous pattern of tumor signal intensity without intratumoral hyperintense dots, whereas the mosaic type was characterized by many intratumoral hyperintense dots on each MR image. Statistical analyses revealed a significant correlation between tumor consistency and contrast-enhanced FIESTA findings. Sensitivity and specificity were higher for contrast-enhanced FIESTA (1.00 and 0.88–0.92, respectively) than for contrast-enhanced T1WI (0.80 and 0.25–0.33, respectively) and T2WI (0.60 and 0.38–0.54, respectively). Compared with mosaic-type adenomas, solid-type adenomas tended to have a hard tumor consistency as well as a significantly higher collagen content and lower postoperative tumor size.
CONCLUSIONS: Contrast-enhanced FIESTA may provide preoperative information regarding the consistency of macroadenomas that appears to be related to the tumor collagen content.
ABBREVIATIONS:
- CE
- contrast-enhanced
- PCC
- percentage of collagen content
- SI
- signal intensity
The transsphenoidal approach of removing pituitary adenomas has been widely adopted as a safe and effective method.1,2 Recently, the endoscopic transsphenoidal technique has been applied as a minimally invasive surgery to remove pituitary adenomas.3 Most pituitary adenomas are soft and thus can be adequately removed by aspiration and curettage via the transsphenoidal route. However, 5–15% of pituitary adenomas are firm and fibrous. This can occur quite often, and, unfortunately, there are no preoperative predictors of its occurrence.4 Thus, preoperative evaluation of tumor consistency is essential for neurosurgeons.
Previous studies have attempted to predict pituitary macroadenoma tumor consistency by use of conventional MR imaging techniques.5⇓–7 However, the ability of MR images to predict pituitary macroadenoma consistency is controversial.8 FIESTA can provide strong T2 contrast, emphasizing the water content signal, including CSF. This sequence also has a high signal intensity –to-noise ratio, inherent flow compensation, and is suitable for direct 3D imaging.9,10 Although FIESTA is predominantly used for T2WI, it also enables T1 contrast and portrays contrast enhancement with increased concentration of gadolinium-based contrast reagents.11 Therefore, previous studies have reported that contrast-enhanced (CE) FIESTA can enable visualization of the boundary between brain tumors and surrounding structures, and CE-FIESTA is effective for preoperative evaluation of skull base tumors.12,13
In the clinic, we have previously noticed that pituitary macroadenomas have various CE-FIESTA signal intensities. Therefore, we hypothesized that CE-FIESTA might allow identification of the water content or vascularity within tumors to give an indication of tumor consistency. The purpose of this retrospective study was to assess the ability of CE-FIESTA to predict pituitary macroadenoma tumor consistency.
Materials and Methods
Patients and Clinical Data
This study was approved by our institutional review board. We retrospectively evaluated 32 consecutive patients with pituitary macroadenomas who underwent surgery between September 2006 and May 2011. All patients underwent brain MR imaging, including CE-FIESTA, before surgery. Pituitary macroadenomas were defined as adenomas that exceeded 10 mm in diameter, on the basis of preoperative MR imaging. Subjects who had received previous surgery or any other therapy (chemotherapy or radiation therapy) for the pituitary macroadenoma were excluded from this study because the tumors might have induced fibrous changes.
Imaging Data Acquisition
MRI was performed by use of a 3T unit (Signa Excite; GE Healthcare, Milwaukee, Wisconsin) with a dedicated 8-channel phased-array coil (USA Instruments, Aurora, Ohio) after intravenous administration of 0.1 mmol/kg body weight gadodiamide hydrate (Omniscan; Daiichi Pharmaceutical, Tokyo, Japan) or gadopentetate dimeglumine (Magnevist; Bayer Schering-Pharma, Berlin, Germany). The FIESTA sequence was performed by use of the following parameters: repetition time, 5.4 ms; echo time, 2.4 ms (5.4/2.4); acquisitions, 2; flip angle, 50°; bandwidth, 662.5 kHz; matrix, 224 × 224; 100% image; section thickness, 0.8 mm; field of view, 14 × 14 cm; resolution, 0.6 × 0.6 × 0.8 mm; and imaging time, 5 minutes, 6 seconds. CE-FIESTA of all patients was acquired in the coronal plane. In addition, all patients underwent our standard brain MR imaging protocol for suprasellar tumors, including coronal T2WI with 3.0-mm-thick sections, coronal T1WI, and CE-T1WI (coronal CE spin-echo or axial CE-3D fast spoiled gradient-echo imaging). The CE-3D fast spoiled gradient-echo imaging data were reconstructed in the sagittal and coronal planes. The following imaging parameters were used for coronal T2WI: 4000/85 msec; flip angle, 90°; bandwidth, 62.5 kHz; section thickness, 3.0 mm; matrix, 512 × 224; field of view, 18 × 18 cm; and imaging time, 2 minutes, 16 seconds. The following imaging parameters were used for CE spin-echo imaging: 400/4 msec; flip angle, 100°; bandwidth, 62.5 kHz; section thickness, 3.0 mm; matrix, 224 × 224; field of view, 18 × 18 cm; and imaging time, 2 minutes, 40 seconds. The following parameters were used for CE spoiled gradient-echo imaging: 10/4 msec; flip angle, 10°; bandwidth, 42 kHz; section thickness, 1.2 mm; matrix, 256 × 256; field of view, 24 × 24 cm; and imaging time, 3 minutes, 56 seconds. Parallel imaging techniques (a reduction factor of 2) were used only for T2WI and CE spoiled gradient-echo images.
Image Analyses
First, we hypothesized that CE-FIESTA of pituitary macroadenomas would correlate with tumor consistency, in particular with the degree of hardness. Therefore, an experienced neuroradiologist (S.K., with 16 years of experience in neuroradiology) was blinded to the clinical information (ie, tumor consistency at surgery). The soft-tissue compartments of the pituitary macroadenomas were subjectively classified on the basis of CE-FIESTA, CE-T1WI, and T2WI data into 2 types, solid and mosaic, by the neuroradiologist. “Solid” was defined as a relatively homogeneous lesion (Fig 1–1) and “mosaic” was defined as a lesion containing small multiple hyperintense dots (ranging in size from 0.5 mm to <2 mm) that were uniformly distributed throughout the soft-tissue compartment of the adenoma (Fig 1–2). Subsequently, 2 other neuroradiologists (Y. Kai and J.M., with 17 and 10 years of experience in neuroradiology, respectively) independently reviewed the CE-FIESTA, CE-T1WI, and T2WI data. These reviewers were also blinded to the clinical data. Two training cases (1 adenoma with a solid pattern and 1 with a mosaic pattern) were presented before the tests, and reviewers underwent sufficient training on CE-FIESTA, CE-T1WI, and T2WI to be familiar with the 2 patterns. The reviewers then independently classified each adenoma on the basis of the findings from these images. For both sequences, each image was analyzed separately, and only 1 sequence was shown at a time. Data from the first read were used to calculate the sensitivity, specificity, positive predictive value, and negative predictive value for the MR imaging prediction of hard adenomas.

Classification of pituitary macroadenomas by use of CE-FIESTA, CE-T1WI, and T2WI. 1, Solid type. Schematic drawing and coronal images of CE-FIESTA (A and B), CE-T1WI (C), and T2WI (D) show homogeneous patterns of SI without intratumoral hyperintense dots. 2, Mosaic type. Schematic drawing and coronal images of CE-FIESTA (A and B), CE-T1WI (C), and T2WI (D) show intratumoral hyperintense dots within the tumor.
In accordance with previous research, ROIs for signal intensity (SI) analyses were drawn directly on the images obtained from the T2WI and CE-FIESTA sequences.7 All ROIs were an arbitrarily chosen (by the first neuroradiologist S.K.) uniform shape and size (elliptical, 50 mm2). ROIs were anatomically identified in the central and solid-appearing portions of the macroadenomas. ROIs were also placed in the normal white matter of the temporal lobe on the same section. To avoid scaling problems on each MR image, we calculated SI ratios for all images by use of the following formula: SI ratio = SI of tumor/SI of normal white matter. After the surgery, the maximum craniocaudal size of the pituitary macroadenomas was measured on the sagittal midline CE-T1WI before and after transsphenoidal surgery. To determine whether preoperative CE-FIESTA findings could affect surgical outcome, we calculated the percentage of relative postoperative tumor size by use of the following formula: (size after surgery/size before surgery) × 100.
Surgery
A skilled neurosurgeon (S.N., with 35 years of experience in brain surgery) performed direct transsphenoidal surgery. Immediately after surgical treatment, this neurosurgeon (S.N.) and another experienced neurosurgeon (J.Y., with 16 years of experience in brain surgery and who also assisted during surgery) together assessed tumor consistency by use of surgical notes and the DVD recordings from the operation. Tumors were classified into 2 groups: tumors with soft consistency (easily removable through aspiration or curettage) and tumors with hard consistency (not removable through aspiration and/or curettage and requiring piecemeal resection by use of a microdissector or tumor forceps).
Histologic Study
A pathologist (S.S., with 18 years of experience) performed the subsequent histologic studies. Routine specimen processing involved staining the slides with hematoxylin and eosin, followed by immunohistochemical analyses by use of antibodies for pituitary hormones. Tumor specimens were also histochemically examined for collagen content by use of Masson trichrome staining. To perform quantitative analyses of collagen content, photomicrographs were captured in 5 random regions of each specimen by use of a digital virtual microscope system (NanoZoomer Digital Pathology; Hamamatsu Photonics K.K., Hamamatsu, Japan). The area of collagen stained blue was measured by use of an image processing software program (Image J; National Institute of Mental Health, Bethesda, Maryland). The percentage of collagen content (PCC) was calculated by use of the following formula: PCC = (collagen area/total tumor area) × 100. PCC was calculated in 5 random regions in each specimen, and the mean value was defined as a representative value for each specimen.
Statistical Analyses
Statistical analyses were performed by use of a statistical software package (StatView 5.0; SAS Institute, Cary, North Carolina). For pituitary macroadenoma demographics, correlations between tumor consistency, age, maximum tumor size, and relative postoperative tumor size were tested by use of Fisher exact probability tests. Correlations between tumor consistency, sex, preoperative clinical symptoms, and clinical endocrine classification were tested by use of unpaired t tests. Correlations between MR findings (solid and mosaic types) and tumor consistency on surgery were tested by use of Fisher exact probability tests. Correlations between MR findings and relative postoperative tumor size were tested by use of unpaired t tests. Correlations between tumor consistency, PCC, and the SI ratio were also tested by use of unpaired t tests. A P value of <.05 was considered statistically significant. Diagnostic values for predicting hard adenomas were calculated according to the MR imaging findings, and the accuracies were compared by use of Fisher exact tests. Kendall W tests were used to assess interobserver agreement between radiologists. Interobserver agreement was classified as follows: Kendall W values <0.20 indicated poor agreement, values of 0.21–0.40 indicated fair agreement, values of 0.41–0.60 indicated moderate agreement, values of 0.61–0.80 indicated good agreement, and values of 0.80–1.00 indicated excellent agreement. For the Kendall W coefficients by the 2 radiologists, CE-FIESTA was compared with the CE-T1WI and T2WI by means of χ2 tests.
Results
Of the 32 patients, 3 did not meet the inclusion criteria and were excluded from the study. Therefore, 29 patients with pituitary macroadenomas (18 men, 11 women; mean age, 54.4 ± 17.5 years) were included in this study. The demographic characteristics of the patients are summarized in Table 1. Of the 29 patients, tumor consistency at the time of surgery was classified as hard macroadenoma in 5 patients (17%) and soft macroadenoma in 24 patients (83%) (Table 1). Surgery preserved preoperative anterior and posterior pituitary functions. There were no surgical complications in any of the cases. Two patients did not undergo postoperative MR imaging; thus, the relative postoperative tumor sizes of these patients were not available. Regarding the clinical and operative features of pituitary macroadenomas, there was a significant difference in only relative postoperative tumors between hard and soft adenomas (P < .01) (Table 1). However, there were no significant differences in age, sex, preoperative clinical symptoms, clinical endocrine classification, and maximum tumor size.
Clinical and operative features of pituitary macroadenomas
MR Imaging Findings
All acquired images provided acceptable diagnostic image quality. CE-FIESTA, CE-T1WI, and T2WI showed isointense to hyperintense pituitary macroadenomas with or without hyperintense dots (Figs 2 and 3).

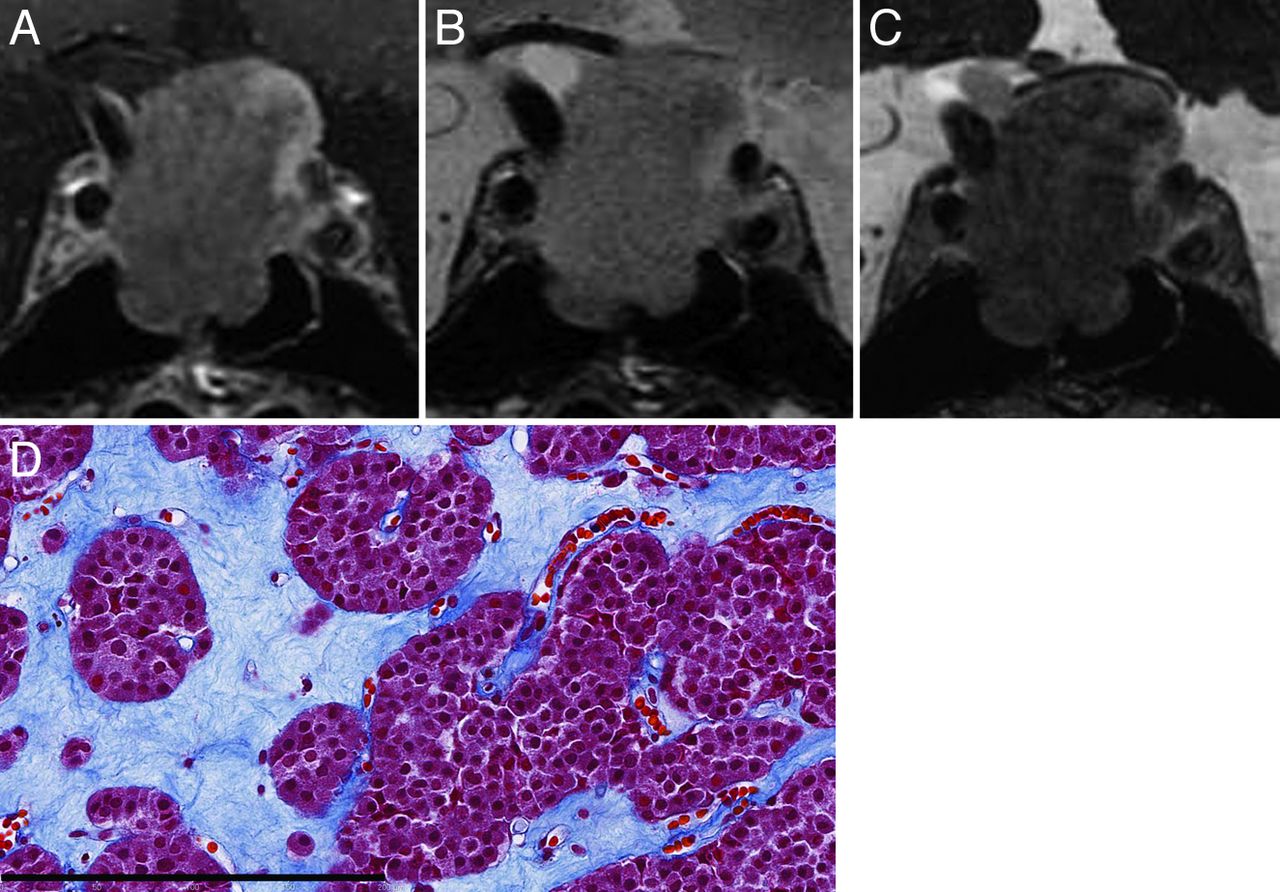
Macroadenoma with hard consistency in a 77-year-old male patient (case 13). A, Coronal CE-T1WI shows a large heterogeneous enhanced pituitary mass. B, Coronal T2WI shows an isointense mass with respect to normal white matter. C, Coronal CE-FIESTA shows a homogeneous tumor SI pattern without intratumoral hyperintense dots. D, Histologic examination of the resected tumor indicates small size and the formation of multiple nests surrounded by attenuated collagen tissue (Masson trichrome stain; scale bar, 200 μm).

Macroadenoma with soft consistency in a 51-year-old female patient (case 28). A, Coronal CE-T1WI shows a large, homogeneous, enhanced pituitary mass. B, Coronal T2WI shows a relatively hyperintense mass with respect to normal white matter. C, Coronal CE-FIESTA shows numerous hyperintense dots within the tumor. D, Histologic examination of the resected tumor indicates small cells with scant collagen in a small, restricted perivascular area (Masson trichrome stain; scale bar, 200 μm).
For evaluation of the CE-FIESTA and T2WI data, the interobserver agreements between reviewers were acceptable, with Kendall W values of 0.73 and 0.613, respectively. In contrast, for the CE-T1WI, the interobserver agreement between the reviewers was fair, with Kendall W values of 0.32. The 5 cases of hard macroadenomas were classified as solid types by use of CE-FIESTA images, whereas 21 (for radiologist 1) or 22 (for radiologist 2) of the 24 soft macroadenomas were deemed mosaic types (Table 2). There was a significant correlation between tumor consistency at the time of surgery and the CE-FIESTA findings by each reviewer (P < .01) but not between tumor consistency and the CE-T1WI and T2WI findings. Moreover, regarding the CE-FIESTA data, the percentage of relative postoperative tumor size in the solid group was significantly higher than that of the mosaic group (P < .01). In contrast, analyses of the reviewers revealed no correlation between CE-T1WI and T2WI findings and the percentage of relative postoperative tumor size.
Effectiveness of CE-FIESTA and CE-T1WI findings for surgery of pituitary macroadenomas
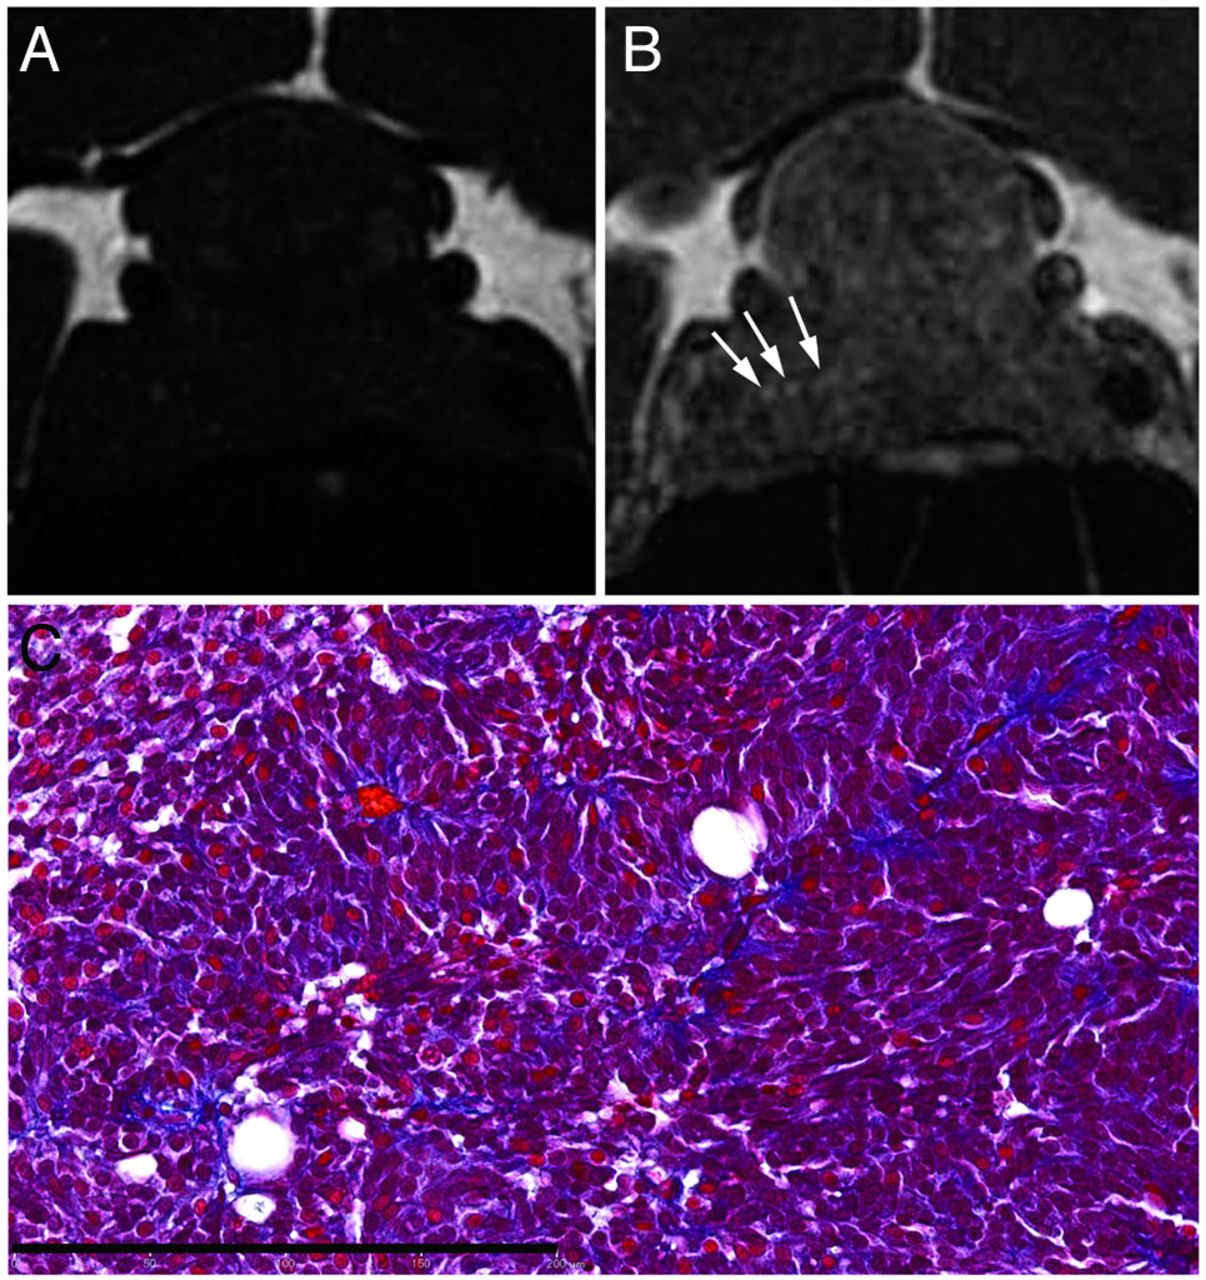
The diagnostic accuracy of analyses for the reviewers is outlined in Table 3. Regarding the prediction of hard adenomas, the mean sensitivity, specificity, and accuracy of CE-FIESTA were 1.00, 0.90, and 0.92, respectively. Accuracy by use of CE-FIESTA data was significantly higher than the accuracy value by use of CE-T1WI and T2WI (P < .01). Only 1 patient with a soft macroadenoma underwent both unenhanced and CE-FIESTA imaging (Fig 4). This patient had intratumoral hyperintense dots that were only apparent with CE-FIESTA; unenhanced-3D FIESTA displayed no intratumoral hyperintense dots.
Diagnostic accuracy in prediction of tumor consistency

Macroadenoma with soft consistency in a 44-year-old female patient (case 29). A, Unenhanced coronal FIESTA image, and B, corresponding coronal CE-FIESTA image. Intratumoral hyperintense dots are shown on CE-FIESTA (arrows in B) but not on unenhanced FIESTA. C, Histologic examination of the resected tumor shows scant collagenous tissues in a perivascular area (Masson trichrome stain; scale bar, 200 μm).
Findings of CE-FIESTA, Surgery, and Histologic Analyses
On histologic examination, tumors displayed trabecular, papillary, or sheetlike patterns, with some variance of perivascular fibrosis. Masson trichrome staining revealed significant fibrosis in the perivascular tissue consisting of collagen (Figs 2D, 3D, and 4C). Macroadenomas in the hard tumor consistency group exhibited low cellularity and abundant collagenous stroma (Fig 2D). In contrast, macroadenomas in the soft tumor consistency group exhibited high cellularity and scant collagenous stroma (Figs 3D and 4C). The collagen content of hard macroadenomas was significantly higher than that of soft macroadenomas (P = .0002) (Table 4). The SI ratio on CE-FIESTA showed significant differences between hard and soft macroadenomas (P = .0106). However, no significant differences in the SI ratio on T2WI were found between the groups (P = .3271) (Table 4).
Tumor consistency, SI ratio, and CE-FIESTA findings compared with collagen contents
With regard to the tumor classifications on the basis of CE-FIESTA findings, the percentage of collagen content in the solid and mosaic types were 40.9 ± 26.3% (mean ± SD; n = 8) and 12.0 ± 7.5% (n = 21) for radiologist 1, respectively, and 35.7 ± 25.2% (n = 7) and 14.9 ± 15.0% (n = 22) for radiologist 2, respectively (Table 4). There were significant differences between both types (P < .01). In contrast, analyses from both radiologists revealed no correlation between CE-T1WI and T2WI findings and the percentage of collagen content (Table 4).
Discussion
In the present study, we evaluated whether CE-FIESTA could predict tumor consistency in pituitary macroadenomas. Our results suggest that CE-FIESTA is a useful imaging sequence for this estimation. To the best of our knowledge, this is the first study to assess pituitary macroadenoma tumor consistency on the basis of CE-FIESTA findings.
Previous studies have histologically evaluated tumor consistency by assessing the amount of collagen or reticulin within macroadenomas.5,6,14 In the present study, we also performed histologic examinations by use of Masson trichrome staining. Our results indicate that the collagen content in hard macroadenomas is higher than that in soft adenomas, which is consistent with previous reports.5,14 On the basis of Azan, van Gieson, and Sirius red staining methods, previous studies have reported mean percentages of collagen contents of 7.23–26.1% for hard adenomas and 0.22–6.5% for soft adenomas.5,14 Our results found that the mean percentages of collagen content for both hard and soft adenomas were higher than those seen in previous studies. However, these discrepancies might be caused by differences in staining techniques. Moreover, we found that the collagen content correlated with tumor consistency, as evaluated by the subjective judgment of neurosurgeons with substantial experience with pituitary macroadenomas.
Our results suggest that tumor classification by use of CE-FIESTA more accurately predicts the consistency of pituitary macroadenomas than do conventional MR imaging methods, such as CE-T1WI and T2WI. Moreover, the percentages of relative postoperative tumor size in the solid group on the basis of CE-FIESTA data were significantly higher than in the mosaic group. The SI ratio on CE-FIESTA for soft tumors was higher than that for hard tumors, though there was no correlation between the SI ratio on T2WI and tumor consistency. However, it is important to note that qualitative assessments of hyperintense dots on CE-FIESTA were able to discriminate between soft tumors and hard tumors with high accuracy. Quantitative assessment of the SI ratio typically varies with the individual. These results suggest that it is possible to diagnose tumor consistency on an individual basis from MR images without quantitative SI assessment.
The ability of DWI to predict tumor consistency in pituitary macroadenomas has been controversial. Only 3 studies by use of DWI to evaluate tumor consistency in pituitary macroadenomas have been reported.6,7,15 Two of 3 studies suggested a significant correlation between tumor consistency and ADC values in pituitary macroadenomas,6,7 whereas the third study indicated no relationship between tumor consistency and ADC values.15 DWI has lower spatial resolution compared with other conventional MR images. Moreover, for evaluation of the pituitary gland, artifacts that relate to bone structure or sinus aeration can degrade the image quality of DWI. Thus, placement of the ROI to measure the ADC value in pituitary macroadenomas may strongly affect the results in the previous studies. In contrast, FIESTA sequences, with high spatial resolution and reduced susceptibility artifacts, may be appropriate for assessing pituitary macroadenomas.
Although only 1 patient with soft macroadenomas underwent both unenhanced and CE-FIESTA, we found that hyperintense dots were identified by use of CE-FIESTA but not unenhanced FIESTA (Fig 4). This suggests that hyperintense dots may reflect water content but also might be the result of enhancement caused by contrast reagents. Histologically, the pituitary gland exhibits a distinct acinar architecture composed of rigid reticulin walls. Generally, pituitary adenomas proliferate and destroy these walls and present a variety of growth patterns.16 In the present study, in contrast to hard macroadenomas (Fig 2D), soft macroadenoma pathologic specimens showed typical destruction and thinning of the rigid reticulin walls and the presence of low collagen content (Figs 3D and 4C). Although the mechanism involved in CE-FIESTA is controversial, we speculate that the hyperintense dots apparent on CE-FIESTA may reflect enhancement of macroadenoma parenchyma as well as leakage and retention of contrast reagents into loose connective tissue and extracellular space that no longer have rigid reticulin walls. In addition, the hyperintense dots were more frequently observed on CE-FIESTA compared with CE-T1WI, which may be explained by differences in the effect of contrast material between both sequences. Moreover, the high spatial resolution of CE-FIESTA, including thinner sections and reduction of the partial volume effects, may allow increased detection of hyperintense dots.
Our study has several limitations. First, histopathological confirmation of the entire tumor architecture was not obtained. Therefore, it was not possible to correlate the pathologic and radiologic findings. Moreover, it is unknown how specific pathologic changes in the macroadenoma are related to the hyperintense dots observed on CE-FIESTA. In addition, it was difficult to preserve intact tissue architecture because very little tissue is typically obtained from transsphenoidal surgery. Second, this study was a retrospective analysis with a relatively small sample size. In particular, the incidence of hard adenomas was very low. Thus, future studies should consider the use of a larger sample size. Third, the FIESTA sequence was developed by only 1 vendor. However, previous studies have reported that other balanced steady-state free precession techniques, such as constructive interference in steady state by Siemens Medical Solutions and balanced fast field-echo by Philips Medical Systems, also provide strong T1 and T2 contrast9,17,18 and show contrast enhancement with gadolinium-based contrast reagents.11 This suggests that results similar to those of our study may be reproducible with the use of these sequences developed from different vendors. Fourth, CE-FIESTA was performed after CE-T1WI in all cases. Although the observation of hyperintense dots occurred more frequently on CE-FIESTA compared with CE-T1WI, our results may have been affected by differences in so-called delayed enhancement effects2 caused by the time lag after gadoteridol administration. Therefore, future studies of CE-FIESTA should consider the use of time-intensity curve analysis.
Conclusions
Our study reveals a distinct relationship between CE-FIESTA and intraoperative findings. We propose that CE-FIESTA findings are able to predict tumor consistency in pituitary macroadenomas. Furthermore, we deduced that macroadenomas with many hyperintense dots were indicative of a soft tumor consistency because they contained lower amounts of collagen. Thus, this study indicates that CE-FIESTA is a beneficial and practical MR imaging technique for preoperative evaluation of pituitary macroadenomas.
References
- Received March 19, 2013.
- Accepted after revision May 14, 2013.
- © 2014 by American Journal of Neuroradiology


