
Abstract
BACKGROUND AND PURPOSE: Echo-planar J-resolved spectroscopic imaging is a fast spectroscopic technique to record the biochemical information in multiple regions of the brain, but for clinical applications, time is still a constraint. Investigations of neural injury in obstructive sleep apnea have revealed structural changes in the brain, but determining the neurochemical changes requires more detailed measurements across multiple brain regions, demonstrating a need for faster echo-planar J-resolved spectroscopic imaging. Hence, we have extended the compressed sensing reconstruction of prospectively undersampled 4D echo-planar J-resolved spectroscopic imaging to investigate metabolic changes in multiple brain locations of patients with obstructive sleep apnea and healthy controls.
MATERIALS AND METHODS: Nonuniform undersampling was imposed along 1 spatial and 1 spectral dimension of 4D echo-planar J-resolved spectroscopic imaging, and test-retest reliability of the compressed sensing reconstruction of the nonuniform undersampling data was tested by using a brain phantom. In addition, 9 patients with obstructive sleep apnea and 11 healthy controls were investigated by using a 3T MR imaging/MR spectroscopy scanner.
RESULTS: Significantly reduced metabolite differences were observed between patients with obstructive sleep apnea and healthy controls in multiple brain regions: NAA/Cr in the left hippocampus; total Cho/Cr and Glx/Cr in the right hippocampus; total NAA/Cr, taurine/Cr, scyllo-Inositol/Cr, phosphocholine/Cr, and total Cho/Cr in the occipital gray matter; total NAA/Cr and NAA/Cr in the medial frontal white matter; and taurine/Cr and total Cho/Cr in the left frontal white matter regions.
CONCLUSIONS: The 4D echo-planar J-resolved spectroscopic imaging technique using the nonuniform undersampling–based acquisition and compressed sensing reconstruction in patients with obstructive sleep apnea and healthy brain is feasible in a clinically suitable time. In addition to brain metabolite changes previously reported by 1D MR spectroscopy, our results show changes of additional metabolites in patients with obstructive sleep apnea compared with healthy controls.
ABBREVIATIONS:
- CS
- compressed sensing
- EPSI
- echo-planar spectroscopic imaging
- EP-JRESI
- echo-planar J-resolved spectroscopic imaging
- MRSI
- magnetic resonance spectroscopic imaging
- NUS
- nonuniform undersampling
- OSA
- obstructive sleep apnea
- PRESS
- point-resolved spectroscopy sequence
- ProFit
- prior-knowledge fitting
- tCho
- Cho+glycerylphosphocholine+phosphocholine
- tNAA
- NAA+N-acetyl aspartylglutamate
MR spectroscopy has become a powerful tool for studying the underlying biochemistry of different tissues, a complementary technique to MR imaging.1,2 Single-voxel-based MR spectroscopy techniques, such as stimulated echo acquisition mode and point-resolved spectroscopy sequence (PRESS) record metabolite levels from a single VOI.3,4 To increase the spatial coverage, MR spectroscopic imaging (MRSI) is used to simultaneously record spectra from different regions from a single section or a volume containing multiple sections.5 In addition to the long acquisition time, especially with MRSI, one major drawback of these 1D spectroscopic methods is the inherent overcrowding of spectra due to overlapping peaks. This limitation can be overcome by increasing the number of spectral dimensions to 2 by using 2D MR spectroscopy sequences such as localized J-resolved spectroscopy and localized correlated spectroscopy.6,7 A limitation of the single-voxel-based 2D MR spectroscopy sequences is that it takes >15 minutes per VOI and recording 2D MR spectroscopy data from multiple VOIs could take hours.
Traditional 2D or 3D MRSI using conventional phase-encoding schemes takes an hour or longer for a single scan, depending on the number of spatial-encoding steps, averages, TRs, and other factors. The acquisition of 2D/3D MRSI has been greatly shortened by using echo-planar spectroscopic imaging (EPSI), in which a time-varying readout gradient echo train interleaves the encoding of 1 spatial and 1 spectral (temporal) dimension, leaving the remaining spatial dimensions to be incrementally phase-encoded.8,9 Combining the speed advantage of the EPSI readout and the increased spectral dispersion offered by 2D localized J-resolved spectroscopy results in 4D echo-planar J-resolved spectroscopic imaging (EP-JRESI), which is capable of recording better-resolved 2D spectra from multiple regions.10,11 In the EP-JRESI sequence, the EPSI readout acquires 1 spatial (kx) and 1 temporal (t2) dimension simultaneously, leaving the remaining spatial and spectral dimensions (ky and t1, respectively) to be incrementally collected. This leaves a scanning time on the order of 20+ minutes, still somewhat limiting the clinical applicability.
During the past 7 years, compressed sensing (CS) has been successfully used for the reconstruction of nonuniformly undersampled MR imaging and MRSI data.12⇓–14 Two major criteria have been proposed for CS to be successfully applied: First, the data must have a sparse representation in some transform domain; and second, the nonuniform undersampling (NUS) must be such that it produces incoherent aliasing artifacts within the transform domain. With these conditions, the fully sampled dataset can be recovered by using nonlinear reconstruction algorithms that attempt to enforce the sparsity while simultaneously maintaining the fidelity of the original measurements to within the noise. NUS can be used in the individually phase-encoded (ky t1) plane, by using CS to reconstruct the equivalent missing data to a fully sampled 4D EP-JRESI acquisition.
We applied this approach in obstructive sleep apnea (OSA) syndrome, which affects approximately 10% of the adult population and leads to numerous health problems, including symptoms and comorbidities involving CNS impairment.15,16 The causes of OSA seem to be multifactorial,2 and many clinical and physiologic characteristics of OSA appear to derive from brain abnormalities, such as cognitive, mood, and autonomic problems. Many structural imaging studies have shown brain tissue changes at the voxel level, describing the nature of neural and axonal changes16⇓⇓–19 in OSA, but to date, only a limited number of MR spectroscopy–based studies can be found. The MR spectroscopy studies based mainly on 1D spectroscopy have reported differences in NAA, Cho, and myo-Inositol relative to Cr in frontal, hippocampal, and occipital regions in OSA.2,19⇓⇓–22
Two goals of this study were as follows: 1) to further optimize the recently implemented NUS-based 4D EP-JRESI acquisition and CS reconstruction14 for human brain and to determine the reproducibility of CS reconstructions to quantify the cerebral metabolites by using the prior-knowledge fitting (ProFit) algorithm23⇓–25; and 2) to evaluate the novel accelerated 4D spectroscopic imaging and nonlinear reconstruction in patients with OSA and healthy controls. We tested 2 hypotheses: 1) The NUS-based 4D EP-JRESI data acquisition and CS reconstruction will shorten the total acquisition duration from 51 to 12 minutes; and 2) the 4D EP-JRESI data with improved spectral dispersion will detect additional metabolites, including aspartate, glutathione, ascorbate, γ-aminobutyrate, glycerylphosphocholine, glutamate, glutamine, phosphocholine, taurine, scyllo-Inositol, and ethanolamine groups, in comparison with the 1D EPSI.
Materials and Methods
The 4D EP-JRESI sequence was modified to accommodate the NUS in the kyt1 plane as described recently.14 To compare the quality of the CS reconstructed NUS EP-JRESI data, we collected fully encoded phantom data together with prospectively undersampled phantom scans. Furthermore, numerous retrospective undersampling and reconstructions were performed on a fully sampled brain EP-JRESI phantom dataset to assess the reproducibility. To determine the usefulness of the CS reconstructed data, we performed visual analysis of the 2D spectra followed by quantitative analysis by using the ProFit algorithm.23⇓–25 All data were acquired on a 3T Trio-Tim MR spectroscopy/MR imaging scanner (Siemens, Erlangen, Germany) by using the VB17a compiler (Siemens) with an 8-channel head “receive” coil.
Theory
The reconstructed image, denoted u, in CS MR imaging is a solution to the constrained optimization problem as shown below:
 where Ψ is the sparsity transform (in which the final reconstructed data, u, is sparse), Fp is the partial Fourier measurement operator, d is the undersampled data collected from the scanner, σ is a fidelity factor, and ‖x‖n is the ℓn norm.
In this work, we performed the CS reconstruction by using total variation (TV) as a regularizer and by enforcing the sparsity in the identity domain. A similar approach of using identity matrix for sparsity has been reported for 2D nuclear MR spectra.26 Consequently, the constrained problem in equation 1 can be written as an unconstrained problem,
 where α, β are positive parameters, λ is a regularization parameter that weighs the sparsity against the data consistency, u = R(x, y, F1, F2) is the final dataset, Fp is applied only along the y and F1 dimensions, and d = r(x, ky, t1, F2) is the sampled data.
As discussed recently,14 the final 4D dataset, R(x, y, F1, F2) = F{r(kx, ky, t1, t2)}, is composed of 2 spatial and 2 spectral dimensions in a fully sampled EP-JRESI sequence. For every point in the xy spatial plane (voxel), there is a 2D J-resolved spectrum (F1, F2). Due to the NUS, the (ky t1) plane will have incoherent aliasing in the yF1 plane following Fourier transformation.
k-Space Sampling Scheme
We used an exponentially decaying sampling density scheme to downsample the fully sampled 4D EP-JRESI data from the brain phantom for retrospective study and also for the prospective in vivo study.
The sampling scheme is defined as
 where η(ky, t1) is the probability that a data point is sampled and −ky,max ≤ ky ≤ ky,max, 0 ≤ t1 ≤ t1,max and a and b are flexible parameters that determine the acquired percentage of data. The NUS data were simulated by zeroing data points in the fully sampled kyt1 plane for reduction factors corresponding to retention of 25% of the original full sampled data with the exponentially decaying sampling density scheme described above (Fig 1A).

A, The mask used to undersample the kyt1 plane, where the white points indicate those that were sampled. B, The multivoxel spatial distribution of 2D diagonal peaks of Cr and Cho at 3.0/3.2 ppm overlaid on the T1-weighted axial MR imaging, with the white box indicating the PRESS localization of prospectively undersampled data with only 25% of the samples as required by the Nyquist-Shannon criterion. C, CS reconstruction of the same data.
Phantom
A 500-mL brain phantom was prepared, containing the following metabolites at physiologic concentrations as reported in healthy human brain23,27: Cr (7 mmol/L), NAA (8.9 mmol/L), N-acetylaspartylglutamate (0.51 mmol/L), glutamate (12.5 mmol/L), glutamine (2.5 mmol/L), mIns (4.4 mmol/L), Cho (0.9 mmol/L), phosphocholine (0.6 mmol/L), taurine (1.8 mmol/L), glutathione (2.0 mmol/L), glucose (1.0 mmol/L), lactate (1.0 mmol/L), γ-aminobutyrate (0.7 mmol/L), aspartate (2.1 mmol/L), phosphoethanolamine (1.0 mmol/L), and threonine (0.3 mmol/L). Both fully sampled and prospectively undersampled phantom scans were recorded by using the following parameters: a 1 × 1 × 2 cm3 voxel for VOI localization, 64t1 increments with Δt1 = 1 ms, 512 bipolar echo-pairs with a TR of 0.84 ms, FOV = 16 × 16 cm2, a section thickness of 2 cm, and F1 and F2 bandwidths of 1000 Hz and 1190 Hz, respectively. With TR/TE = 3 s/30 ms and 1 average, the EP-JRESI phantom scan duration for fully sampled studies was approximately 51 minutes, and for 25% undersampled studies, it was 12 minutes. The voxel shim and suppression were done manually, and a line width of 4–6 Hz was achieved. A non-water-suppressed scan was also acquired to correct for eddy currents generated by the EPSI readout and as a reference for coil combination. Additionally, to validate the accuracy of the localization of NUS based EP-JRESI sequence and CS reconstruction, the sequence was performed on a quad phantom consisting of 4 highly concentrated (50 mM) metabolite phantoms (Cho, Cr, NAA, and lactate) submerged in a water bath.10
In Vivo
To determine the applicability in a clinical environment, the NUS-based 4D EP-JRESI acquisition and CS reconstruction were tested in the brains of 11 healthy controls (50.3 ± 7.9 years of age) and 9 patients with OSA (55 ± 9.6 years). Patients with OSA were recruited following a diagnostic sleep study at the UCLA Sleep Disorders Center, based on full overnight polysomnography, scored according to current American Academy of Sleep Medicine criteria. Subjects had experienced OSA for at least 5 years. The mean apnea/hypopnea index was 30.8 ± 15.4 events/h, the SaO2 nadir was 82.7 ± 8.5%, and the baseline SaO2 was 95.2 ± 1.8%. Patients had no history of head injury or neurologic illness. Daytime sleepiness was measured with the Epworth Sleepiness Scale (9.0 ± 4.4). Any evidence of clinical brain pathology was cause for exclusion. An unpublished study of WM hyperintensities including these patients revealed no significant differences relative to matched controls. Written informed consent was obtained before study participation, and all data were acquired in accordance with the institutional review board approved protocol.
Before applying the NUS-based EP-JRESI sequence, we collected 3D high-resolution T1-weighted images for localization by using an MPRAGE pulse sequence. EP-JRESI was performed over 2 sections: 1) an axial section covering the frontal, basal ganglia, and occipital regions; and 2) a coronal section covering the hippocampi, thalami, and so forth. The FOV was 24 × 24 cm2 with 16 × 16 grids with a section thickness of 1.5 cm, resulting an individual voxel size of 1.5 × 1.5 × 1.5 cm3; 512 bipolar field echo pairs were collected with a repeat time of 0.84 ms and F1 and F2 bandwidths of 1000 Hz and 1190 Hz, respectively. The fully sampled data consisted of 64 t1 increments. For the prospective undersampling scheme, the 4D EP-JRESI sequence acquired 25% of the fully sampled data only according to the sampling density in equation 3. With TR/TE = 1.5 s/30 ms and 2 averages, the NUS-based EP-JRESI scan duration was approximately 12 minutes. The voxel shim and suppression were done manually, and a line width of 12–14 Hz was achieved for coronal and of 16–18 Hz for axial sections, respectively. A non-water-suppressed scan was also acquired for eddy current correction and as a reference for coil combination by fully sampling ky with only the first t1 increment, adding 30 seconds to the total scanning duration. Acquired data were postprocessed by using a custom Matlab-based program (MathWorks, Natick, Massachusetts), which applied spatial Hamming and spectral apodization filters to smooth the data. The metabolite differences between patients with OSA and healthy controls were tested with a 2-tailed t test by using the Statistical Package for the Social Sciences software, Version 20.0 (IBM, Armonk, New York). A P value < .05 was considered statistically significant.
Reconstruction
The 4D NUS EP-JRESI data were reconstructed by using the Split Bregman method for ℓ1 regularized problems.28 The detailed description of the method and the implemented algorithm can be found in Goldstein and Osher.28 The α and β parameters in equation 2 were chosen empirically and, over a reasonably broad range, did not have a significant effect on reconstruction accuracy. For all our phantom and in vivo experiments, the reconstruction parameters were the same: λ = 1, α = 1/50, and β = 1/1000.
Quantitation
For a quantitative comparison of the CS reconstructed human brain and phantom data, a modified ProFit algorithm was used to calculate metabolite in vivo and in vitro concentrations. It fits 2D spectra as linear combinations of 2D basis spectra by using a nonlinear least-squares algorithm in combination with a linear least-squares algorithm and incorporates the maximum prior knowledge available. Before fitting, frequency shifts in F1 and F2 and zero-order phase correction were applied to the extracted 2D J-resolved spectra from the 4D EP-JRESI data. The basis spectra used for fitting were simulated numerically with the General Approach to MR Mathematical Analysis Library (http://gamma.ethz.ch/),29 by using previously reported chemical shifts and coupling constants from the literature.27 For quantitation of the in vivo and phantom data, we created separate basis sets. While for phantom data analysis, the basis set contains the same metabolites as in the original phantom, for the in vivo data fitting, a set of 20 basis metabolites turned out to be the most suitable choice: Cr, NAA, phosphocholine, Cho, aspartate, γ-aminobutyrate, Glc, glutamine, glutamate, glutathione, lactate, mIns, N-acetyl aspartylglutamate, phosphoethanolamine, scyllo-Inositol, alanine, glycerylphosphocholine, ascorbate, glycine, and taurine. Metabolite concentrations were determined as ratios to the Cr peak at 3 ppm taurine, and no absolute quantification was attempted here even though they can be calculated using the reported concentrations of Cr.23
Results
Phantom
Figure 1A shows the mask used to undersample the kyt1 plane where the white points indicate the data points that were sampled. The 4D EP-JRESI dataset contains 16 × 16 voxels, with each voxel containing an individual 2D J-resolved spectrum. Figure 1B shows the spatial distribution of the 2D diagonal peaks of Cr and Cho overlaid on the T1-weighted axial MR image after fast Fourier transform of the prospectively undersampled data with 4× acceleration. The white box indicates the VOI localization achieved by PRESS with 3 section-selective radio-frequency pulses. The CS reconstruction of the same undersampled data is shown in Fig 1C. With unacquired k-space locations filled with zeroes before Fourier transformation, the effect of NUS leads to incoherent aliasing as shown in Fig 1B. Signal leakage takes place along the F1 dimension, and incoherent aliasing, along the y dimension. The reconstructed metabolite map of the 2D diagonal peaks of Cr and Cho exhibited spatial profiles similar to that of the original over the range of accelerations, showing that the CS reconstruction successfully cleans up the incoherent aliasing produced by the NUS. Due to the altered point spread function and chemical shift artifacts, there is a slight leakage in the CS constructed data because the peaks with the brightest intensity still appear within the PRESS excitation volume marked by the white box.
The reliability of the CS reconstructed 4D EP-JRESI data was investigated by using the ProFit algorithm. Table 1 shows a comparison of metabolite ratios with respect to Cr calculated by ProFit for the fully sampled, prospective 4× accelerated, and retrospective 4× accelerated datasets. The CS reconstructed spectra were of high quality, with metabolite ratios matching the fully encoded data closely. The interscan SD was small for the predominant singlets (<10%). Most other metabolites were detectable with SD values in the range of 10%–20%.
Reproducibility of the in vitro quantification of brain phantom metabolites for the following: 1) fully encoded data, CS reconstruction of 2) prospective undersampled data, and 3) retrospective NUS dataa
OSA and Healthy Brain In Vivo
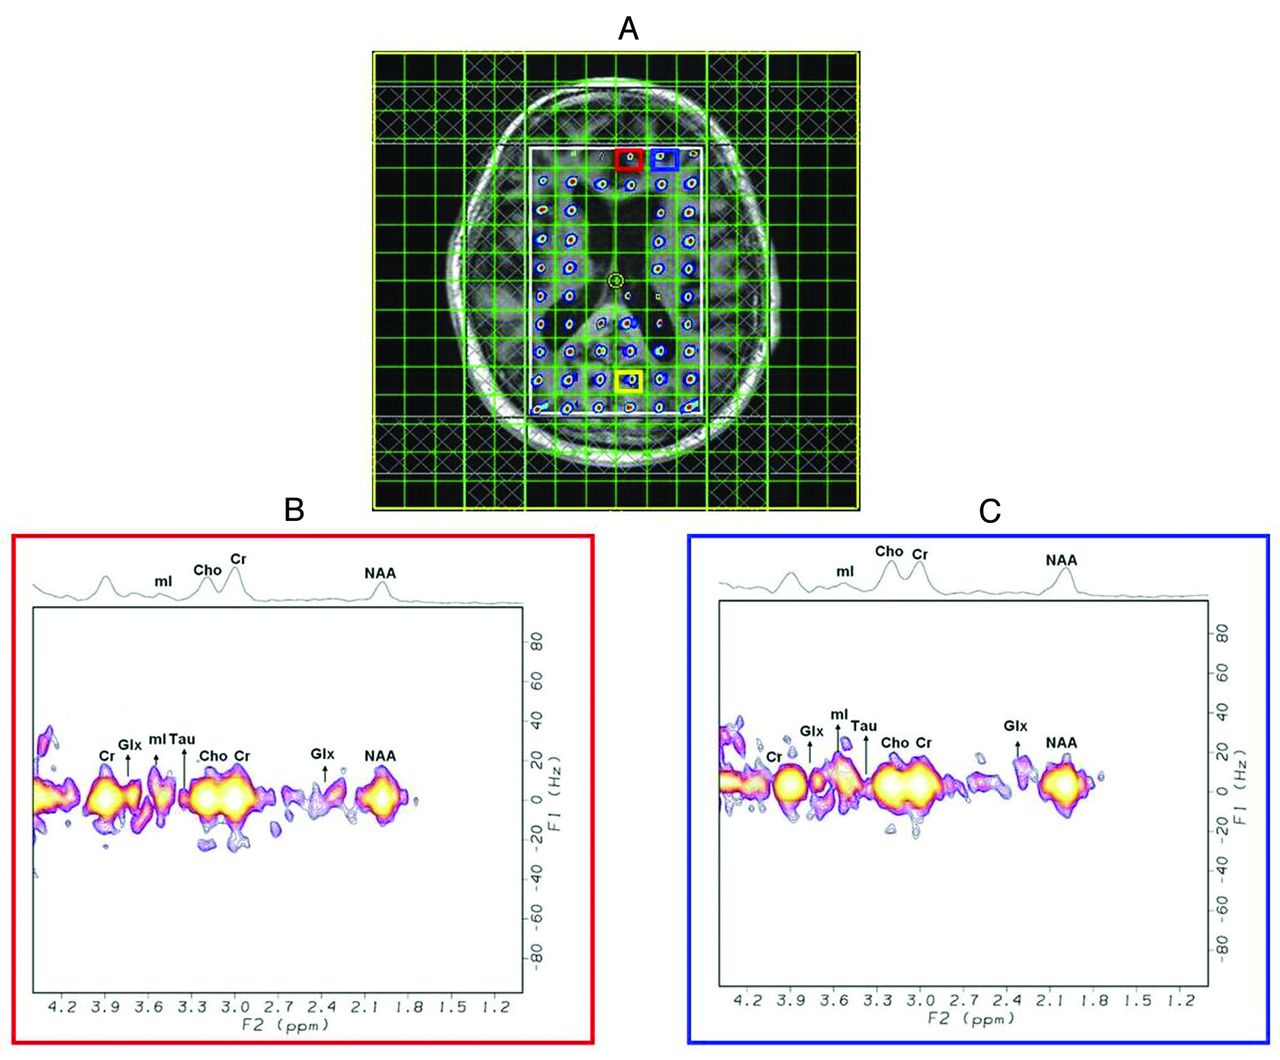
Figure 2A shows the spatial map of 2D diagonal peaks of Cr and Cho from the CS reconstruction of the prospectively undersampled data of a 39-year-old healthy brain overlaid onto a T1-weighted MR imaging localization image covering the hippocampus/thalamus regions. As observed in the phantom, the peaks were localized within the PRESS excitation volume (white box) with minimal leakage. The extracted J-resolved spectra from the right and left hippocampi are shown in Fig 2B, -C. The extracted in vivo 2D spectra showed less sensitive peaks than those recorded in the phantom scans. However, most of the metabolites of interest were detected with acceptable SNR as evidenced by the SD. Figure 3A, -B shows cerebral metabolite ratios with respect to Cr over the left and right hippocampi regions in the healthy controls and patients with OSA. Metabolites with higher physiologic concentrations, including Glx, NAA, and mIns, had acceptable coefficients of variation of <20%. In agreement with earlier 1D MR spectroscopy findings, the patients with OSA showed differences in tNAA, mIns, Cho, tCho, and Glx compared with healthy controls.2,19⇓⇓–22 We found significantly (P < .05) decreased NAA/Cr ratios in left hippocampus and decreased tCho/Cr, Glx/Cr ratios in the right hippocampus while observing a trend of decreased tCho/Cr, Glx/Cr in the left hippocampus and decreased NAA/Cr in right the hippocampus. We also observed a trend of decreased tNAA/Cr, glycerylphosphocholine/Cr, phosphocholine/Cr and increased mIns/Cr in both hippocampi regions.

A, Spatial distribution of 2D diagonal peaks of Cr and Cho from the CS reconstruction of a prospectively undersampled with 4× acceleration of the 4D EP-JRESI scan of a 39-year-old healthy control overlaid on the T1-weighted coronal MR image, with the white box indicating PRESS localization; selected 2D J-resolved spectra were extracted from the right (B) and left hippocampi (C).
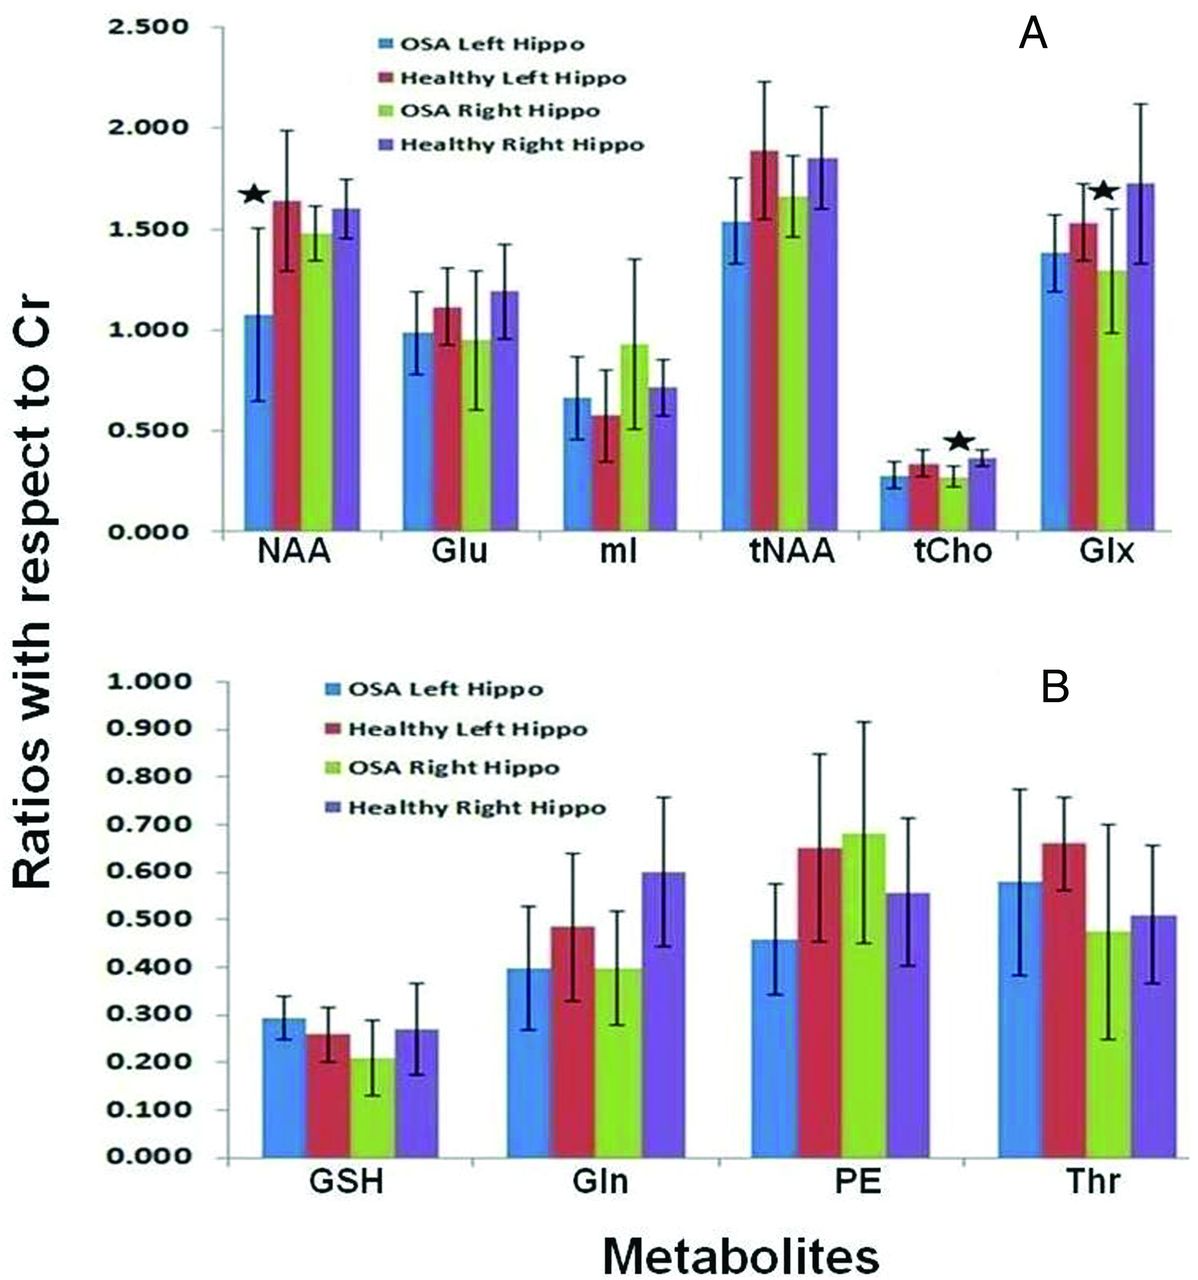
Bar graphs showing mean metabolite ratios (±SD) with respect to Cr in the left and right hippocampi of 9 patients with OSA and 11 healthy controls.
Figure 4A shows a multivoxel display, in a 69-year-old patient with OSA, of the 2D diagonal NAA peak (2.0 ppm) after the CS reconstruction of an undersampled in vivo brain scan at 4× acceleration, covering the frontal/occipital regions, with the data overlaid on the T1-weighted MR image. Two representative spectra extracted from the medial frontal gray and dorsolateral prefrontal WM regions are shown in Fig 4B, -C. The overall quality of the spectra was good, with minimal leakage, and many metabolites were visible. Table 2 shows the metabolite ratios of patients with OSA and healthy controls in the occipital gray, medial frontal gray, and left frontal white matter regions. We found significantly decreased tNAA/Cr, taurine/Cr, scyllo-Inositol/Cr, phosphocholine/Cr, and tCho/Cr in the occipital gray matter in patients with OSA compared with healthy controls. In the medial frontal gray matter location, significantly decreased tNAA/Cr and NAA/Cr were found in the patients with OSA compared with healthy controls. Significantly decreased taurine/Cr and tCho/Cr were also observed in the patients with OSA compared with healthy controls in the left frontal WM region. Figure 5 shows spectroscopic images of the quad phantom with each peak data acquired using the EP-JRESI sequence and reconstructed with CS. It can be seen that the peaks are localized nicely within each of the phantom and the PRESS localization white box. This gives another proof of the reliability of CS reconstructed 4D EP-JRESI data. Figure 6 demonstrates results from ProFit quantitation of a 4D EP-JRESI data set from the right hippocampus of a patient with OSA showing the original, fitted and residual spectra.
Reconstruction of an undersampled 4D EP-JRESI in vivo brain scan of a 69-year-old patient with OSA with only 25% of the samples as required by the Nyquist-Shannon criterion, showing multivoxel spatial distribution of diagonal NAA peaks overlaid on the T1-weighted axial MR image, with the white box indicating the PRESS localization (A) and selected 2D J-resolved spectra extracted from the midfrontal (voxel in red) (B), and left frontal WM (voxel in blue) (C). The yellow voxel depicts the occipital gray matter region used in Table 2.
Selected ProFit-quantified metabolite ratios (mean ± SD) calculated from predominantly the occipital and medial frontal gray matter regions and the prefrontal WM (left) of 9 patients with OSA and 11 healthy controls

Results from quad-phantom experiments containing 4 metabolites, NAA, Cr, Cho, lactate, submerged in a water bath. It shows the multivoxel spatial distribution of 2D diagonal peaks of NAA (bottom right), Cr (bottom left), Cho (top right), and lactate (top left) overlaid on the T1-weighted coronal MR image, with the white box indicating the PRESS localization of CS reconstructed 4D EP-JRESI data at 4× acceleration.

A ProFit-processed 4D EP-JRESI spectrum recorded from the right hippocampus of a patient with OSA. The abscissae and the ordinates represent F2 (parts per million) and F1 (Hz), respectively.
Discussion
Conventional EPSI readout facilitates inherent acceleration of one of the spatial and spectral dimensions. By imposing the NUS scheme along the incremented spectral and spatial dimensions, we have demonstrated that a further acceleration of the 4D EP-JRESI sequence is feasible for brain applications in vivo, making it clinically applicable. We first validated our acquisition approach and the CS reconstruction results by using brain phantoms, followed by a quantitative analysis by using ProFit demonstrating the feasibility of extending the algorithm to a multidimensional dataset. The CS-based EP-JRESI sequence has been implemented previously in the human prostate.14 This is the first time that this approach has been tested and implemented successfully in OSA. Compared with that of the prostate gland, human brain spectroscopic imaging is more complex structurally and sensitivity-wise. Consequently, it is more technically challenging to implement and validate the CS-EP-JRESI sequence in human brain and to evaluate the metabolite changes in OSA compared with healthy controls.
The overall quality and resolution of the reconstructed spectra were comparable to the fully sampled dataset as shown for the brain phantom retrospective and prospective studies, indicating a successful implementation of CS in reconstructing the NUS-based EP-JRESI data. A detailed discussion of the acceleration factor, SNR, and their effect on CS reconstruction was presented recently.14 For some of the J-coupled metabolites, there were a few over- and underestimations of metabolite ratios by the ProFit algorithm, which could be due to several factors: 1)A TR of 3 seconds was not enough for the magnetization of different metabolites to recover fully; 2) differential T2-weighting occurs along the incremented t1 dimension for encoding the second spectral dimension; and 3) the signal overlap is a concern even at 3T field strength. In agreement with the previous work by Schulte and Boesiger,23 a few metabolites such as aspartate, Glc, and lactate were not reliably detected in the phantom. Despite only using 25% of the original data, reconstructed datasets demonstrated the expected metabolic features characteristic of patients with OSA in comparison with healthy subjects. This study, therefore, demonstrates the feasibility of reducing scanning times in multidimensional spectroscopic imaging sequences and its applicability in both healthy and diseased human brain tissue.
This pilot study demonstrates clearly that several cerebral metabolites can be quantified by using the ProFit algorithm that have not been clearly demonstrated by 1D MR spectroscopy studies of OSA. Previous studies in patients with OSA reported abnormalities with varying results in terms of type and location,30⇓⇓–33 and mostly single voxels were studied. Our findings by using multivoxel 2D MR spectroscopy are in broad agreement with the literature and are consistent with the known phenomenon of oxidative stress in OSA.34
We observed significantly decreased tNAA/Cr ratios in the occipital gray matter and medial frontal gray matter regions and a reduced NAA/Cr ratio in the medial frontal gray matter and left hippocampus in patients with OSA compared with healthy controls. Reduced NAA/Cr is in agreement with previous MR spectroscopy studies obtained in the frontal WM of patients with OSA.21,30⇓–32 The reduced NAA/Cr ratio is indicative of neuronal dysfunction and axonal damage in those regions, presumably consequent to known repeated episodes of hypoxia in patients with OSA.30,31 Alchanatis et al32 showed lower Cho/Cr ratios in the frontal WM of patients with OSA compared with healthy volunteers. They also found significantly reduced absolute concentrations of Cho in the frontal WM of patients with sleep apnea. O'Donoghue et al2 also demonstrated decreased Cho/Cr ratios in the hippocampal area of patients with OSA. We also found a significantly decreased tCho/Cr ratio in occipital gray matter, left frontal WM, and the right hippocampus and decreased phosphocholine/Cr in the occipital gray matter of patients with OSA compared with healthy controls. Decreased Cho/Cr and tCho/Cr ratios may result from loss of myelin lipids or dysfunction of phospholipid metabolism.32
Alchanatis et al32 reported increased mIns/Cr in subjects with OSA, in agreement with our study. Additionally, our findings show significantly decreased ratios of scyllo-Inositol/Cr in occipital gray matter, taurine/Cr in the left frontal WM and occipital gray matter, and Glx/Cr in the right hippocampus in patients with OSA compared with healthy controls. The increased mIns/Cr ratio may be a reflection of membrane breakdown and reactive gliosis.21 Studies with more patients with OSA and controls are required to follow the results of decreased scyllo-Inositol/Cr, taurine/Cr, Glx/Cr ratios and increased phosphoethanolamine/Cr ratio because these have not been reported in any of the OSA single-voxel studies, to our knowledge. We also calculated the metabolite ratios in right frontal WM, left and right occipital WM, and right and left thalami and found similar trends.
Antioxidants such as glutathione and ascorbate, neurotransmitters such as γ-aminobutyrate, and glutamine are also quantifiable by using the ProFit quantitation of 2D J-resolved spectra. An increased oxidized glutathione disulfide-to-reduced glutathione ratio may be due to oxidative stress.35 Even though the reduced glutathione is observable by MR spectroscopy, it is not clear whether the oxidized glutathione concentration is sufficiently high to be detected by MR spectroscopy. γ-aminobutyrate and glutamine are the other 2 metabolites that are related to OSA. Recently, a new study showed that γ-aminobutyrate levels are reduced in adults with chronic primary insomnia, which has been linked to OSA.36 It has also been reported that increased glutamine levels stimulate the brain, hampering deep sleep. Fatty acids produced under hypoxia are primarily synthesized from glutamine carbon via the reductive pathway. In our study, we have not found any changes in γ-aminobutyrate and glutamine.
Our pilot OSA data demonstrate the initial preclinical feasibility of using the accelerated EP-JRESI and a nonlinear CS reconstruction algorithm for brain metabolic imaging. Our study has several limitations: 1) A small group of patients with OSA and healthy controls were investigated. Hence, validation by using a larger study cohort is required. 2) The study design involving the masking scheme and nonlinear reconstruction may need more optimization to further improve the overall performance. 3) The ProFit algorithm included prior-knowledge spectra of only metabolites. Hence, addition of prior-knowledge for macromolecules and lipids may improve the accuracy of quantitation.37
Conclusions
In this pilot study of CS-reconstructed 4D NUS EP-JRESI, we have shown that CS can successfully be applied to the nonuniformly undersampled EP-JRESI data in the human brain. Despite using only 25% of the original data, reconstructed datasets show the expected metabolic features in healthy controls and subjects with OSA, showing that the 4D EP-JRESI sequence may be clinically feasible. Further optimization of the sampling density and reconstruction algorithms may allow even greater reduction in the minimum amount of data required for reconstruction and may further shorten scanning times.
Acknowledgments
We acknowledge the scientific support of Brian Burns, Neil Wilson, and Jenny Li.
Footnotes
Disclosures: Paul M. Macey—RELATED: Grant: National Institutes of Health,* Support for Travel to Meetings for the Study or Other Purposes: UCLA, Comments: internal funds for travel, UNRELATED: Consultancy: colleagues in Australia (University of Western Sydney, University of Sydney), Comments: receive approximately $5000 per year for consulting on MRI analysis, Grants/Grants Pending: National Institutes of Health, Comments: multiple submissions pending and coinvestigator on some other grants, Patents (planned, pending or issued): UCLA,* Comments: patent pending, UNRELATED: Travel/Accommodations/Meeting Expenses Unrelated to Activities Listed: UCLA, Comments: internal travel funds. Michael A. Thomas—RELATED: Grant: National Institutes of Health/National Institute of Neurological Disorders and Stroke, R21 grant, Comments: 10% salary support, UNRELATED: Grants/Grants Pending: National Institutes of Health R01 entitled “Non-linear Reconstruction For Accelerated MR Spectroscopic Imaging of Sleep Apnea,” Comments: Proposal #1R01HL122553–01, submitted on June 5, 2013. *Money paid to the institution.
This research was partially supported by grants from the National Institutes of Health: 1R21NS080649-01A1 (M.A.T.) and 1R01NR013693-01A1 (P.M.M.).
Indicates open access to non-subscribers at www.ajnr.org
References
- Received September 8, 2013.
- Accepted after revision October 23, 2013.
- © 2014 by American Journal of Neuroradiology
In this issue


Jump to section
Related Articles
Cited By...
- No citing articles found.