
Abstract
BACKGROUND AND PURPOSE: The frequency of seizures is an important factor that can alter functional brain connectivity. Analysis of this factor in patients with epilepsy is complex because of disease- and medication-induced confounders. Because patients with hot-water epilepsy generally are not on long-term drug therapy, we used seed-based connectivity analysis in these patients to assess connectivity changes associated with seizure frequency without confounding from antiepileptic drugs.
MATERIALS AND METHODS: Resting-state fMRI data from 36 patients with hot-water epilepsy (18 with frequent seizures [>2 per month] and 18 with infrequent seizures [≤2 per month]) and 18 healthy age- and sex-matched controls were analyzed for seed-to-voxel connectivity by using 106 seeds. Voxel wise paired t-test analysis (P < .005, corrected for false-discovery rate) was used to identify significant intergroup differences between these groups.
RESULTS: Connectivity analysis revealed significant differences between the 2 groups (P < .001). Patients in the frequent-seizure group had increased connectivity within the medial temporal structures and widespread areas of poor connectivity, even involving the default mode network, in comparison with those in the infrequent-seizure group. Patients in the infrequent-seizure group had focal abnormalities with increased default mode network connectivity and decreased left entorhinal cortex connectivity.
CONCLUSIONS: The results of this study suggest that seizure frequency can alter functional brain connectivity, which can be visualized by using resting-state fMRI. Imaging features such as diffuse network abnormalities, involvement of the default mode network, and recruitment of medial temporal lobe structures were seen only in patients with frequent seizures. Future studies in more common epilepsy groups, however, will be required to further establish this finding.
ABBREVIATIONS:
- DMN
- default mode network
- HWE
- hot-water epilepsy
- PCC
- posterior cingulate cortex
- FDR
- false-discovery rate
Behind the unquestionable clinical and electroencephalographic manifestations of an epileptic seizure, there lie several molecular, metabolic, cellular, and hemodynamic events that alter the function of the brain in a complex manner. These alterations may be transient, but many such events can have a cumulative effect, resulting in psychological and memory deficits, personality changes, and reduced functioning in patients with epilepsy. Advances in neurophysiology, functional imaging, and computational neurosciences have made it possible to derive models mathematically to describe such complex diseases.
Disease-state network analysis with resting-state fMRI is becoming increasingly popular because of its superior spatial resolution, nondependence on task, ease of acquisition, and ability to visualize whole-brain functional networks, which are amenable to long-term changes related to disease states.1 Application of connectivity principles to these data has promoted research in various aspects of epileptic seizures, and there has been overwhelming report of decreased connectivity around the seizure-onset zone2⇓⇓⇓–6 and the default mode network (DMN) by several groups.7,8 In 2012, Jehi7 and Morgan et al9 reported that connectivity patterns were different in patients with right and left mesial temporal sclerosis and that there was decreased connectivity between the regions of the DMN and the hippocampus and amygdala in patients with mesial temporal sclerosis. Similarly, hemispheric connectivity analysis in patients with unilateral mesial temporal sclerosis revealed decreased local and intrahemispheric connectivity and increased interhemispheric connectivity.10 In contradistinction to the aforementioned results, there have been reports on increased hippocampal connectivity that was presumed to be a compensatory mechanism because it linearly correlated with a disease duration of >10 years.1⇓⇓–4,6 Graph-theory analysis of resting-state fMRI data from patients with epilepsy also revealed decreased functional nodal topologic properties of the DMN that were positively correlated with disease duration.8,11⇓⇓–14 Regional homogeneity analysis of resting-state fMRI data was even used as a presurgical tool for seizure identification in patients with MR-negative focal epilepsy.15 Thus, various models of data analysis have helped in understanding epilepsy further, and now there is increasing interest in using these models to reclassify epilepsy as a focal epileptogenic area10,15 or as a network of seizure-generating areas.16⇓–18
Gower's clinical observation that “seizures beget seizures” in 1881 triggered several studies, especially animal models that addressed the genesis of epilepsy. Kindling is a phenomenon in which the repetition of subconvulsive electrical stimuli results in a progressive epileptic state and an increased frequency of seizures.19,20 Kindling is a continuous temporal process that remodels the mechanisms and circuits in the brain. Early changes, beginning with modulation of presynaptic and postsynaptic functioning in glutamate, N-methyl-d-aspartate, and α-amino-3-hydroxy-5-methyl-4-isoxazolepropionic acid receptors, and late changes, including mossy fiber sprouting, synaptogenesis/neurogenesis, and neurotrophic factor regulation, are known to occur as a result of kindling.20⇓–22 The increased risk for seizure recurrence with increasing numbers of seizures was first demonstrated clinically by Hauser and Lee.23 The effects of seizure frequency and chronic epilepsy have been studied sparsely by using imaging techniques.1 For example, Widjaja et al24 found no significant correlation with seizure frequency, age of seizure onset, or duration of epilepsy in a group of children with medically refractory epilepsy.
Apart from other disease-related confounders such as type of seizure, duration of epilepsy, age of onset, family history of epilepsy, etc, each of which can induce connectivity differences independently, a major limitation of interpreting the results of functional connectivity in patients with epilepsy is the use of antiepileptic drugs. Patients with hot-water epilepsy (HWE) present with a history of complex partial seizures clinically suggestive of temporal lobe onset with or without secondary generalization. Most patients are drug naive at their first evaluation, which provided us an opportunity to study networks that were affected by seizure frequency and matched for other disease-related confounders but not antiepileptic drugs. On the basis of the phenomenon of kindling, we hypothesized that seizures can alter brain connectivity and that the frequency of seizures can influence the magnitude of this alteration. We predicted that patients with a higher seizure frequency would have widespread changes in comparison with patients with a lower seizure frequency. We used seed-to-voxel–based resting-state fMRI connectivity in 36 drug-naive patients with HWE who were comparable in terms of various factors such as age, sex, education, and epilepsy-related confounders. We hope that such quantifiable noninvasive in vivo evidence further enhances knowledge of the etiopathogenesis of HWE and, if applicable to refractory epilepsy, can identify such patients early to avoid time-consuming trial-and-error methods of pharmacotherapy and facilitate early intervention to minimize cognitive deficits.
Materials and Methods
This prospective study was conducted at a university hospital, a major tertiary care referral center for neurologic disorders. Written informed consent was obtained from each participant, and the study was approved by the institutional ethics committee of the National Institute of Mental Health and Neuro Sciences.
Participants.
The participants were 36 drug-naive patients with HWE (male-to-female ratio, 3:1; mean age [± standard deviation], 28.86 ± 10.07 years) who were categorized into 1 of 2 groups: 18 patients (mean age, 29.06 ± 9.61 years; mean age at first seizure, 22.61 ± 8.39 years; mean duration of epilepsy, 6.56 ± 6.48 years) with a seizure frequency of >2 per month were assigned to the frequent-seizure group, and another 18 patients (mean age, 28.67 ± 10.78 years; mean age at first seizure, 20.69 ± 10.36 years; mean duration, 7.39 ± 9.76 years) with a seizure frequency of ≤2 per month were assigned to the infrequent-seizure group. The diagnosis of reflex HWE was based on criteria of the Commission of the International League Against Epilepsy.25,26 Recruitment and evaluation were carried out under the supervision of 2 epileptologists (P.S. and S.S.). The demographic and phenotypic details were recorded. Eighteen healthy controls (male-to-female ratio, 3:1; mean age, 29.1 ± 9 years) matched in terms of age, sex, and years of education were recruited from the hospital staff. Only healthy participants who did not have any history of neurologic or psychiatric illnesses were enrolled in the study. Morphologic evaluation of brain MR imaging including the hippocampus revealed that none of the participants had any structural abnormalities. Patients with diffuse EEG abnormalities and frequent interictal epileptiform discharges were excluded from the analysis. Statistical analysis for the demographic variables using the independent-sample t test for continuous variables and the χ2 test for categoric variables revealed no significant differences between the control and patient groups other than seizure frequency.
Image Acquisition.
All the participants underwent resting-state fMRI and structural MR imaging by using a 3T Skyra MR scanner (Siemens, Erlangen, Germany) with a 20-channel head coil. Foam pads were used to reduce head motion. The acquisition parameters for EPI using blood oxygen level–dependent contrast were as follows: volumes, 185; TR, 3000 ms; TE, 30 ms; sections, 34; section thickness, 4 mm; FOV, 192 × 192 mm; resolution, 64 × 64; refocusing pulse, 90°; and voxel size, 3 × 3 × 4 mm. The total time of acquisition for resting-state fMRI was 9 minutes 24 seconds. Anatomic images were acquired by using a 3D T1-weighted MPRAGE sequence in 192 sections with a TR of 1900 ms, a TE of 2.43 ms, a TI of 900 ms, an FOV of 256 × 256, a resolution of 256 × 256, and a section thickness of 1 mm. Axial FLAIR, T2, and gradient sequences were used to rule out structural abnormalities.
Image Analysis
Preprocessing.
The functional and structural MR imaging preprocessing was performed by using statistical parametric mapping (SPM8; http://www.fil.ion.ucl.ac.uk/spm/software/spm8/). To maintain the magnetization equilibrium in the brain, the first 5 images were discarded. The data were realigned for motion correction by registration to the mean image. Each of the subjects' functional images were transformed to the Montreal Neurological Institute standard space by using the deformation field derived in the new segmentation procedure (voxel size, 3 × 3 × 3 mm) and smoothed with a Gaussian kernel of 6 mm at full width at half maximum. In addition to these steps, the structural data were segmented for gray matter, white matter, and CSF to remove the effects of head motion and WM and CSF noise reduction and for bias correction of magnetization in homogeneity.
Anatomic Parcellation.
The fMRI data were segmented into 106 anatomic ROIs on the basis of a Talairach atlas for whole brain regions (47 Brodmann areas, cerebellar tonsils, pyramis, and the posterior and anterior thalami of both the hemispheres) by using the anatomically labeled template reported by Tzourio-Mazoyer et al27 in 2002 and per several previous studies.28,29
Functional Connectivity Analysis.
A seed-to-voxel–based functional connectivity analysis was performed by computing the temporal correlation between the blood oxygen level–dependent signals to create a correlation matrix showing connectivity from the seed region to all other voxels in the brain by using the functional connectivity toolbox (CONN, version 13.L) implemented in SPM8 (http://www.nitrc.org/projects/conn; cited by Whitfield-Gabrieli and Ford, 2012)30 and was used to create individual subject seed-to-voxel connectivity maps. The preprocessed images were used for seed-based connectivity analysis. Motion correction was performed by using rigid-body transformation. We used 3 translational and 3 rotational parameters as covariates. Because the spontaneous, coherent, and low-frequency fluctuations of the blood oxygen level–dependent signal are used for resting-state fMRI analyses, the blood oxygen level–dependent time-series for each subject was extracted and bandpass filtered (0.009–0.09 Hz). Because neural activation is localized to gray matter, fluctuations in white matter and CSF regions should primarily reflect signals of nonneural origin, such as cardiac or respiratory fluctuations. Hence, WM- and CSF-related physiologic noise source reduction was carried out by using the CompCor algorithm.31,32 The seed ROIs consisted of 3-mm-radius spheres centered on Montreal Neurological Institute coordinates used to identify the corresponding networks. Bivariate analysis was performed between each pair of ROIs. The general linear modeling was designed with canonical hemodynamic response function to determine significant connections30 at the individual level (first-level analysis). The connectivity maps were estimated for correlating seed region signals with voxel signals throughout the whole brain, thereby creating seed region–to-voxel Fisher-transformed connectivity maps. Second-level random-effects analysis was used to create within-group statistical parameter maps for each network and to examine connectivity differences between groups. The group mean effects were estimated for the 3 groups.
Statistical Analysis
Voxel wise paired t-test analyses between the 1) infrequent-seizure and control groups, 2) frequent-seizure and control groups, and 3) frequent-seizure and infrequent-seizure groups were performed to detect regions with significant intergroup differences. Between-group statistical parameter maps were thresholded at a whole-brain cluster-level–corrected α value of .05 for a voxel wise P value of <.005 with false-discovery rate (FDR) correction,33 which was more stringent than the required adjusted P value of ≤.017.
Results
The demographic and phenotypic details of the patients are provided in Table 1. At the time of recruitment, each patient was drug naive and had never been prescribed antiepileptic drugs. On average, there was a gap of 10.5 ± 7.5 days between the last seizure and MR imaging (frequent-seizure group, 10.6 ± 7.5 days; infrequent-seizure group, 9.38 ± 6.9 days). These differences between the groups were not statistically significant (P = .753). Only 2 patients in the infrequent-seizure group revealed focal EEG abnormalities as spike-and-wave epileptiform discharges over the right temporo-occipital region. A family history of seizures was present in 6 patients in the frequent-seizure group and 5 patients in the infrequent-seizure group. Most were complex partial seizures or secondarily generalized tonic-clonic seizures (Table 1). Among all the demographic variables, only the frequency of seizures was statistically significant when the independent-sample t test was used (P < .001). The seed-to-voxel–based connectivity analysis revealed that patients in the frequent-seizure group had a widespread decrease in connectivity, predominantly involving the parietal lobes and the DMN, whereas those in the infrequent-seizure group had only a focal decrease in entorhinal connectivity. It is interesting to note that patients in the frequent-seizure group had increased visual cortex, entorhinal, and perirhinal connections, whereas those in the infrequent-seizure group had increased DMN connectivity compared to the healthy controls. The details of the various subgroup analyses are given below.
Demographic and clinical features of 2 groups (with frequent or infrequent seizures) of patients with HWE
Frequent-Seizure Group versus Healthy Controls
In the analysis of healthy controls versus the frequent-seizure group, it was found that patients had significantly decreased connections of the posterior cingulate cortex (PCC) with the angular gyrus, temporopolar region, and medial prefrontal cortex (P < .001). Various seeds in the left parietal lobe also showed significantly (FDR-corrected P < .001) decreased connections with bilateral motor cortices, the dorsal frontal cortex, superior temporal lobes, and cerebellar tonsils. The right dorsal frontal cortex had significantly (FDR-corrected P < .005) decreased connections with the bilateral superior temporal gyrus. It was interesting to note that patients in the frequent-seizure group also had significantly (P < .005) increased connections of primary and secondary visual cortices to the precuneus. The mean images of the connectivity analyses of the most significant ROIs are presented in the composite Fig 1, and the areas are detailed in Table 2.
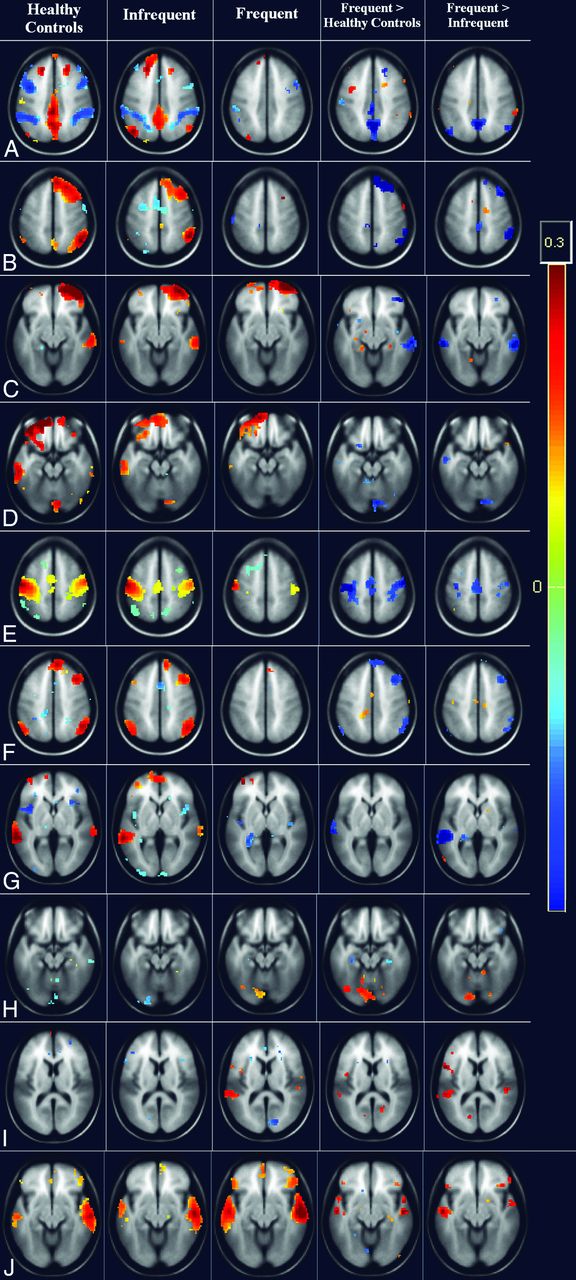
Whole-brain cluster-correlation maps of seed-to-voxel–based resting-state functional connectivity (FDR-corrected P < .001) with seed regions in the medial prefrontal cortex (A and B), right anterior prefrontal cortex (C), left anterior prefrontal cortex (D), left primary somatosensory cortex (E), right middle temporal gyrus (F), left angular gyrus (G), left precuneus (H), left posterior entorhinal cortex (I), and right medial temporal gyrus (J). The columns represents the healthy controls (column 1), the infrequent-seizure group (column 2), the frequent-seizure group (column 3), the frequent-seizure group versus healthy controls (column 4), and the frequent-seizure group versus the infrequent-seizure group (column 5). The colors represent the significance of connectivity; red indicates an increase in connectivity, and blue indicates a decrease in connectivity.
Seed-to-voxel–based connectivity results in the frequent-seizure and healthy control groups
Infrequent-Seizure Group versus Healthy Controls
The patients in the infrequent-seizure group were similar to the healthy controls in most of the connections. Only the left posterior entorhinal cortex showed a significant (FDR-corrected P < .005) decrease in connectivity with the left fusiform gyrus. Patients in the infrequent-seizure group had increased connections of the DMN with the PCC and of the anterior prefrontal cortex. There was also increased connectivity of the anterior cingulate cortex with the superior temporal region. It should be noted that patients with infrequent seizures had no areas with decreased connections to the DMN. The mean image-of-connectivity analysis of these ROIs is presented in the composite Fig 1, and the most significant areas are listed in Table 3.
Seed-to-voxel–based connectivity results in the infrequent-seizure and healthy control groups
Frequent- versus Infrequent-Seizure Group
The patients in the frequent-seizure group were significantly (FDR-corrected P < .001) different from those in the infrequent-seizure group in their left parietal and PCC connections. The most significant (FDR-corrected P < .001) among these areas were the connections of the left angular gyrus, precuneus, and left parietal lobes with the PCC and medial prefrontal cortex. The left somatosensory cortex, bilateral premotor cortex, and left lower parietal lobe also showed significant (FDR-corrected P < .005) decreased connections. The bilateral prefrontal cortex, right superior frontal gyrus, and dorsal frontal cortex also revealed significant (FDR-corrected P < .005) decreased connections with the superior and middle temporal gyrus. The anterior cingulate showed significant decreased connections with the left piriform cortex. The patients with frequent seizures had a significant (FDR-corrected P < .005) increase in connections within the temporal lobes bilaterally involving the seizure-prone entorhinal, perirhinal with primary auditory cortex bilaterally. The mean image-of-connectivity analysis of these ROIs is presented in the composite Fig 1, and the most significant areas are listed in Table 4.
Seed-to-voxel–based connectivity results in the frequent- and infrequent-seizure groups
DMN Connectivity
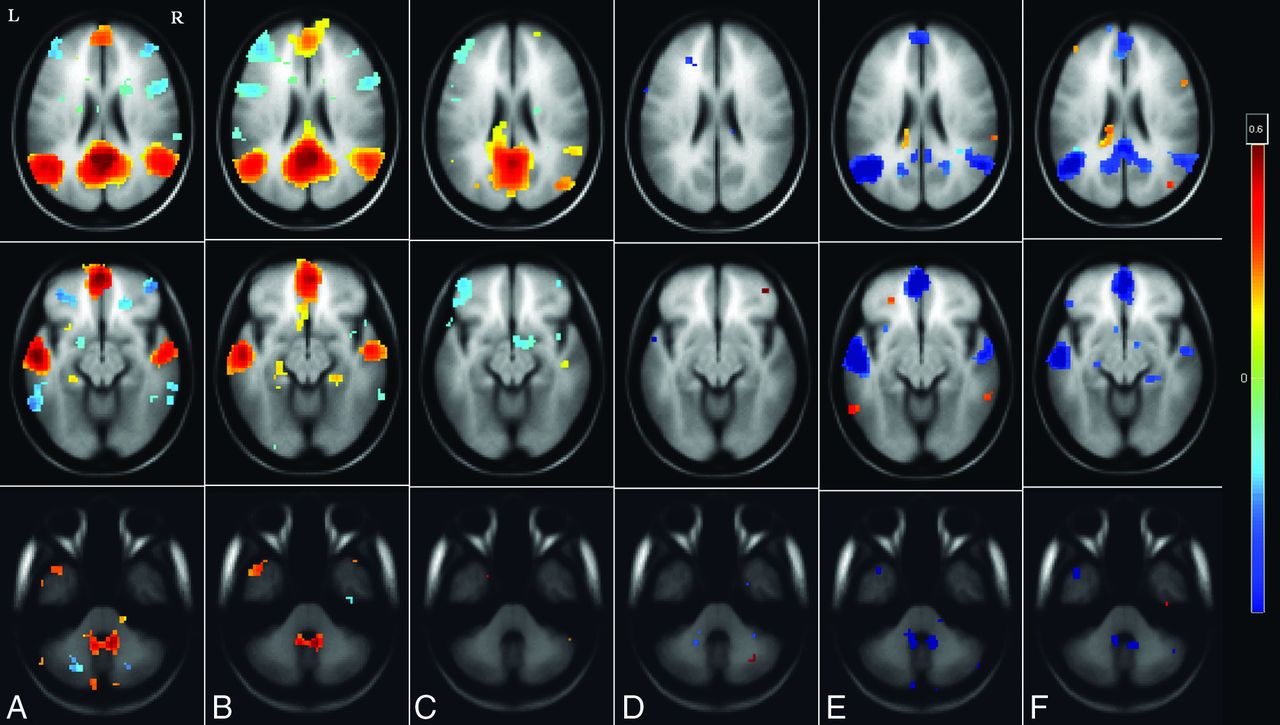
To assess the functional connectivity differences encompassing the DMN, seed-based connectivity analysis of the PCC (FDR-corrected P < .001) was performed for each of the 3 groups. Patients in the infrequent-seizure group revealed increased DMN connectivity with increased connections between the anterior prefrontal lobe, PCC, anterior cingulate cortex, and medial temporal lobe in comparison with those in the healthy controls. Patients in the frequent-seizure group had poor connections of the PCC seed with no connectivity to the anterior cingulate, medial frontal, bilateral parietal, or temporal lobes. These differences are highlighted in Fig 2.

Whole-brain cluster-correlation maps of seed-to-voxel–based resting-state functional connectivity for the PCC seed region (FDR-corrected P < .001). Shown is DMN connectivity using PCC seed at 3 different axial levels: at the level of ventricles in the top row, midbrain in the middle row, and the cerebellum in the bottom row for healthy controls (A), the infrequent-seizure group (B), the frequent-seizure group (C), the infrequent-seizure group versus healthy controls (D), the frequent-seizure group versus healthy controls (E), and the infrequent-seizure group versus the frequent-seizure group (F). The colors represent the significance of connectivity; red indicates an increase in connectivity, and blue indicates a decrease in connectivity.
Discussion
The exact etiopathogenesis of hot-water epilepsy is not clear, but several factors, including genetic factors, environmental factors, consanguineous marriage, and a habit of taking baths in water at a high temperature, have been postulated as probable reasons.34 We conducted a study to evaluate the functional connectivity in 2 groups of patients with HWE. Initially, we performed a seed-based analysis to understand connectivity patterns in 106 brain seeds of the Talairach coordinates with all the voxels in the brain to determine which of the seeds are significantly involved in patients with HWE and also to decipher how they differ between patients in the frequent-seizure group and those in the infrequent-seizure group. In patients with frequent seizures, we noted highly significantly reduced connectivity within several temporal and frontoparietal regions and increased temporal region connections. In patients with infrequent seizures, the disruptions were much less widespread and involved predominantly the temporal regions. Subsequent analysis of the DMN showed a grossly reduced connectivity of the DMN in the frequent-seizure group compared with increased connections in the infrequent-seizure group.
The connectivity differences could mean inherent differences between the groups. These differences could suggest disease focus, or could be indicators of disease progression and associated compensatory mechanisms. We found that there were several areas of decreased connectivity with associated decreased connectivity of the DMN, as found by many other researchers7–8,14,35,36 and as has been observed in children with refractory epilepsy,24 which is known to correlate with disease duration.6,14 Decreased connectivity was limited to the temporal lobes in patients with infrequent seizures and was widespread and involved the frontal, parietal, and temporal lobes, thalamus, and cerebellum in patients with frequent seizures. Because evidence of decreased connectivity has also been associated with several neuropsychiatric diseases such as dementia, stroke, traumatic brain injury, depression, and schizophrenia, it is possible that decreased connectivity might be indicative of the cognitive and social deficits associated with the disease together with the disease burden. We found that patients in the frequent-seizure group had increased connections within the temporal lobes bilaterally involving the seizure-prone medial temporal structure and bilateral primary auditory cortex, and those in the infrequent-seizure group had increased connections of the DMN. Observations of increased connectivity with other types of epilepsy, such as in the medial temporal lobes with mesial temporal sclerosis,8,10 the lateral orbitofrontal lobes with absence seizures,37 and frontal lobes with idiopathic generalized epilepsy,38,39 make us surmise that increased connections are probably more specific to understand epileptogenesis. Previous studies also pointed to a temporal lobe origin in 67%–100% of patients with HWE.40⇓–42 Interictal EEG results are usually normal in most of the cases, but a few case studies showed localized temporal lobe discharges.41,43 Isolated case reports of associated hippocampal sclerosis have also been reported. In a recent study that involved 5 patients with HWE, 2 of 3 patients who underwent ictal SPECT had hyperperfusion in the temporal region,44 and an fMRI-EEG study in 1 patient revealed frontoparietal occipital abnormalities.45 Studies in rat models have found widespread kindling and hippocampal mossy fiber sprouting in hot-water–induced hyperthermic seizures at temperature ranges known to precipitate HWE in humans.46 Thus, the evidence of increased connectivity of the temporal lobe in patients in the frequent-seizure group in this study supports the temporal lobe focus of HWE seen in the literature, and the absence of it in the infrequent-seizure group could indicate that this phenomenon is probably associated with disease progression. There have been few reports of increased DMN connectivity in patients with epilepsy.6,14 Our findings of differential DMN connectivity, which was increased in the infrequent-seizure group and decreased in the frequent-seizure group, directly supports the reports by Bettus et al2 and Greicius et al47 of increasing DMN connectivity as a compensatory mechanism. Hence, we presume that increasing DMN connectivity is a protective response and might indicate good seizure control in patients with epilepsy.
In this study, an attempt was made to overcome the widely accepted limitation of antiepileptic drugs on network connectivity, and it needs to be noted that the potential effect of interictal discharges on the network was not assessed because we did not record simultaneous EEG with fMRI. However, because only 2 patients in the infrequent-seizure group had 1–2 focal spike-and-wave discharges in routine EEG, it might be of lesser significance in our study. Per the design of the study, we performed seed-based connectivity analysis in only certain regions of the brain. It is possible that there are many more areas that have been excluded because of the threshold and ranges applied. There was no attempt to overcome the limitations of parcellation algorithms, thresholding effects, or confounders caused by physiologic motion correction on resting-state fMRI. It is also possible that placing these patients into multiple lower- or higher-frequency groups rather than into 2 dichotomized groups might have revealed varying frequency-specific connectivity patterns. Additional studies should address these factors to detect early and potentially reversible connectivity abnormalities.
Conclusions
This network analysis of 36 patients with hot-water epilepsy revealed that repeated seizures affect brain connectivity and that patients with frequent seizures have widespread connectivity changes, involvement of the DMN, and recruitment of several seizure-prone areas in the medial temporal lobes bilaterally. Whether in the future one could predict the course of chronic epilepsy on the basis of these findings requires further studies on groups of patients with more common epilepsy types.
Acknowledgments
We acknowledge the support of the Department of Science and Technology, Government of India, for providing the 3T MR imaging scanner exclusively for research in the field of neurosciences. We acknowledge that the data analysis was greatly benefited by our interactions with Bharat Biswal and his team at the New Jersey Institute of Technology. We thank all the patients who participated in this study without expecting anything in return. We are grateful to the staff, especially the radiographers (at the Neuroimaging and Interventional Radiology, National Institute of Mental Health and Neuro Sciences, India) for their odd-hour support during data collection.
REFERENCES
- Received September 16, 2014.
- Accepted after revision February 25, 2015.
- © 2015 by American Journal of Neuroradiology


Jump to section
Related Articles
Cited By...
- Improved Seizure Onset-Zone Lateralization in Temporal Lobe Epilepsy using 7T Resting-State fMRI: A Direct Comparison with 3T
- Atypical intrinsic neural timescales in temporal lobe epilepsy
- Functional Network Connectivity Imprint In Febrile Seizures
- Thalamic deep brain stimulation as a paradigm to reduce consciousness: implications for cortico-striatal dynamics, absence epilepsy and consciousness studies