
Abstract
BACKGROUND AND PURPOSE: Recently 4-hour delayed-enhanced 3D-FLAIR MR imaging has been used in pathophysiologic analysis of the inner ear in many auditory diseases, including sudden sensorineural hearing loss, but comparison among different time points is not clear in patients with unilateral inner ear symptoms. We compared the signal-intensity ratios of the inner ears in patients with unilateral inner ear symptoms on 10-minute delayed-enhanced and 4-hour delayed-enhanced 3D-FLAIR MR images after IV gadolinium injection.
MATERIALS AND METHODS: The 10-minute delayed-enhanced and 4-hour delayed-enhanced 3D-FLAIR MR images were retrospectively analyzed. Signal-intensity ratios between the cerebellum and inner ear structures, such as the cochleae, vestibules, and vestibulocochlear nerve were assessed. Multiple comparisons were performed.
RESULTS: Signal-intensity ratios of the affected cochleae, vestibules, and vestibulocochlear nerve were higher than those of unaffected sides in both 10-minute delayed-enhanced and 4-hour delayed-enhanced images. At the affected side, signal-intensity ratios of the vestibulocochlear nerve were higher in patients with nonsudden sensorineural hearing loss than in those with sudden sensorineural hearing loss on both 10-minute delayed-enhanced and 4-hour delayed-enhanced images. The signal-intensity ratios of some affected inner ear structures were higher than those of the unaffected sides in a group of 30 patients with sudden sensorineural hearing loss and 20 patients with nonsudden sensorineural hearing loss on 10-minute delayed-enhanced and 4-hour delayed-enhanced images.
CONCLUSIONS: Signal-intensity ratios of the inner ear show statistically significant increases in many diseases, especially neuritis, in 10-minute delayed-enhanced and 4-hour delayed-enhanced images. The 4-hour delayed-enhanced images may be superior in neural inflammatory–dominant conditions, while 10-minute delayed-enhanced images may be superior in neural noninflammatory–dominant conditions.
ABBREVIATIONS:
- sSNHL
- sudden sensorineural hearing loss
- nsSNHL
- nonsudden sensorineural hearing loss
3D fluid-attenuated inversion recovery MR imaging has recently been applied to the inner ear to investigate inner ear pathology. The increased signal intensity of diseased inner ears can also be observed on 3D-FLAIR imaging after intravenous gadolinium injection. This technique is useful for the pathophysiologic analysis of the inner ear in many auditory diseases, such as sudden sensorineural hearing loss (sSNHL), cholesteatoma, cochlear otosclerosis, and vestibular schwannoma.1⇓⇓–4 Compared with intratympanic gadolinium injection, 3D-FLAIR MR imaging after IV gadolinium injection is less invasive and enables observation of the bilateral cochleae and other inner ear structures.5
The signal-intensity ratio of the inner ear to other parts of the brain allows semiquantitative expression of the signal intensity and may be useful for comparing results among patients or among ears. Recent articles have reported that the signal-intensity ratio of the inner ear and other parts of the brain is useful in patients with sudden deafness, Ménière disease, and vestibular schwannoma.4,6⇓–8
The signal-intensity ratio of the inner ear and brain stem may indicate disruption of the blood-labyrinthine barrier in patients with inner ear disease with 4-hour enhancement after gadolinium injection.7 To our knowledge, the difference in inner ear signal intensity between 10-minute and 4-hour delayed MRI has not been evaluated in most patients with unilateral symptoms, however, including those with sSNHL.
The purpose of this study was to compare signal intensities of the inner ear among patients with unilateral symptomatic ear diseases. Comparisons were made between the affected and unaffected sides, between patients with sSNHL and nonsudden sensorineural hearing loss (nsSNHL), and between 10-minute and 4-hour delayed intravenous gadolinium-enhanced 3D-FLAIR MR imaging.
Materials and Methods
Patients
From May 2012 to October 2013, 60 patients who presented with inner ear symptoms and underwent contrast-enhanced 3T temporal MRI were enrolled in our study. The MR imaging data and the electronic medical records of the 60 patients (120 ears) were then retrospectively analyzed. Our institutional review board approved this study, and informed consent was waived due to the retrospective nature of the study.
Ten patients were excluded from the study because they did not have lateralized symptoms, including 4 patients with nonspecific dizziness, 3 patients with benign paroxysmal positional vertigo, and 3 patients with other bilateral symptoms.
The study therefore included 50 subjects with lateralizing inner ear symptoms, including hearing loss, tinnitus, ear fullness, nystagmus, and vertigo. Patients underwent 3D-FLAIR MR imaging with 10-minute and 4-hour delayed intravenous gadolinium enhancement (Fig 1).
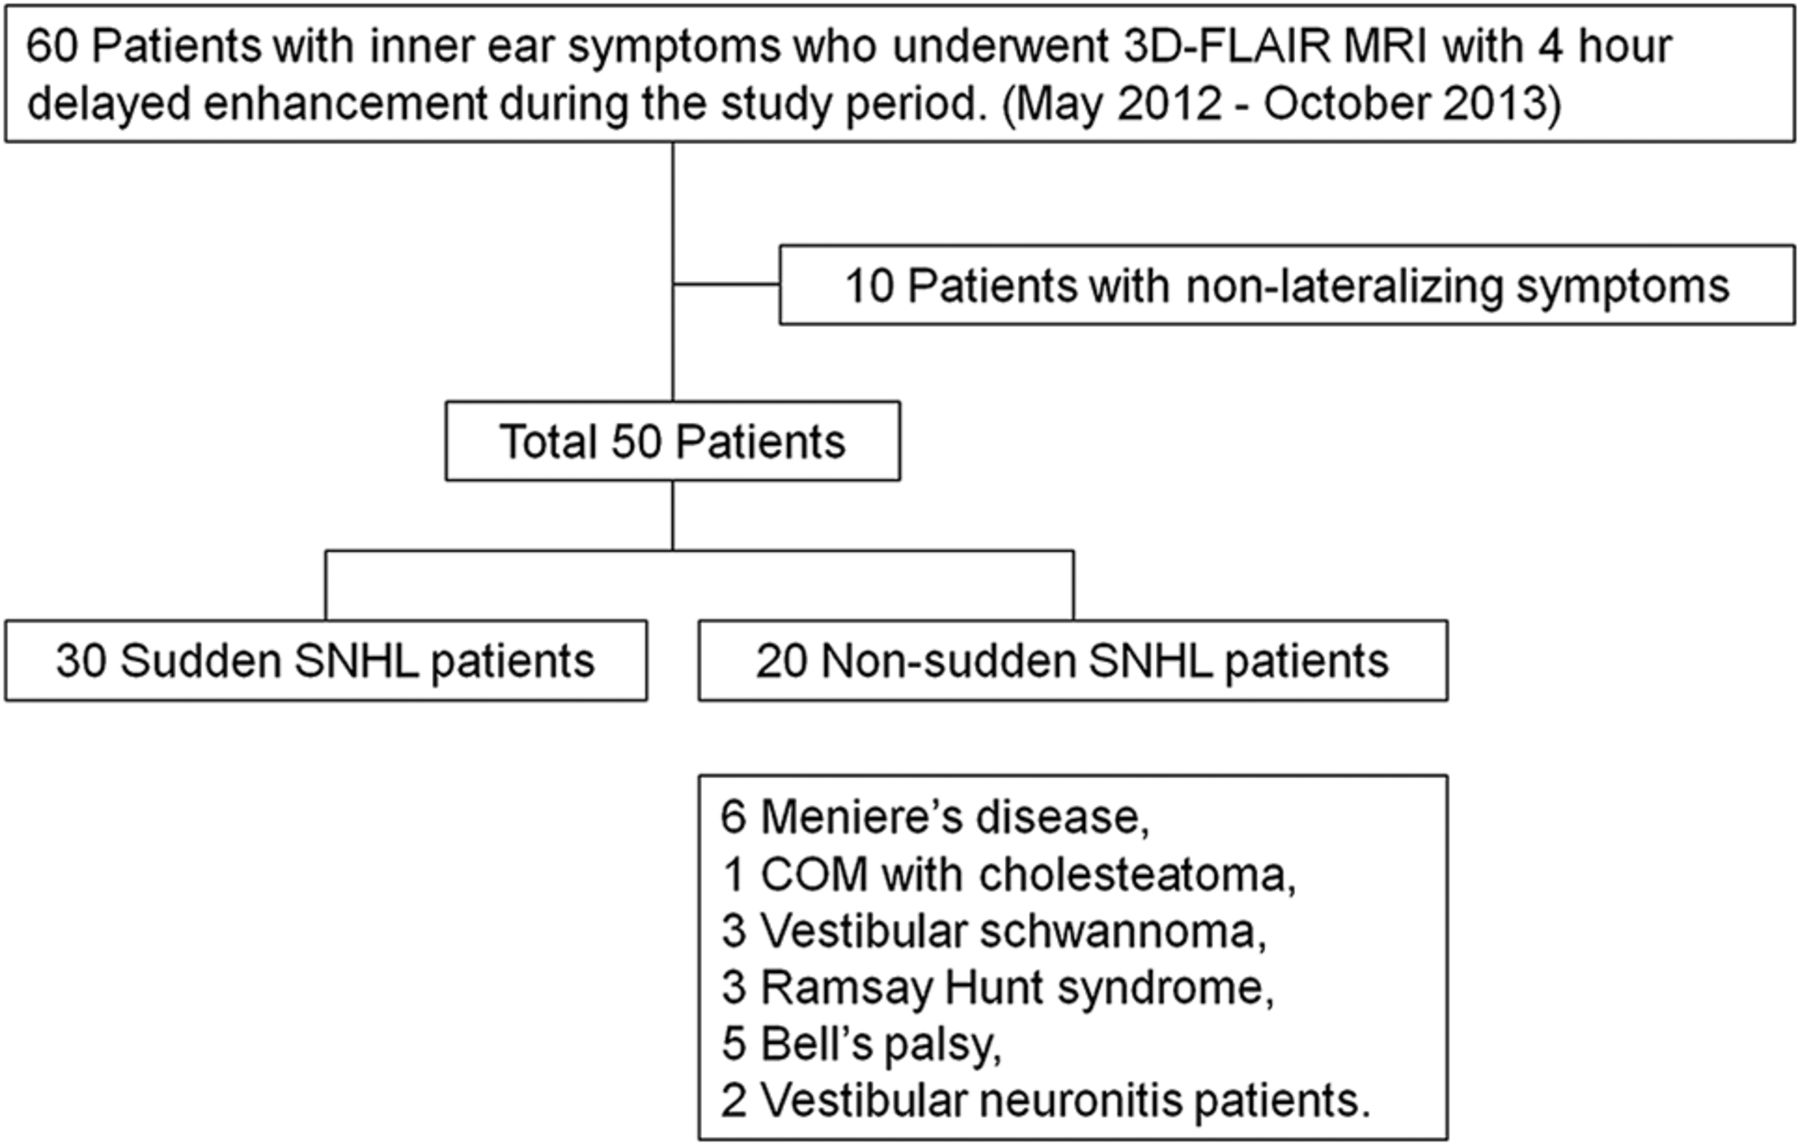
Flowchart shows inclusion and exclusion criteria applied for the collection and composition of the study group. COM indicates chronic otitis media.
The patient group consisted of 17 men and 33 women, with ages ranging from 8 years to 72 years (mean age, 45.6 years). There were 22 right symptomatic ears and 28 left symptomatic ears (Table 1).
Patient characteristics
sSNHL is defined as a >30-dB hearing loss occurring in at least 3 contiguous frequencies in <72 hours without obvious cause.
The patient population consisted of 30 patients with sSNHL and 20 with nsSNHL. Patients with nsSNHL included the following: 6 (12% of 50 total patients) with Ménière disease, 1 (2%) with chronic otitis media with cholesteatoma, 3 (6%) with vestibular schwannoma, 3 (6%) with Ramsay Hunt syndrome, 5 (10%) with Bell palsy, and 2 (4%) with vestibular neuronitis. The patients clinically diagnosed with Bell palsy or Ramsay Hunt syndrome were included because they had combined hearing loss.
MR Imaging Protocol
All scans were obtained on a 3T MR imaging scanner (Achieva 3T; Philips Healthcare, Best, the Netherlands) by using a receive-only 32-channel phased array coil. Double-dose (0.2-mmol/kg) gadolinium-DTPA (Bono-I; CMS, Korea) was used to evaluate the pathophysiology analysis of the inner ear.
The images obtained included the following: pre- and postenhanced T1WI; 3D thin-section proton attenuation images (0.3- to 0.6-mm thickness); whole-brain FLAIR images; and pre-, 10-minute, and 4-hour delayed-enhanced FLAIR volume isotropic turbo spin-echo acquisition images.
The parameters for 3D-FLAIR are summarized in Table 2.
The parameters for 3D-FLAIR MRI
MR Imaging Evaluation and Statistical Analysis
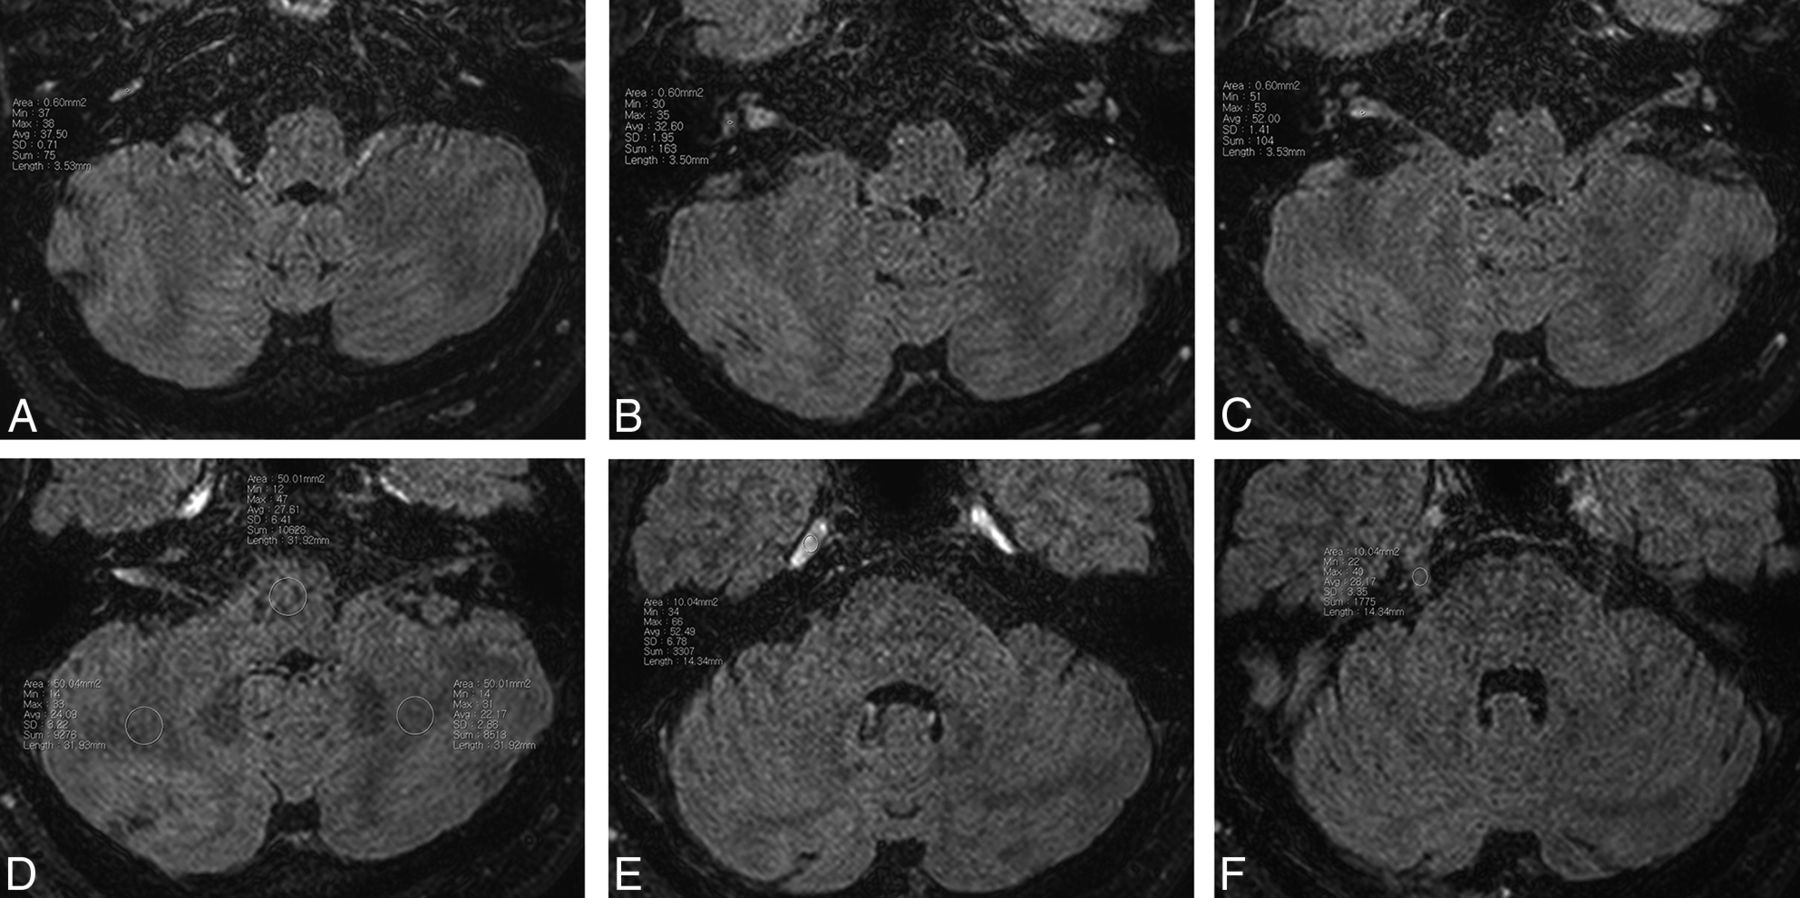
Circular 0.6-mm2 ROIs were determined within the basal turn of the cochlea, vestibule, cochlear and vestibular nerves in the labyrinth, and the cisternal segment of the trigeminal nerve. ROIs were examined with 10-minute and 4-hour delayed 3D FLAIR MR imaging after an IV gadolinium injection. Circular 10-mm2 ROIs of the Meckel cave were also measured (Fig 2). Circular 50-mm2 ROIs of the medulla oblongata and cerebellar white matter were obtained at the level of the internal acoustic meatus. Inner ear signal-intensity ratios were then bilaterally estimated as follows: cochlea/medulla, vestibule/medulla, vestibulocochlear nerve/medulla, cisternal segment of trigeminal nerve/medulla, and the Meckel cave of the trigeminal nerve/medulla.

Example of the ROIs on 4-hour delayed contrast-enhanced 3D-FLAIR images: cochlear (A), vestibule (B), vestibulocochlear nerve (C), medulla and cerebellar white matter (D), the Meckel cave of the trigeminal nerve (E), and the cisternal segment of the trigeminal nerve (F).
Two radiologists who were blinded to patient information measured the ROIs. Every ROI was examined twice for each patient on different days to ensure the reliability of the signal intensity and diminish measurement error. The signal intensities of the 4 measurements were averaged for analysis. Differences between radiologists were then resolved by consensus.
Circular 50-mm2 ROIs for the cerebellar white matter of both cerebellar hemispheres at identical sections of the medulla oblongata were obtained on each image. The signal-intensity ratio of the cerebellar white matter to the medulla oblongata was calculated for each image. Cerebellar white matter/medulla ratios were then bilaterally estimated to evaluate the uniformity of the magnetic field.
The Student t test was used to compare the differences in each inner ear signal-intensity ratio, both between 10 minutes and 4 hours and between affected and unaffected sides. A paired t test and Wilcoxon signed rank test were used to compare the differences in the affected ear signal-intensity ratio between patients with unilateral sSNHL and those with nsSNHL and to compare the WM ratio between the right and left sides. Pearson correlation analysis was used to compare the Meckel cave of the trigeminal nerve/medulla and the unaffected inner ear signal-intensity ratios.
Motion artifacts, visible signal abnormalities of the medulla, and mastoid air cells were visually assessed simultaneously.
Results
There were no visible motion artifacts, visible signal abnormalities of the medulla, or abnormalities of the mastoid air cells. The WM ratio between the right and left sides did not differ significantly for either method. The mean age and sex ratio did not differ significantly between patients with sSNHL and those with nsSNHL (P = .84 for mean age, P = .06 for sex ratio).
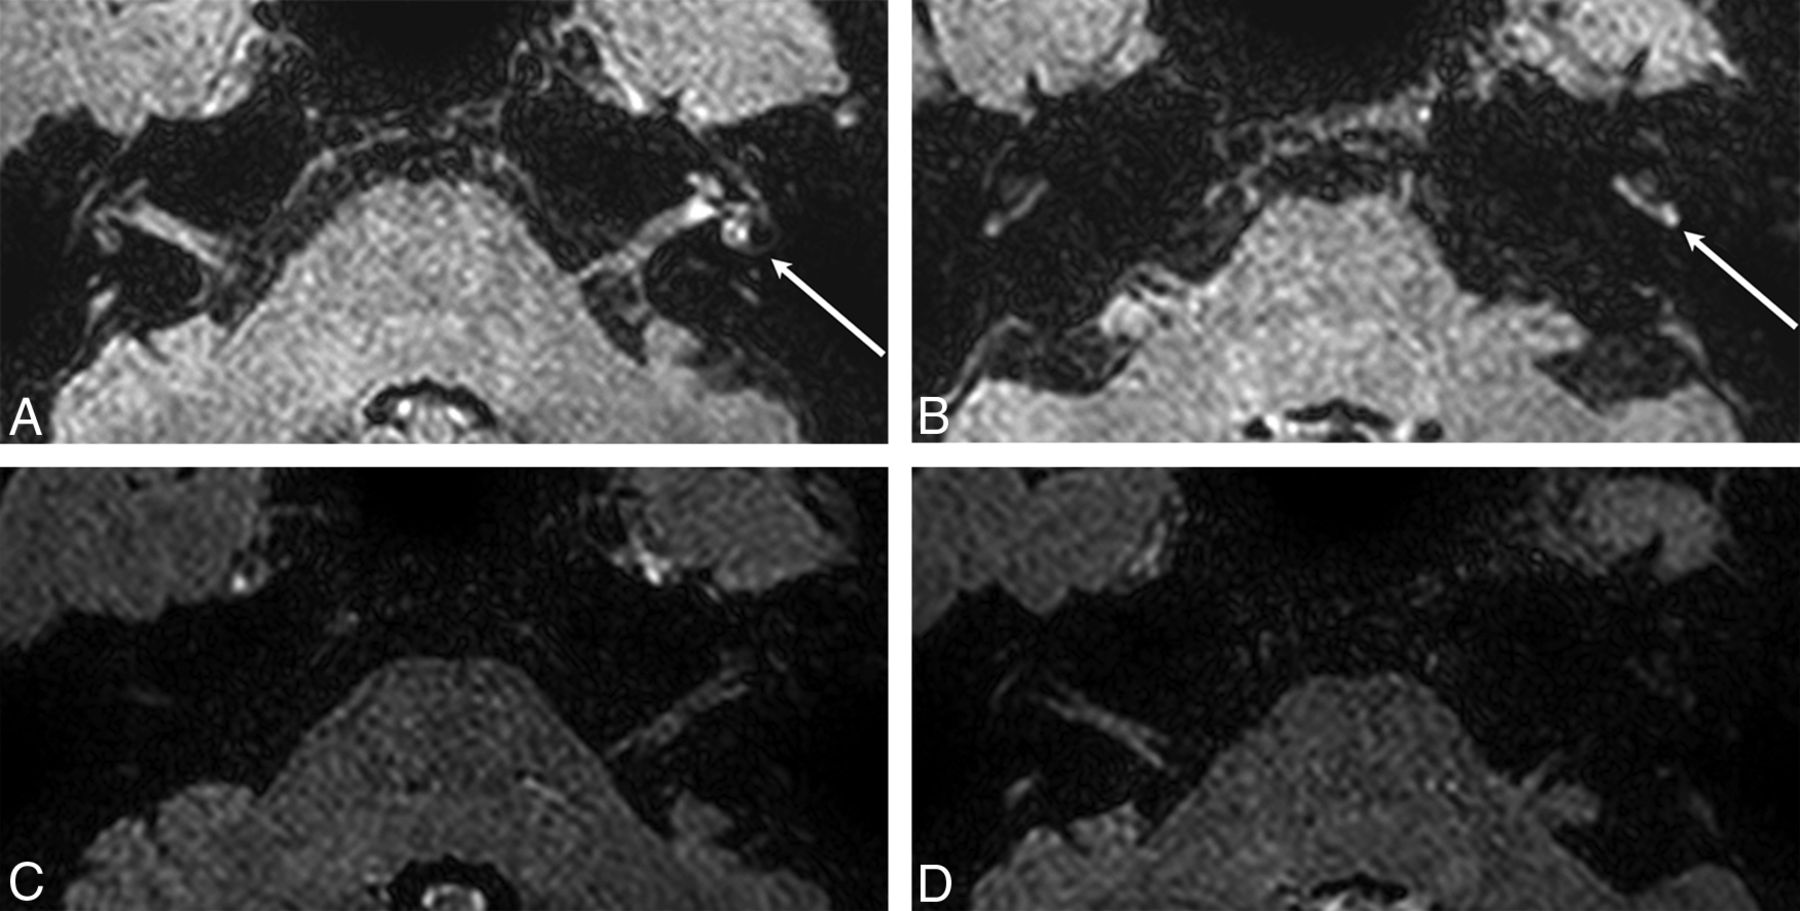
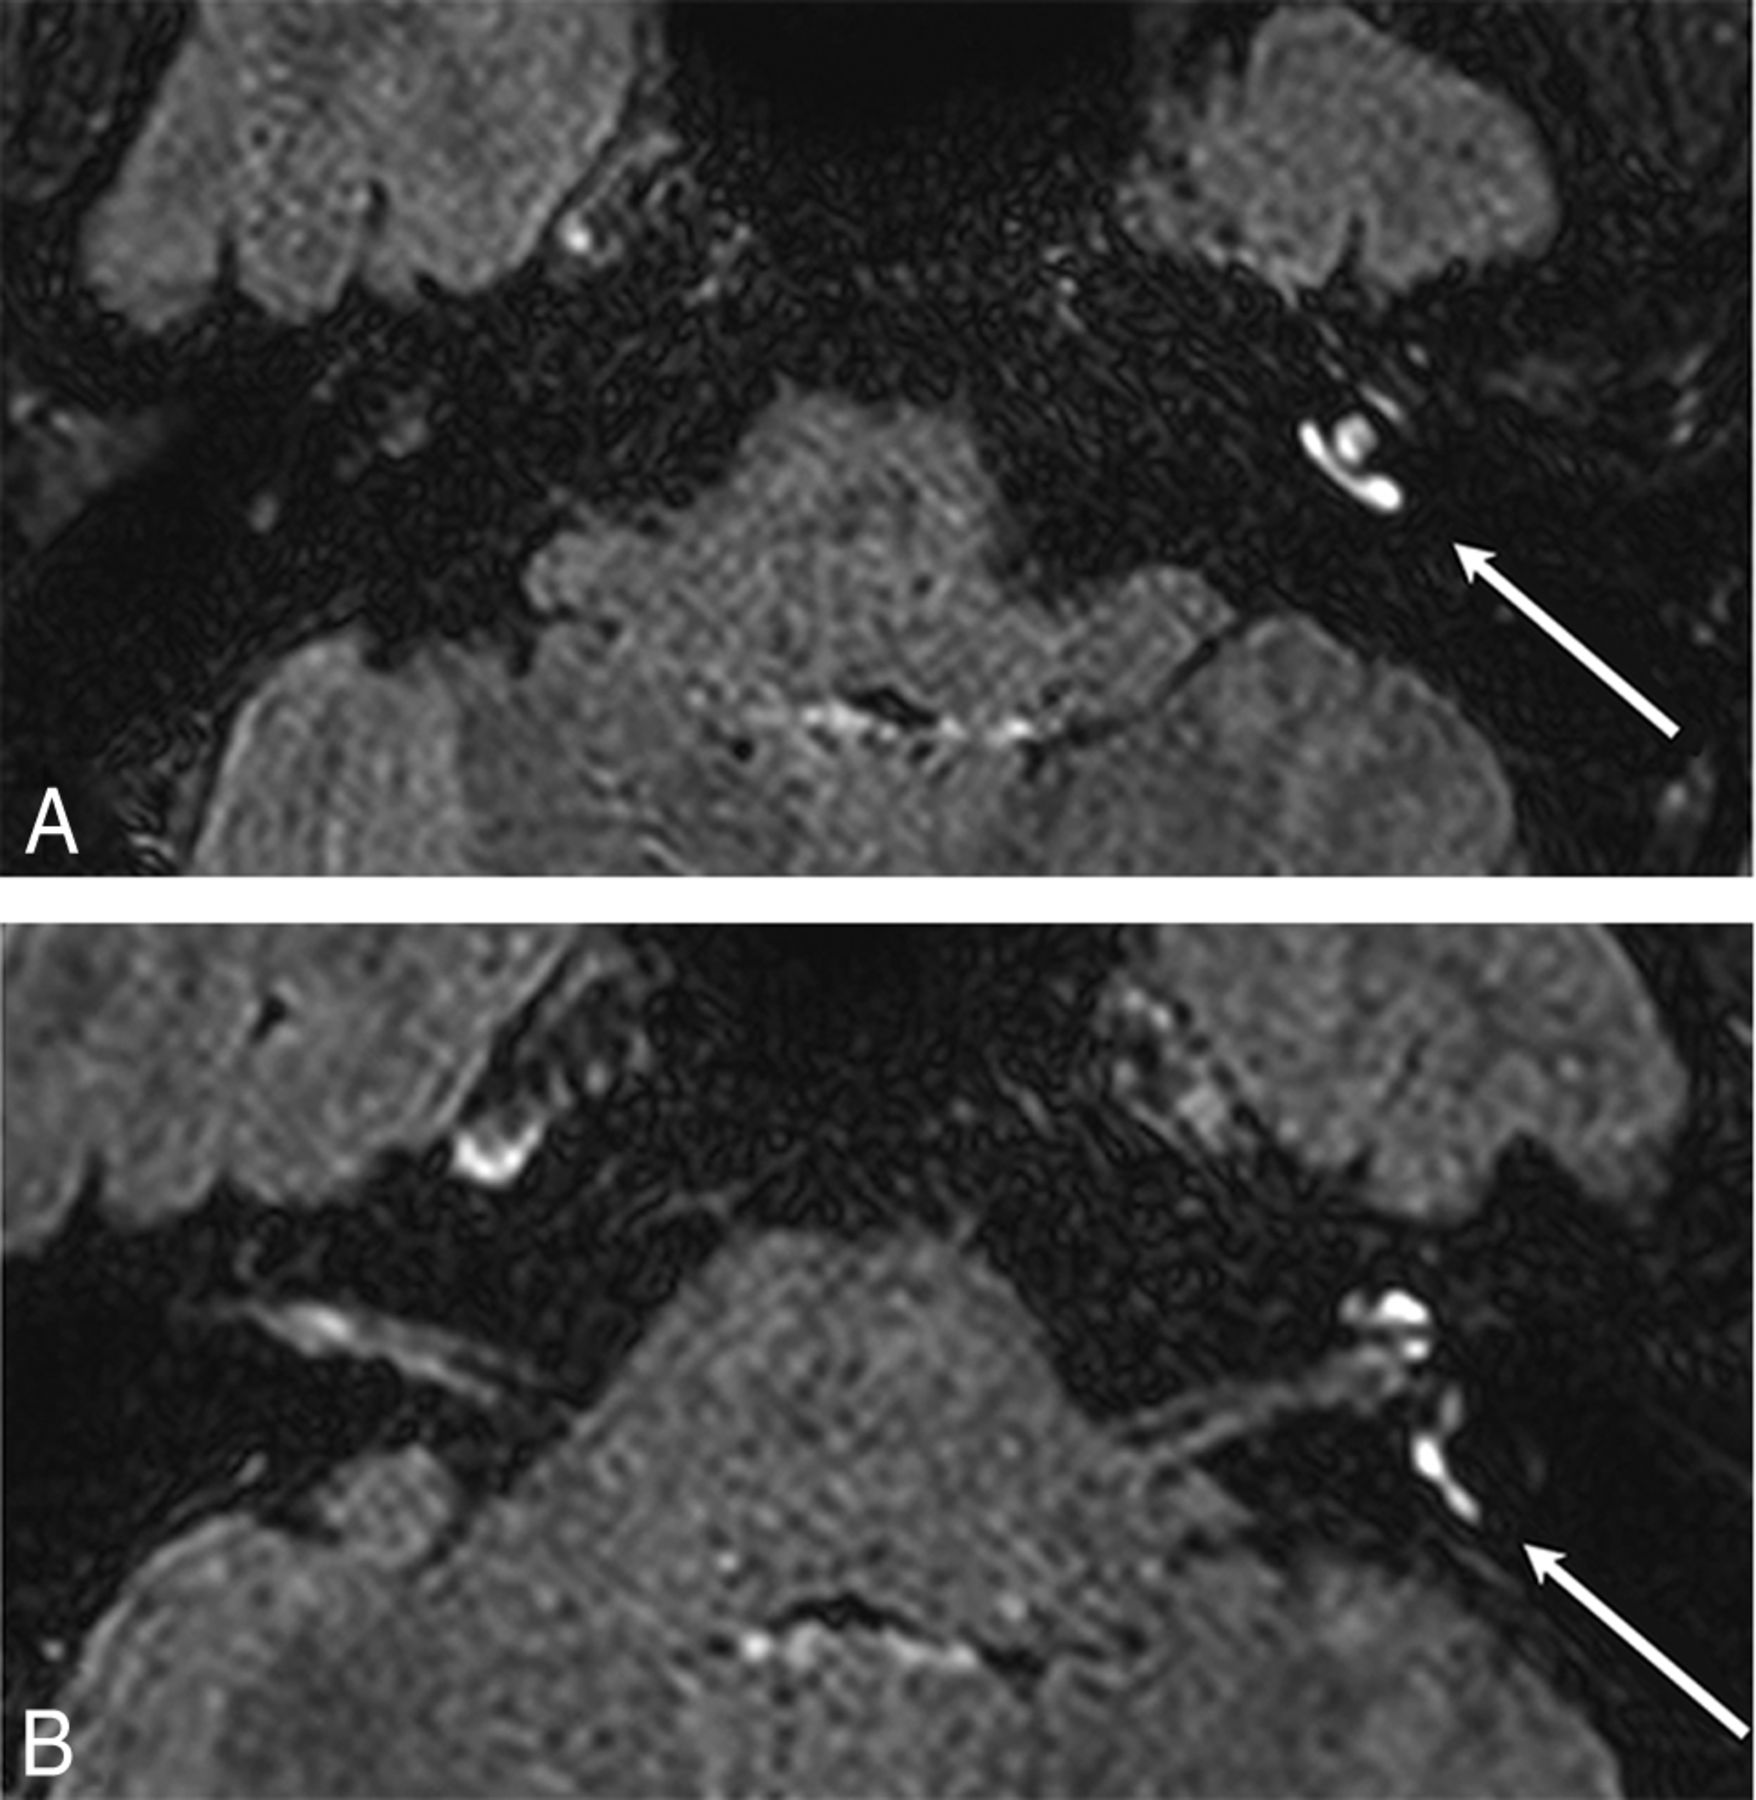
In this study, IV double-dose gadolinium administration provided anatomic discrimination in the 10-minute delayed images, but the 4-hour delayed images showed more accurate anatomic discrimination (Fig 3).

Ten-minute versus 4-hour delayed-enhanced 3D-FLAIR MR imaging in 72-year-old woman diagnosed with vestibular neuronitis (right). Four-hour delayed-enhanced 3D-FLAIR MR imaging (B) shows more definite anatomy of inner ear structures compared with 10-minute delayed-enhanced 3D-FLAIR MR imaging (A).
The signal-intensity ratios of the affected cochleae, vestibules, and vestibulocochlear nerves were higher than those of the unaffected side in both 10-minute and 4-hour delayed images (Table 3). However, there was no significant difference between sides for the trigeminal nerve.
Comparisons of mean signal-intensity ratios of inner ear structures between affected and unaffected sides at different times
On affected sides, the signal-intensity ratio of the vestibulocochlear nerve was higher in patients with nsSNHL than in those with sSNHL on both 10-minute and 4-hour delayed images (P = .01, P = .01, Mann-Whitney test). However, there was no significant difference in the cochlea or vestibule.
Among 30 patients with sSNHL, the signal-intensity ratio of the affected cochleae was significantly higher than that of the unaffected side in 10-minute delayed images (P = .01, paired t test). There was no statistically significant signal-intensity ratio difference in the cochleae with 4 hours of delayed enhancement. There was also no significant signal-intensity ratio difference in the vestibule and vestibulocochlear nerve with 10 minutes and 4 hours of delayed enhancement (Fig 4).

Images of the inner ears obtained at 10 minutes after intravenous gadolinium administration in a 43-year-old female patient who was diagnosed sudden sensorineural hearing loss (left). Enhancement in the left cochlea (A, arrow) in the posterior semicircular canal (B, arrow).
Among 20 patients with nsSNHL, the signal-intensity ratios of affected cochleae and vestibulocochlear nerves were significantly higher than those of unaffected sides in 10-minute delayed images (P = .004, P = .021, Wilcoxon signed rank test). On 4-hour delayed images, the signal-intensity ratios of the affected cochleae, vestibules, and vestibulocochlear nerves were also significantly higher than those of unaffected sides. (P = .001, paired t test; P = .033, Wilcoxon signed rank test; P = .016, paired t test; Fig 5 and Table 4).
Images of inner ears after intravenous gadolinium administration in a 35-year-old female patient diagnosed with Herpes zoster oticus (left). A and B, Four-hour delayed images. A, Enhancement in the left cochlea, vestibule, labyrinthine segment of the facial nerve, and cochlear and vestibular nerves. B, Enhanced basal turn of the left cochlea (arrow). C and D, Ten-minute delayed images. No definite distinguishable enhancement was seen.
P values of signal-intensity ratio difference between affected and unaffected ears in each subgroup at different times (paired t test or Wilcoxon signed rank test)
Discussion
We found that the signal-intensity ratios of the affected cochleae, vestibules, and vestibulocochlear nerves were higher than those of the unaffected side in both 10-minute and 4-hour delayed images in patients with SNHL. There are increasing reports that 4-hour enhancement shows more pronounced and increased signal intensity than 10-minute enhancement, especially in symptomatic ears of dizzy patients.9
Recent articles report that IV gadolinium administration is useful in evaluating the blood-labyrinth barrier in patients with inner ear diseases.7,10 In patients with unilateral Ménière disease who underwent IV gadolinium injection, the affected side was significantly more enhanced than the unaffected side.7 The ratio between the signal intensity of the inner ear and that of the cerebellar hemisphere has been reported as higher in patients with sudden sensorineural hearing loss compared with healthy volunteers.9,11 Signal-intensity ratios may be useful for semiquantitative evaluation of disrupted blood-labyrinthine barriers.6
The results of the present study and previous reports suggest increased permeability of the blood-labyrinth (perilymph) barrier on the affected side for patients with unilateral inner ear symptoms. This increased permeability may have common underlying pathology for diverse otologic disorders, and further investigation is required to clarify this matter.
Among patients with sSNHL, the signal-intensity ratios of the affected cochleae are significantly higher than those of the unaffected side only in 10-minute delayed images. Many recent studies have explored the cause and pathogenesis of sSNHL, but most cases of sSNHL remain idiopathic.12,13 This feature indicates a low possibility of definitive neuritis in patients with sSNHL. In a study of 46 patients with sSNHL, 3D-FLAIR MRI obtained precontrast and at 10 minutes after intravenous gadolinium injection showed significant signal-intensity ratio differences.8 These results may indicate that 10-minute delayed images are superior to 4-hour delayed images in conditions without definitive neuritis, such as sSNHL. In 4-hour delayed images, the contrast enhancement of most structures is washed out except for mild enhancement of the perilymphatic space. Consequently, a mild signal-intensity ratio difference may be less conspicuous in 4-hour delayed images compared with 10-minute delayed images.
Significantly higher signal-intensity ratios of the affected cochleae, vestibules, and vestibulocochlear nerves were identified in patients with nsSNHL with 4-hour delayed images. The signal-intensity ratios of the affected cochleae and vestibulocochlear nerves were higher than those of the unaffected side on 10-minute delayed images. One-quarter of patients with nsSNHL in our group had Ramsay Hunt syndrome and vestibular neuronitis, which are definitely associated with viral origins. This finding may indicate increased nerve sheath permeability due to neuritis. Furthermore, data may indicate that 4-hour delayed images are superior to 10-minute delayed images in conditions with neuritis.
There are some limitations of the present study. First, a degree of selection bias occurred due to the retrospective nature of the study, and the study included only patients with unilateral symptoms. Second, the signal-intensity measurement method was semiquantitative, without the use of an external phantom for reference. Third, the small number of enrolled patients in this study requires validation of our findings in further studies. Fourth, ROIs were small, though we believe that the small size of the ROI of the inner ear structure was accurate. To ensure the reliability of the signal intensity measured in the small ROIs of the inner ear structure and to diminish the measurement error, we determined every ROI twice for each patient on different days and averaged the signal intensities of the 2 measurements, for each of the 2 radiologists. In addition, the differences between the radiologists were then resolved with consensus.
Conclusions
Inner ear signal-intensity ratios with 10-minute and 4-hour delayed intravenous gadolinium enhancement show statistically significant increases in many diseases, especially those associated with neuritis. Anatomic discrimination of inner ear structures is superior with 4-hour delayed enhancement compared with 10-minute delayed enhancement. The images with 4-hour delayed enhancement may be superior in neural inflammatory–dominant conditions, while 10-minute delayed-enhancement images may be superior in neural noninflammatory–dominant conditions.
Footnotes
Paper previously presented in part as a scientific poster at: Annual Meeting of the Radiological Society of North America, November 30 to December 5, 2014; Chicago, Illinois; and as a scientific exhibition at: Annual Meeting of the Korean Congress of Radiology, October 8–11, 2014; Seoul, Republic of Korea.
REFERENCES
- Received February 22, 2015.
- Accepted after revision May 2, 2015.
- © 2015 by American Journal of Neuroradiology


