
Abstract
BACKGROUND AND PURPOSE: Glioblastoma is a common primary brain tumor with a poor but variable prognosis. Our aim was to investigate the feasibility of MR perfusion imaging by using arterial spin-labeling for determining the prognosis of patients with glioblastoma.
MATERIALS AND METHODS: Pseudocontinuous arterial spin-labeling with 3D background-suppressed gradient and spin-echo was acquired before surgery on 53 patients subsequently diagnosed with glioblastoma. The calculated CBF color maps were visually evaluated by 3 independent readers blinded to patient history. Pathologic and survival data were correlated with CBF map findings. Arterial spin-labeling values in tumor tissue were also quantified by using manual fixed-size ROIs.
RESULTS: Two perfusion patterns were characterized by visual evaluation of CBF maps on the basis of either the presence (pattern 1) or absence (pattern 2) of substantial hyperperfused tumor tissue. Evaluation of the perfusion patterns was highly concordant among the 3 readers (κ = 0.898, P < .001). Pattern 1 (versus pattern 2) was associated with significantly shorter progression-free survival by Kaplan-Meier analysis (median progression-free survival of 182 days versus 485 days, P < .01) and trended with shorter overall survival (P = .079). There was a significant association between pattern 1 and epidermal growth factor receptor variant III expression (P < .01).
CONCLUSIONS: Qualitative evaluation of arterial spin-labeling CBF maps can be used to stratify survival and predict epidermal growth factor receptor variant III expression in patients with glioblastoma.
ABBREVIATIONS:
- ASL
- arterial spin-labeling
- EGFR
- epidermal growth factor receptor
- EGFRvIII
- epidermal growth factor receptor variant III
- GBM
- glioblastoma
- HR
- hazard ratio
- OS
- overall survival
- PFS
- progression-free survival
Glioblastomas (GBMs) are the most deadly primary tumors in the CNS, with a median survival time of only 10–15 months.1,2 Increased perfusion of gliomas is associated with higher grade and shorter survival (even within a tumor grade).3⇓⇓⇓⇓⇓–9 Information on tumor perfusion and hemodynamics can be acquired by using various MR imaging techniques. For instance, numerous studies have used dynamic susceptibility-weighted perfusion-weighted imaging, a contrast-enhanced bolus-tracking method, to determine the relative cerebral blood volume within tumors.9⇓⇓–12
Arterial spin-labeling (ASL) is an MR imaging–based technique that measures blood flow and has the advantage, compared with DSC-PWI, of not requiring intravenous contrast injection. ASL scans of high quality can be acquired within 4.5 minutes, making it a practical approach to acquire MR perfusion imaging for clinical use.13,14 ASL has proved reliable and reproducible in the assessment of CBF in various pathologic states. Correlation has been established between DSC- and ASL-derived metrics, including relative CBV and CBF.15 It has also been reported that ASL perfusion imaging correlates with tumor blood vessel attenuation15,16 and is predictive of glioma grade.15,17,18 Changes in ASL-derived CBF correlate with treatment outcome for metastases following stereotactic radiosurgery. Having a completely noninvasive method, such as ASL, of determining tumor blood flow would be highly desirable, particularly if there is a correlation with survival or other outcome measures for GBM.
Tumor blood flow may also be associated with histologic markers or genetic mutations, which may impact patient prognosis and susceptibility to treatment. One such histologic marker is epidermal growth factor receptor variant III (EGFRvIII),19 the most common type of epidermal growth factor receptor (EGFR) variant carrying a primary oncogene effect,20 which is expressed with an overall prevalence of 20%–30% in GBM.21 Although the effect of EGFRvIII on patient survival has not been fully determined,22,23 detection of EGFRvIII expression is increasingly important as therapies that specifically target this receptor are being developed. Earlier studies showed that GBMs expressing EGFRvIII are resistant to chemotherapies.24 The coexpression of EGFRvIII with phosphatase and tensin homolog increases GBM sensitivity to EGFR tyrosine kinase inhibitors.25,26 The demonstrated association of DSC-PWI-derived parameters with EGFRvIII expression19 suggests the potential for MR perfusion imaging as a promising noninvasive marker of EGFRvIII expression.
Although ASL perfusion imaging has shown promise in the evaluation of gliomas, its role as a prognostic measure for GBM has not been fully explored, and the association between ASL-derived measures and important molecular markers such as EGFRvIII is incompletely characterized. In the current study, our purpose was to determine the value of ASL perfusion imaging as a predictor of prognosis in patients with newly diagnosed GBM and as a potential marker for EGFRvIII expression.
Materials and Methods
Patients
From an ongoing registry of patients diagnosed with GBM from July 2010 to July 2013 at Ronald Reagan–UCLA Medical Center, subjects were selected who had the following: 1) presurgical, pre-chemo-/radiation therapy MR imaging, including ASL and postcontrast T1-weighted images; 2) gross total or subtotal tumor resection followed by standard external beam radiation therapy (6000 ± 200 cGy, started within 3–6 weeks after surgical resection) and concomitant/adjuvant chemotherapy that included temozolomide; 3) a histologically confirmed diagnosis of GBM; 4) regular follow-up (once per 4–6 weeks) by a neuro-oncologist to monitor tumor recurrence either until the patient died or until March 31, 2014, when the study was terminated. Seventeen of the 53 total patients (32%) received bevacizumab at recurrence. All patients provided informed consent to participate in our brain tumor data base containing clinical, imaging, and pathologic patient data. This study was approved by the institutional review board and was Health Insurance Portability and Accountability Act–compliant.
Clinical and Histology Data
For all selected patients, progression-free survival data were determined per the Response Assessment in Neuro-Oncology criteria.27 Progression-free survival (PFS) and overall survival (OS) were calculated from the date of surgery.
EGFRvIII expression status in postsurgical GBM tissue was collected from the patient's medical record based on standard testing procedures.28,29
MR Imaging Protocols
MR images were obtained on a 1.5T Avanto or 3T Tim Trio system (Siemens, Erlangen, Germany) by using a 12-channel head coil. The brain tumor imaging protocol included ASL, T2-weighted, FLAIR, DWI, and postcontrast T1-weighted sequences. ASL scans were obtained by using a pseudocontinuous pulse sequence with background-suppressed 3D gradient and spin-echo readout (labeling pulse duration, 1.5 seconds; postlabeling delay, 2 seconds; no flow-crushing gradient; FOV = 22 cm; matrix size = 64 × 64; twenty-six 5-mm sections; generalized autocalibrating partially parallel acquisitions = 2; TE/TR = 22/4000 ms with 30 pairs of tag and control volumes acquired within 4.5 minutes). An M0 image was acquired at the end of the ASL scan with a long postlabeling delay of 4 seconds and a TR of 8 seconds.13,14
ASL Postprocessing and Evaluation
ASL images were corrected for motion, pair-wise subtracted between labeled and unlabeled images and averaged to generate mean difference images and quantitative CBF maps that were calculated by using a published model.13 Motion correction was performed retrospectively by using a custom program based on principal component analysis.30 CBF maps of patients with GBM (n = 53) were visually evaluated by 3 independent readers (board-certified neuroradiologists with 3, 7, and 10 years of experience) blinded to patient history for focal perfusion characteristics of the tumor tissue demonstrated by conventional MR imaging, specifically postcontrast T1-weighted and T2/FLAIR sequences. Two perfusion patterns were characterized by the readers on the basis of visual evaluation of CBF maps demonstrating either the presence (pattern 1) or absence (pattern 2) of substantial and clearly recognizable areas of hyperperfused tumor tissue.
In a separate analysis, a quantitative method was applied to calculate the lesion-to-normal ratio of CBF from areas of tumor that were hyperperfused as identified by visual inspection. ROIs of 3 × 3 pixels in size (10.3 × 10.3 mm, n = 3) were manually set in the tumor area showing the maximal perfusion (maxASLtumor) by visual inspection of the CBF map, and the average value within each ROI was recorded. A second set of ROIs was drawn in the mirrored position on the contralateral hemisphere with normal brain tissue. The lesion-to-normal ratio was calculated by dividing the mean values of maxASLtumor with the mean values of the ROIs in the normal region. We also compared average “hot spot” values from patterns 1 and 2 without normalization to contralateral normal brain.
Statistical Analysis
The interreader agreement in CBF map readings (pattern 1 versus pattern 2) from the 3 readers (n = 53 subjects times 3 readers) was assessed by using κ statistics. The κ value, also known as κ coefficient of agreement, was calculated to evaluate the degree of consensus.
A paired t test was used to compare the mean of maxASLtumor in each subject's tumor and the mean of ASL values from ROIs in normal brain area within and between perfusion patterns (patterns 1 and 2).
ASL CBF map readings in relationship with PFS and OS were analyzed by using univariate and multivariate Cox proportional hazard models with covariates of age and sex. In cases with disagreement on CBF map readings (in which not all readers assigned the images to the same pattern), the cases were assigned to the group (hyper- versus hypoperfused) agreed on by 2 (of 3) readers. Ninety-five percent confidence intervals of the above covariates were calculated. The Kaplan-Meier graph was used to describe ASL CBF map readings at baseline to predict PFS and OS followed by the log-rank test. The correlation between CBF map readings and EGFRvIII expression was analyzed by using the Fisher exact test.
A P value of .05 was accepted as statistically significant. Statistical analysis was performed with STATA software (Version 12, 2012; StataCorp, College Station, Texas).
Results
Patient Characteristics
The mean age of the 53 enrolled patients (28 men, 25 women) at the initial disease presentation was 60.4 ± 13.4 years, ranging from 29.3 to 82.4 years. By the time of the last assessment (March 31, 2014), 45 of the 53 patients (84.9%) had tumor progression and 40 of 53 patients (75.5%) had died.
Evaluation of ASL Maps
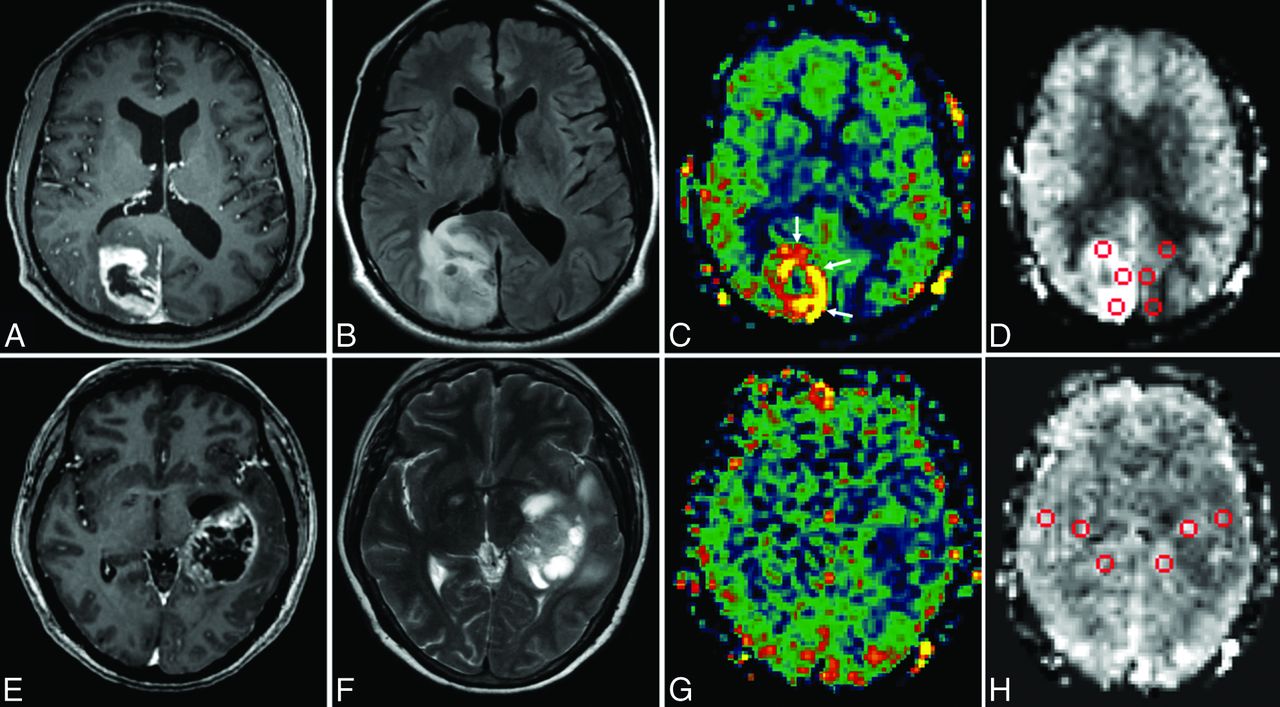
ASL CBF maps of patients with GBM (n = 53) were visually evaluated by 3 board-certified neuroradiologists blinded to patient history for focal perfusion abnormality (hyper- or hypoperfusion) in the tumor tissue. Two perfusion patterns were characterized on the basis of qualitative evaluation by the readers: Pattern 1 was characterized by the presence of substantial and easily identifiable hyperperfused tumor tissue in the CBF map, which often had a “ring-of-fire” appearance (Fig 1A–C); in comparison, pattern 2 corresponded to the absence of such easily identifiable hyperperfused tumor tissue and thus appeared in the CBF map as areas of lower perfusion in the region infiltrated by GBM (Fig 1D–F). The κ agreement test showed that evaluation of the perfusion patterns in CBF maps was highly concordant among the 3 readers (κ = 0.898, P < .001). On the basis of the most votes by readers, 30 of 53 patients (56.6%) had CBF maps of pattern 1, while 23 patients (43.4%) had CBF maps of pattern 2.

Qualitative and quantitative evaluation of ASL CBF maps. Conventional MR imaging (T1-weighted postcontrast imaging in A and E, T2 FLAIR in B, and T2 spin-echo in F) and ASL perfusion imaging (C and G) were visually evaluated by 3 independent readers. Two perfusion patterns can be characterized: Pattern 1 is characteristic of the presence of substantial hyperperfused tumor tissue in the CBF map, which can be identified by the bright ring-of-fire appearance (white arrows in C); in comparison, pattern 2 corresponds to the absence of easily recognizable hyperperfused tumor tissue compatible with a relatively less perfused tumor (G). Quantitative evaluation of ASL CBF maps is performed by applying manual ROIs in the tumoral regions with a ring-of-fire appearance and the mirrored regions in the contralateral hemisphere (D and H).
To confirm that the qualitative assessment of the readers corresponded to true differences in blood flow, a quantitative analysis was performed. The quantitative analysis showed that maxASLtumor was significantly higher than ASL values of normal brain tissue in the group with the pattern 1 CBF map, but not in the group with the pattern 2 CBF map. When comparing groups of pattern 1 with those with pattern 2, there was a significant difference in the maxASLtumor and lesion-to-normal ratio, but not in the mean values of normal brain tissue between the 2 groups (Table 1). Additionally, pattern 1 had statistically elevated CBF compared with pattern 2, without using normalized values. Thus average CBF (in milliliters/100 grams tissue/minute) for tumor was 74.8 ± 26.8 for pattern 1 compared with 32.1 ± 21.7 for pattern 2 (t test, P < .001).
Assessment of ASL valuesa in GBM by manual ROIs
Progression-Free Survival and Overall Survival
In a univariate Cox model, ASL CBF maps with pattern 1 (versus pattern 2) were predictive of shorter PFS (hazard ratio [HR] for progression = 2.23, P = .010) and trended with OS (HR = 1.82, P = .084). This predictive value was also significant for CBF maps with pattern 1 by using the log-rank test (P = .008) (Table 2).
Univariate analysis: ASL CBF map of pattern 1 (versus pattern 2) is predictive of shorter progression-free survival and trended with overall survival
The multivariate Cox model showed that patient age at the time of initial presentation (older than 50 years or younger than 50 years) was a significant predictor of PFS and OS (HR = 2.34, P = .034; and HR = 3.00, P = .024, respectively). ASL perfusion pattern (1 versus 2) remained a significant predictor of PFS (HR = 2.29, P = .009) and trended with OS (HR = 1.98, P = .054) in the multivariate analysis (Table 3).
Multivariate Cox model for PFS and OS
The Kaplan-Meier method with a log-rank test showed that the perfusion patterns of ASL CBF maps stratified PFS (pattern 2 versus pattern 1, a 1.66-fold increase in median PFS; P = .008) and trended with OS (P = .079) (Fig 2).

The Kaplan-Meier curve and log-rank test for progression-free survival and overall survival. GBM perfusion patterns are examined in their relationship to PFS (A) and OS (B). The x-axis shows days after surgery (baseline) with the vertical lines noting 6- and 12-month PFS (A) and 6- and 12-month OS (B), respectively. The y-axis represents the percentage not progressed.
EGFRvIII Expression
Forty-one patients (in our patient cohort of 53, 77%) had EGFRvIII expression examined on postsurgical GBM tissue. Among these patients, 12 were positive for EGFRvIII expression. The Fisher exact test showed a significant association between a pattern 1 CBF map and EGFRvIII expression (P < .01) (Table 4).
Association of CBF map of pattern 1 with EGFRvIII expression in GBMa
Discussion
To date, most studies of GBM perfusion have focused on the role of quantitative parameters, such as relative CBV and CBF, as markers of therapy response and clinical outcome. In the present study, a qualitative examination of CBF maps was conducted in a patient cohort with newly diagnosed GBM, and the potential for predicting tumor and the correlation with EGFRvIII expression were investigated.
We observed 2 perfusion patterns: Pattern 1 was characterized by the presence of hyperperfused tumor tissue in the CBF map, which could be identified by the bright ring-of-fire appearance; in comparison, pattern 2 corresponded to the absence of hyperperfused tumor tissue and thus appeared in the CBF map as iso- or hypoperfusion in the tumoral region. These observations were supported by not only the consistency among independent readers but also quantitative analysis by using ROI-derived ASL values from both tumor and normal brain areas. The quantitative analysis confirmed the qualitative assessment that there was increased CBF in pattern 1 compared with pattern 2. Conceivably, the differentiation in the 2 perfusion patterns could be complicated in case of small tumors that are relatively difficult to identify by visual evaluation. However, this complication did not seem to cause a major problem for reader agreement because reading disagreements existed in only 4 of 53 cases (7.5%).
The visualization of hyperperfused tumor tissue in CBF maps could prove useful for tumor biopsy. One of the clinical challenges for brain tumor biopsy has been the underestimation of the histologic grade due to the stereotactic biopsy samples being only a small portion of the tumor. Identification and sampling from the tumor section with the highest angiogenesis and the cell proliferative rate are essential for adequate evaluation of the tumor grade. Given the correlation between ASL perfusion imaging and the attenuation of blood vessels in the tumor tissue,15,16 it is reasonable to hypothesize that the macroscopic hyperperfused GBM tissue may represent a higher grade tumor. This hypothesis is supported by a study using DSC-PWI, which reported a significant association of tumor perfusion with the Ki67 index, a marker of cell proliferation.6 Therefore, qualitative evaluation of the ASL CBF map may be of added value to multiparametric MR imaging (such as MR spectroscopy, apparent diffusion coefficient, and DSC) and PET/CT as a means of identifying highly proliferative tumor tissue for biopsy.
The perfusion patterns of ASL CBF maps in relation to clinical outcomes were examined by the Kaplan-Meier curve and log-rank test. ASL CBF pattern 1 (versus pattern 2) correlated with shorter PFS and trended with worse OS. Our finding is consistent with previous reports in which increased perfusion in high-grade glioma, as quantified by relative CBV derived from DSC-PWI, had significant correlation with poorer clinical outcomes.11,31,32 Quantitative analysis that correlates parameters such as volumes and mean ASL values of the hyperperfused tumor tissue with clinical outcomes could further develop the potential value of ASL CBF maps as a predictor of tumor prognosis.
EGFRvIII is a truncated extracellular mutant of EGFR protein incapable of binding the epidermal growth factor family of ligands. However, it has been shown to be a constitutively tyrosine-phosphorylated persistent stimulation of growth activity.20 Tykocinski et al19 reported that relative CBV was a strong quantitative indicator of EGFRvIII expression in a study using DSC-PWI. Our study demonstrates a correlation between ASL CBF pattern 1 and EGFRvIII expression with a low sensitivity but high specificity. One possible explanation for the observed low sensitivity is that the hyperperfused tissue in GBM could be caused by effects from multiple genes and/or cross-talk between multiple cell-signaling pathways. For instance, alternative pathways are suggested by reports showing upregulation of the vascular endothelial growth factor with increased relative CBV.19 The high specificity, however, might indicate that EGFRvIII expression alone has enough impact to generate the phenotype of macroscopic hyperperfused tissue in GBM.
The limitations of the present study include variability in therapies of the patient cohort, which may independently affect clinical outcome. However, all patients received standard therapy with radiation treatment and temozolomide, and recent data suggest that bevacizumab (which some patients received), while potentially prolonging progression-free survival by several months, has little impact on survival time.33 Thus, the overall impact of therapy variability may be limited. Our study was also limited by a small sample size, reducing our ability to detect a potentially significant difference in overall survival (not merely progression-free survival) between patient cohorts. The potential value of ASL classifiers as a predictor of tumor prognosis and a marker of EGFRvIII expression requires verification in prospective studies. Although 2 perfusion patterns were identified in the CBF maps, a finding supported by data from quantitative analysis, potentially a more comprehensive quantitative approach, such as histogram analysis, could yield further classifiers of prognostic or predictive significance. However, our qualitative methodology has the advantage of not being reliant on extensive postprocessing, suggesting it could find utility in the real-time work flow of a busy clinical practice setting. One of the challenges for the widespread translation of ASL in clinical practice is that there is a wide range of ASL techniques and imaging protocols available from different vendors and developers. To address this issue, the recent ASL white paper34 recommended pseudocontinuous ASL with a 3D readout and a relatively long postlabeling delay (eg, 2 seconds), which was used in the current study.
Conclusions
The qualitative evaluation of ASL CBF maps provides an expeditious method with high interobserver reliability that stratifies survival and predicts EGFRvIII expression in patients with GBM.
Footnotes
Disclosures: Benjamin M. Ellingson—RELATED: Grant: Genentech/Roche, Siemens. Danny J.J. Wang—RELATED: Grant: National Institutes of Health,* Comments: R01 EB014922/EB/NIBIB, R01 MH080892/MH/NIMH, R01 NS081077/NS/NINDS. Albert Lai—UNRELATED: Consultancy: Genentech/Roche,* Comments: Avastin Scientific Advisory Board. Timothy F. Cloughesy—UNRELATED: Consultancy: VBL, Proximagen, Tocagen, Genentech/Roche, Celgene, Lpath; Expert Testimony: Roche. *Money paid to the institution.
Indicates open access to non-subscribers at www.ajnr.org
REFERENCES
- Received July 11, 2014.
- Accepted after revision September 27, 2014.
- © 2015 by American Journal of Neuroradiology


