Advertisement

Main menu

  • Home
  • Content
    • Current Issue
    • Accepted Manuscripts
    • Article Preview
    • Past Issue Archive
    • Video Articles
    • AJNR Case Collection
    • Case of the Week Archive
    • Case of the Month Archive
    • Classic Case Archive
  • Special Collections
    • AJNR Awards
    • ASNR Foundation Special Collection
    • Most Impactful AJNR Articles
    • Photon-Counting CT
    • Spinal CSF Leak Articles (Jan 2020-June 2024)
  • Multimedia
    • AJNR Podcasts
    • AJNR SCANtastic
    • Trainee Corner
    • MRI Safety Corner
    • Imaging Protocols
  • For Authors
    • Submit a Manuscript
    • Submit a Video Article
    • Submit an eLetter to the Editor/Response
    • Manuscript Submission Guidelines
    • Statistical Tips
    • Fast Publishing of Accepted Manuscripts
    • Graphical Abstract Preparation
    • Imaging Protocol Submission
    • Author Policies
  • About Us
    • About AJNR
    • Editorial Board
    • Editorial Board Alumni
  • More
    • Become a Reviewer/Academy of Reviewers
    • Subscribers
    • Permissions
    • Alerts
    • Feedback
    • Advertisers
    • ASNR Home

User menu

  • Alerts
  • Log in

Search

  • Advanced search
American Journal of Neuroradiology

American Journal of Neuroradiology

ASHNR American Society of Functional Neuroradiology ASHNR American Society of Pediatric Neuroradiology ASSR
  • Alerts
  • Log in

Advanced Search

  • Home
  • Content
    • Current Issue
    • Accepted Manuscripts
    • Article Preview
    • Past Issue Archive
    • Video Articles
    • AJNR Case Collection
    • Case of the Week Archive
    • Case of the Month Archive
    • Classic Case Archive
  • Special Collections
    • AJNR Awards
    • ASNR Foundation Special Collection
    • Most Impactful AJNR Articles
    • Photon-Counting CT
    • Spinal CSF Leak Articles (Jan 2020-June 2024)
  • Multimedia
    • AJNR Podcasts
    • AJNR SCANtastic
    • Trainee Corner
    • MRI Safety Corner
    • Imaging Protocols
  • For Authors
    • Submit a Manuscript
    • Submit a Video Article
    • Submit an eLetter to the Editor/Response
    • Manuscript Submission Guidelines
    • Statistical Tips
    • Fast Publishing of Accepted Manuscripts
    • Graphical Abstract Preparation
    • Imaging Protocol Submission
    • Author Policies
  • About Us
    • About AJNR
    • Editorial Board
    • Editorial Board Alumni
  • More
    • Become a Reviewer/Academy of Reviewers
    • Subscribers
    • Permissions
    • Alerts
    • Feedback
    • Advertisers
    • ASNR Home
  • Follow AJNR on Twitter
  • Visit AJNR on Facebook
  • Follow AJNR on Instagram
  • Join AJNR on LinkedIn
  • RSS Feeds

AJNR is seeking candidates for the AJNR Podcast Editor. Read the position description.

Research ArticlePEDIATRICS

Gray Matter Growth Is Accompanied by Increasing Blood Flow and Decreasing Apparent Diffusion Coefficient during Childhood

N.D. Forkert, M.D. Li, R.M. Lober and K.W. Yeom
American Journal of Neuroradiology September 2016, 37 (9) 1738-1744; DOI: https://doi.org/10.3174/ajnr.A4772
N.D. Forkert
aFrom the Department of Radiology and Hotchkiss Brain Institute (N.D.F.), University of Calgary, Calgary, Alberta, Canada
  • Find this author on Google Scholar
  • Find this author on PubMed
  • Search for this author on this site
  • ORCID record for N.D. Forkert
M.D. Li
bDepartment of Radiology (M.D.L., K.W.Y.), Lucile Packard Children's Hospital, Stanford University, Palo Alto, California
  • Find this author on Google Scholar
  • Find this author on PubMed
  • Search for this author on this site
  • ORCID record for M.D. Li
R.M. Lober
cDepartment of Neurosurgery (R.M.L.), Dayton Children's Hospital, Boonshoft School of Medicine, Dayton, Ohio.
  • Find this author on Google Scholar
  • Find this author on PubMed
  • Search for this author on this site
  • ORCID record for R.M. Lober
K.W. Yeom
bDepartment of Radiology (M.D.L., K.W.Y.), Lucile Packard Children's Hospital, Stanford University, Palo Alto, California
  • Find this author on Google Scholar
  • Find this author on PubMed
  • Search for this author on this site
  • ORCID record for K.W. Yeom
  • Article
  • Figures & Data
  • Supplemental
  • Info & Metrics
  • Responses
  • References
  • PDF
Loading

Abstract

BACKGROUND AND PURPOSE: Normal values of gray matter volume, cerebral blood flow, and water diffusion have not been established for healthy children. We sought to determine reference values for age-dependent changes of these parameters in healthy children.

MATERIALS AND METHODS: We retrospectively reviewed MR imaging data from 100 healthy children. Using an atlas-based approach, age-related normal values for regional CBF, apparent diffusion coefficient, and volume were determined for the cerebral cortex, hippocampus, thalamus, caudate, putamen, globus pallidus, amygdala, and nucleus accumbens.

RESULTS: All gray matter structures grew rapidly before the age of 10 years and then plateaued or slightly declined thereafter. The ADC of all structures decreased with age, with the most rapid changes occurring prior to the age of 5 years. With the exception of the globus pallidus, CBF increased rather linearly with age.

CONCLUSIONS: Normal brain gray matter is characterized by rapid early volume growth and increasing CBF with concomitantly decreasing ADC. The extracted reference data that combine CBF and ADC parameters during brain growth may provide a useful resource when assessing pathologic changes in children.

ABBREVIATION:

ASL
arterial spin-labeling

At birth, brain volume is approximately one-third that of a healthy adult brain and undergoes rapid growth during the first 3 months.1 By the age of 1 year, brain volume has already doubled in size.2 Initially, most hemispheric growth relates to an increase in gray matter volume,3 thought to reflect synapse formation occurring earliest in the primary motor and sensory cortices and later in the prefrontal cortex,4 directing a posterior-to-anterior pattern of hemispheric white matter maturation.5 After the first few years, white matter volume increases at a higher rate during the rest of the childhood,6 while synaptic pruning occurs concurrently in the gray matter.4

Compared with macrostructural analysis using image-based volume extraction, diffusion-weighted MR imaging can be used to probe microstructural changes, including myelination patterns7,8 and white matter connectivity,9 and has also shown utility for brain tumor characterization10 and metabolic diseases.11 Various studies have examined apparent diffusion coefficient changes of white matter in children.12⇓–14 However, at present, the ADC of the gray matter, notably at the cortical level, is not well-documented.

While volumetric and diffusion analysis can be used to probe macro- and microstructural changes, respectively, arterial spin-labeling (ASL) cerebral blood flow is increasingly used clinically to obtain advanced physiologic information.15⇓⇓–18 ASL may be particularly useful in the pediatric population because it does not require intravenous contrast or ionizing radiation. However, only a few studies have examined ASL CBF changes in children.19,20

These few studies have included ASL CBF of unsedated healthy term and preterm neonates21 or infants 3–5 months of age.22 Apart from these 2 studies, normal values have also been assessed as part of studies investigating CBF changes across the whole life span with only limited data from children20 or for feasibility analysis of ASL imaging, also using only a limited number of healthy children.19

At present, no study has examined the CBF of a healthy pediatric cohort across the age spectrum. Therefore, the goal of this study was to extract and establish age-related CBF values in gray matter along with corresponding volume and diffusion metrics.

Materials and Methods

Study Cohort

All children presenting for evaluation by a 3T MR imaging system at our children's hospital from May 2010 to October 2013 were retrospectively reviewed after approval by the Stanford University institutional review board (protocol 28674). The study cohort included patients 4 months to 18 years of age with no known neurologic, neurocognitive, or developmental deficits, who had a normal appearing brain MRI protocol that included ASL and DWI datasets. All MR imaging brain studies with normal findings were additionally reviewed and confirmed by at least 1 pediatric neuroradiologist with a Certificate of Added Qualification (K.W.Y. or P. Barnes both with >7 years of dedicated experience). Patients who had brain MR imaging with any focal intensity on FLAIR or other sequences, cysts, wide Sylvian fissures, or other nonspecific structural appearances were excluded. Patients with dental braces/metal artifacts and motion-degraded or non-diagnostic-quality imaging were also excluded.

A thorough chart review was performed (M.D.L.) to identify any disease history. Examples of clinical reasons for obtaining MR imaging included syncope, nausea, family history of aneurysm or cancers, scalp nevus, isolated facial lesions (eg, orbital or glabellar dermoid) without associated syndromes or intracranial extension, orbital strabismus, cholesteatoma of the ear, isolated headaches, sinus disease or inflammatory nasal obstruction, and short stature that was considered familial without intracranial or endocrine abnormality.

Patients with any systemic or non-central nervous system diseases (eg, diseases of the renal, gastrointestinal, cardiac systems), cancers, history of prematurity, phacomatoses, genetic or syndromic conditions, epilepsy, migraines, hearing loss, hemorrhage, vascular lesions (aneurysm, AVM, fistula, or steno-occlusive disease of the CNS or elsewhere), acute or recent infection and fever of unknown origin, prior radiation or chronic medical therapy, or endocrine symptoms/laboratory abnormalities were excluded. Patients were also screened for all psychiatric and abnormal behavioral conditions (attention deficit/hyperactivity disorder, autism, psychosis) and were excluded if present.

Finally, subjects with insufficient data or registration results (see below) were also excluded from the final analysis.

Imaging Methods

All subjects had brain MR imaging obtained at 3T (Discovery 750; GE Healthcare, Milwaukee, Wisconsin) using an 8-channel head coil. Pseudocontinuous ASL MR imaging was performed using the technique described by Dai et al.23 Briefly, this vendor-supplied ASL was performed using a pseudocontinuous labeling period of 1500 ms, followed by a 1500-ms postlabel delay. Whole-brain images were acquired with a 3D background-suppressed fast spin-echo stack-of-spirals method. Multiarm spiral imaging was used, with 8 arms and 512 points acquired on each arm (bandwidth = 62.5 kHz), yielding a 3-mm2 in-plane spatial resolution and a 4-mm section thickness. A high level of background suppression was achieved using 4 separate inversion pulses spaced around the pseudocontinuous labeling pulse. The acquisition time for this sequence is approximately 5 minutes, which also includes proton-density images required for CBF quantification. For a graphic setup of the ASL, the sagittal image following the 3-plane localizer was used for alignment. Postprocessing was performed using an automated reconstruction procedure using the microsphere methodology described by Buxton et al.24 Other pseudocontinuous ASL MR imaging parameters were TR = 4632 ms, TE = 10.5 ms, FOV = 24 cm, and NEX = 3.

Additionally, echo-planar DWI was performed using TR = 1500 ms, TE = 37 ms, flip angle = 90°, acceleration factor = 2, in-plane resolution = 0.94 mm2, acquisition matrix = 128 × 128 interpolated to a 256 × 256 matrix, 44 sections with 4-mm section thickness, no skip, FOV = 24 cm, 2 diffusion-weightings of b=0 s/mm2 and b=1000 s/mm2, with diffusion gradients acquired in 3 directions averaged for the latter.

Image Processing

The image-processing pipeline used for extraction of quantitative values of regional brain volume, ADC, and CBF is illustrated in Fig 1. The complete image-processing pipeline used was custom-developed and implemented in C++ using the Insight Segmentation and Registration Toolkit (ITK, http://www.itk.org/). In the first step of this pipeline, the ASL CBF and b=1000 s/mm2 DWI dataset were registered to the corresponding T2-weighted DWI dataset (b=0 s/mm2) using rigid transformations, linear interpolation, and maximization of the mutual information.25 The registered DWI datasets were then used to calculate the corresponding ADC map for each subject using the Stejskal-Tanner equation.26

Fig 1.
  • Download figure
  • Open in new tab
  • Download powerpoint
Fig 1.

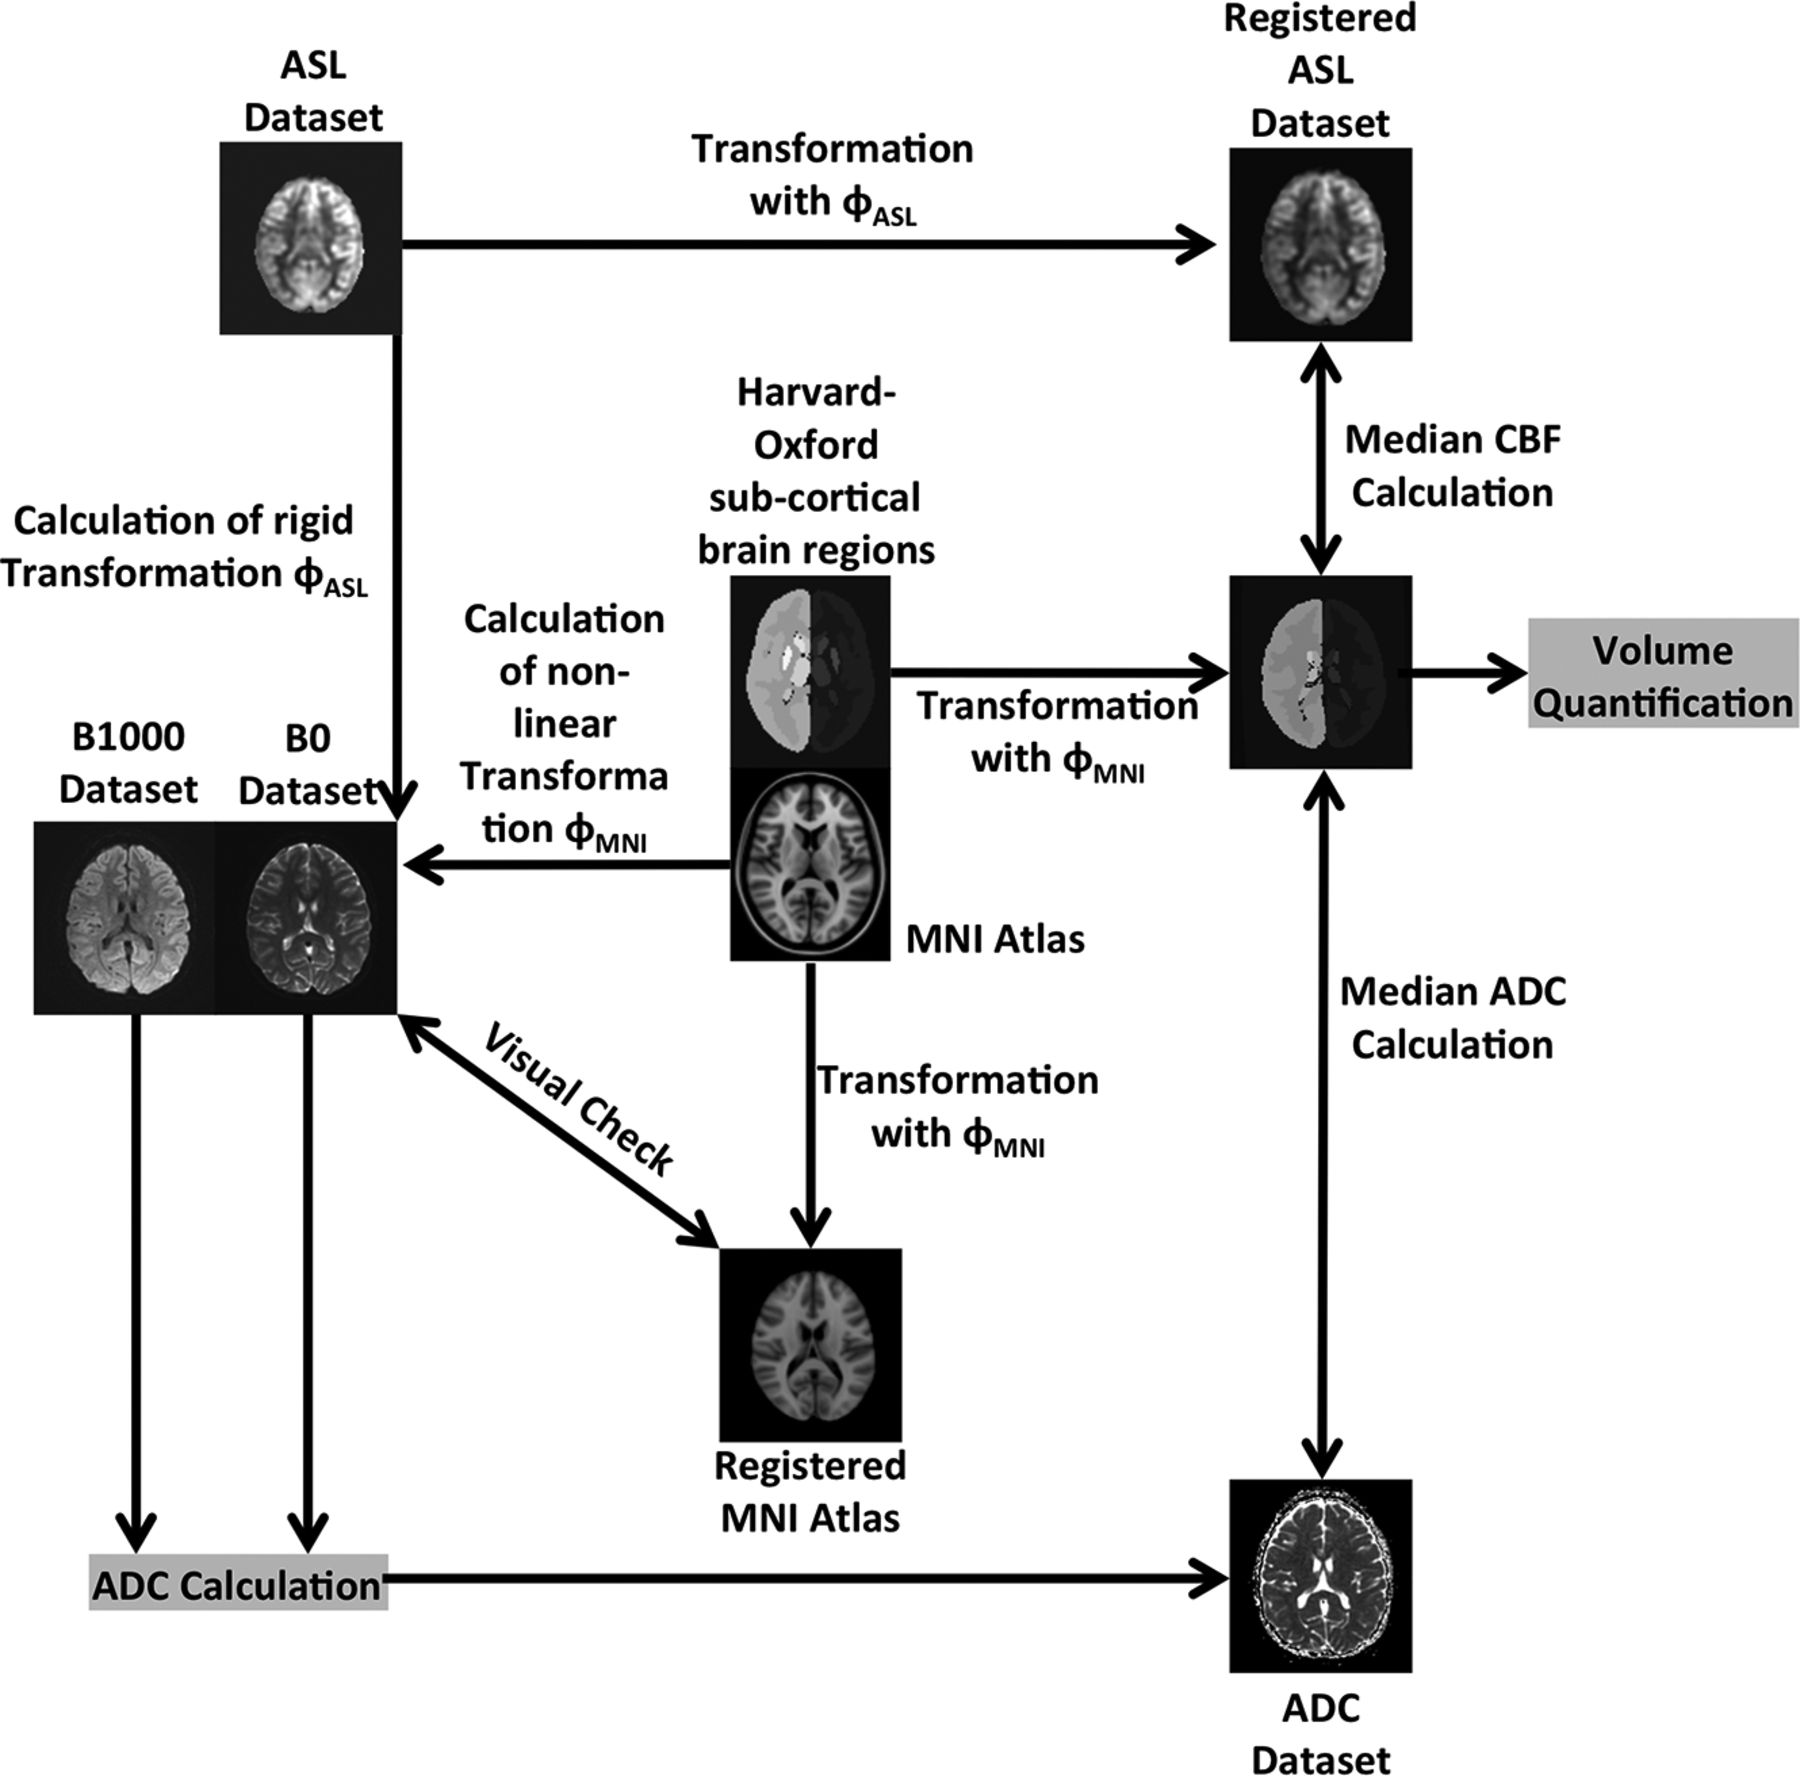
Illustration of the image-processing pipeline used for determination of the age-dependent volumetric, ADC, and CBF normal values.

Finally, the Montreal Neurological Institute-152 brain atlas27 was registered to each b = 0 s/mm2 DWI dataset using a concatenated affine and nonlinear spline transformation. The affine transformation was determined using a linear interpolation and maximization of the mutual information metric. The calculated affine transformation was used to prealign the atlas to the patient anatomy in terms of initialization of a b-spline transformation, which was used for the fine nonlinear alignment of the Montreal Neurological Institute atlas to the b=0 s/mm2 DWI dataset. This b-spline transformation was optimized using linear interpolation and maximization of the mutual information metric.

All registrations were performed within a multiresolution registration framework with 3 levels, while the calculation of the mutual information similarity metric was restricted in all cases to the brain mask of the b=0 s/mm2 DWI dataset, which was generated using the method described by Forkert et al.28 Two experienced observers (N.D.F., K.W.Y.) checked all registration results to ensure suitable data and registration quality.

For quantitative assessment of volume, ADC, and CBF of the different gray matter brain regions, the resulting nonlinear spatial deformation field for alignment of the Montreal Neurological Institute atlas to each subject was used to warp the Harvard-Oxford subcortical brain regions, as defined in the Montreal Neurological Institute atlas space, to each b=0 s/mm2 DWI dataset by applying nearest neighbor interpolation.

After registration of all datasets, volume, median ADC, and median CBF values were determined for each subject within the following 8 gray matter brain structures: cerebral cortex, hippocampus, thalamus, caudate, putamen, globus pallidus, amygdala, and nucleus accumbens.

Statistical Analysis

The volume for each structure was averaged between the 2 corresponding structures in the left and right hemispheres, while the median ADC and median CBF values were determined for each region combined for the left and right hemispheres.

The quantile local piecewise regression analysis described by Sakov et al29 was used in this work to determine the age-related 5th, 10th, 25th, 50th, 75th, 90th, and 95th quantile curves individually for each brain structure and for the 3 parameters: volume, ADC, and CBF. The parameters for the local piecewise regression analysis were kept identical for all plots generated. More specifically, a window size of 30 points, 95% overlap between the windows, Gaussian smoothing, and a polynomial degree of 2 were used.

Each scatterplot and corresponding regression curves were inspected for qualitative description of the age-related changes.

In our study, intravenous propofol sedation was performed for all children 3 months to 6 years of age. After 10 years of age, no patients received sedation. Between 6 and 9 years of age, there were variable rates of sedation. In this age group, comparison of sedated and nonsedated groups was conducted using the Welch 2-tailed t test to test for significant differences between children with and without sedation.

All statistics were calculated using the R statistical software package of The R Foundation of Statistical Computing (Version 3.2.2; www.r-project.org).

Results

One hundred healthy subjects (age range, 4 month to 18 years; 39 males) met the inclusion criteria and were included in the study. The specific number of children in each age group is summarized in the Table. Overall, all structures analyzed exhibited similar patterns of the age-dependent distribution of regional brain volume, ADC, and CBF values with different levels. Figure 2 exemplarily displays the age-dependent distribution of regional brain volume, ADC, and CBF values in the thalamus. The corresponding graphs for all gray matter structures analyzed in this work can be found in On-line Fig 1.

View this table:
  • View inline
  • View popup

Age distribution of neurologically healthy patients

Fig 2.
  • Download figure
  • Open in new tab
  • Download powerpoint
Fig 2.

Graphic representation of the age-dependent volumetric, ADC, and CBF normal values for the thalamus illustrated using the 5%, 10%, 25%, 50%, 75%, 90%, and 95% centile curves.

Gray Matter Volume

In general, the volume increased with age in all gray matter structures. The volumetric increase with age was nonlinear and was highest from birth to approximately 8–10 years of age. Thereafter, volumes reached a stable plateau or displayed a slight decrease.

ADC of the Gray Matter

Median ADC values of the gray matter declined with increasing age. The highest median ADC values occurred in the first 5 years of childhood. During this period, an exponential decay of ADC values was observed in all gray matter structures. After 5 years of age, ADC continued to decrease in a rather linear fashion with increasing age. Overall, median ADC values in the cerebral cortex and hippocampus were about 10% higher than in the other gray matter regions investigated. This finding was consistent across all age groups.

CBF of the Gray Matter

Cerebral blood flow was more variable than volume and ADC, particularly in the first 5 years of childhood. Unlike the rapid volume and ADC changes in the first 5 years of life, CBF increased rather linearly with age, with decreased variability at older ages. CBF in all gray matter structures increased with age, except for the globus pallidus, which was stable throughout childhood. The degree of CBF increase did not differ considerably among the caudate, thalamus, putamen, nucleus accumbens, and amygdala, but a smaller degree of CBF increase was found for the hippocampus, and a larger CBF increase, for the cerebral cortex with age.

Sedated versus Nonsedated Children

The comparison of sedated (n = 7; mean age, 7.6 years) and nonsedated children (n = 4; mean age, 7.9 years) revealed no significant CBF differences in any brain region studied (Welch 2-tailed t test, P > .01; Bonferroni-adjusted significance level = .005).

Discussion

Gray matter CBF increased with age, except in the globus pallidus. Notably, the cerebral cortex, amygdala, and nucleus accumbens showed the highest CBF increase. These CBF changes were accompanied by a progressive ADC decrease and volumetric increase for all gray matter structures, with ADC stabilizing at about 10–12 years and peak volume occurring at around 8–12 years, with a slight decrease thereafter. To our knowledge, this is the first study to investigate age-related changes of gray matter CBF accompanied by corresponding volume and ADC values in a single cohort of neurologically healthy children throughout childhood and adolescence.

Our volumetric results are consistent with prior studies of healthy subjects that showed an overall increase in cortical gray matter volume in the preadolescent years and a decline in the postadolescent period.30 Volumetric analysis for infancy and early childhood remains sparse, but our results are also consistent with the growth pattern described in a study of 28 children 1 month to 10 years of age, in whom a rapid growth pattern was followed by a more gradual increase.31 A more recent study that focused on infants (3–13 months of age) also observed an increasing volume of all gray matter regions with some regionally different growth patterns.32

While volume increased, the ADC of the gray matter declined rapidly, with a fast exponential component in the first few years, which then stabilized in early adolescence. These findings likely reflect the combined effects of neuronal development, myelination, and decrease in water content33 and associated MR imaging signal changes34,35 that rapidly occur in the early years of development. Potential contributions of iron-deposition that decrease T2 relaxation time may also be considered, particularly in the deep gray nuclei, which has been observed in children older than 4 years of age and in adolescents.36

Although various studies have reported ADC changes of cerebral white matter in children,12⇓–14 gray matter structures have remained relatively unexplored. We observed a steep decline with an exponential component in early childhood with a decreasing trend continuing into later childhood, consistent with results of prior ROI-based studies in selected deep gray regions (caudate, putamen, globus pallidus).37,38

Compared with volume and ADC changes, a wider variation in CBF values was seen across age. In addition, median CBF values and the magnitude of increase varied among the gray matter regions. Previous studies have described a close relationship between CBF and the cerebral metabolic rate39⇓–41; and in a study of cerebral metabolism in 29 children (5 days to 15 years of age) using 18F-FDG positron-emission tomography, a similar pattern of highest proportional increase in metabolic activity was seen in the cerebral cortex compared with the other brain regions.42

We observed a gradual increase in CBF in all gray matter regions, except for the globus pallidus, throughout childhood and adolescence, which differs from a previous ASL CBF study that described a relatively stable-to-decreased CBF between 4 and 12 years of age, followed by a sharp decline in adolescence20 in 23 children aged 4–19 years. One possible explanation might be differences in postlabel delay periods. Because the ASL tracer lifetime is dependent on the longitudinal relaxation time of blood, which is similar to the transport time from the labeling position to the tissue (arterial transit time), a shorter postlabel delay period of 1000 ms used in the study by Biagi et al20 may be insufficient for complete delivery of labeled blood to the tissue, a potential limitation when assessing adolescents with slower arterial transit time compared with younger children.43,44 The present data in our study were obtained from a pseudocontinuous ASL technique, which has been shown to have a superior labeling efficiency,23 signal-to-noise ratio, and reproducibility,45 and is thus preferred over other ASL methods. We also used a postlabel delay of 1500 ms recommended by the current guidelines of the International Society for Magnetic Resonance in Medicine for clinical imaging of the pediatric brain.46

Biagi et al20 also observed increased gray matter CBF in pediatric patients receiving halogenated anesthesia relative to awake patients, which was rather similar to those receiving only intravenous propofol. A review of adult functional imaging studies noted that propofol was associated with decreased CBF, determined by PET, in all brain regions in multiple studies.47 Thus, a disproportionate number of younger children requiring halogenated anesthesia could have affected their results. For example, an ASL study in 4 patients with Moyamoya disease found that halogenated anesthesia (sevoflurane) was associated with consistently higher global gray matter CBF.48 In our study, intravenous propofol sedation, with or without mask induction using a halogenated anesthetic, was performed for all children 3 months to 6 years of age. Between 6 and 9 years of age, there were variable rates of sedation. The statistical analysis of children with and without sedation in this age range showed no significant differences. This could possibly be explained by a balancing effect of increased CBF with halogenated anesthesia and decreased CBF with propofol.20 Thus, no correction was necessary in this study.

Brain development has been shown to be associated with regional changes in the glucose cerebral metabolic rate42 and CBF.49 Thus, continued increases in ASL CBF during childhood and adolescence may reflect a more protracted period of functional development and maturation. While global cerebral volume has been shown to peak at 14.5 years for boys and 11.5 years for girls, changes in cortical gray matter volume are more complex and have shown regional heterochronicity.50 For example, in a study of 145 subjects 4–21 years of age, the frontal and parietal lobes showed an earlier peak at 11–12 years of age, while maximal temporal gray matter volumes occurred at 16–17 years of age, and the occipital lobes had a linear increase through 20 years of age without signs of decline.30 Previous studies have also reported periods of postnatal rapid brain growth up to 20 years of age based on electroencephalography energy metrics in the α frequencies.51,52 A spike in CBF was observed preceding these stages of brain growth, suggesting a higher energy requirement during these periods,53 a pattern also seen in the rat cerebral cortex that has shown increased vascular sprouting shortly before rapid growth stages.54

Individual differences in brain growth spurts may also explain variations of CBF observed in the present study to some degree. While the definitive reasons for relatively stable CBF in the globus pallidus and a slower rate of CBF increase in the hippocampus compared with the other brain regions analyzed remain unknown, it is possible that these regions demonstrate different rates of growth or metabolism. For example, a morphometric analysis of infants 3–13 months of age showed a slower growth rate in certain brain regions, such as the globus pallidus and hippocampus, relative to the whole brain, despite an overall increase in volume in absolute values.32

We recognize certain limitations of this study. For example, for our analysis, the adult Montreal Neurological Institute atlas was registered to the pediatric brain. While registration of a pediatric atlas might be more accurate for this purpose, different brain atlases generated by using different age ranges and subjects (eg, described by Fonov et al55) would be necessary, potentially making the results not directly comparable. Therefore, we decided to use the well-established Montreal Neurological Institute adult brain atlas with the available Harvard-Oxford atlas brain regions for this purpose so that the same reference was used for each subject to analyze CBF, ADC, and volume data metrics. To minimize any effects of suboptimal registration results, we performed further quality control, including visual inspection by our team members with knowledge of brain imaging and anatomy. Within this context, 22 subjects not part of the 100 subjects described in this study were excluded from the final analysis due to insufficient registration of the Montreal Neurological Institute brain atlas.

In addition, the b=0 s/mm2 DWI datasets were used as a reference for atlas registration. These datasets do not offer the same high spatial resolution compared with T1-weighted datasets usually used for this purpose, which limits the precision of the extracted regional brain volumes, especially for small structures such as the amygdala.

However, although our goal was to demonstrate CBF changes against volume and ADC across various age groups for various brain regions rather than to define precise metrics for volume, the growth patterns found are well in line with previous findings, suggesting reasonable registration results.

Finally, the regional brain volumes were averaged between corresponding left and right hemispheric structures, while median ADC and CBF values were calculated for each combined corresponding left and right hemisphere brain structure. This procedure was selected to decrease the influence of noise in the data, especially for the small structures such as the amygdala and nucleus accumbens. When analyzed separately, no significant difference between the age-related trends of corresponding left and right brain structures was found for the regional brain volume, ADC, and CBF metrics.

Conclusions

Normal gray matter is characterized by rapid early volume growth and increasing CBF, with concomitantly decreasing ADC. The extracted reference data that combine CBF and ADC parameters during brain growth may provide a useful resource when assessing pathologic changes in children.

Acknowledgments

The authors would like to thank Patrick Barnes, Department of Pediatric Neuroradiology, Stanford University, for his support in reviewing the MR imaging brain studies used in this work.

Footnotes

  • This work was supported by a Brain and Behavior Center Award in Pediatric Neurosciences at Stanford Lucile Packard Children's Hospital.

References

  1. 1.↵
    1. Holland D,
    2. Chang L,
    3. Ernst TM, et al
    . Structural growth trajectories and rates of change in the first 3 months of infant brain development. JAMA Neurol 2014;71:1266–74 doi:10.1001/jamaneurol.2014.1638 pmid:25111045
    CrossRefPubMed
  2. 2.↵
    1. Gilmore JH,
    2. Lin W,
    3. Prastawa MW, et al
    . Regional gray matter growth, sexual dimorphism, and cerebral asymmetry in the neonatal brain. J Neurosci 2007;27:1255–60 doi:10.1523/JNEUROSCI.3339-06.2007 pmid:17287499
    Abstract/FREE Full Text
  3. 3.↵
    1. Knickmeyer RC,
    2. Gouttard S,
    3. Kang C, et al
    . A structural MRI study of human brain development from birth to 2 years. J Neurosci 2008;28:12176–82 doi:10.1523/JNEUROSCI.3479-08.2008 pmid:19020011
    Abstract/FREE Full Text
  4. 4.↵
    1. Huttenlocher PR,
    2. Dabholkar AS
    . Regional differences in synaptogenesis in human cerebral cortex. J Comp Neurol 1997;387:167–78 pmid:9336221
    CrossRefPubMed
  5. 5.↵
    1. Nelson CA,
    2. Luciana M
    1. Sampaio CS,
    2. Truwit CL
    . Myelination in the developing brain. In: Nelson CA, Luciana M, eds. Handbook of Developmental Cognitive Neuroscience. Cambridge, Massachusetts: MIT Press; 2001:35–44
  6. 6.↵
    1. Dubois J,
    2. Dehaene-Lambertz G,
    3. Kulikova S, et al
    . The early development of brain white matter: a review of imaging studies in fetuses, newborns and infants. Neuroscience 2014;276:48–71 doi:10.1016/j.neuroscience.2013.12.044 pmid:24378955
    CrossRefPubMed
  7. 7.↵
    1. Loh KB,
    2. Ramli N,
    3. Tan LK, et al
    . Quantification of diffusion tensor imaging in normal white matter maturation of early childhood using an automated processing pipeline. Eur Radiol 2012;22:1413–26 doi:10.1007/s00330-012-2396-3 pmid:22434420
    CrossRefPubMed
  8. 8.↵
    1. Uda S,
    2. Matsui M,
    3. Tanaka C, et al
    . Normal development of human brain white matter from infancy to early adulthood: a diffusion tensor imaging study. Dev Neurosci 2015;37:182–94 doi:10.1159/000373885 pmid:25791575
    CrossRefPubMed
  9. 9.↵
    1. Alcauter S,
    2. Lin W,
    3. Smith JK, et al
    . Development of thalamocortical connectivity during infancy and its cognitive correlations. J Neurosci 2014;34:9067–75 doi:10.1523/JNEUROSCI.0796-14.2014 pmid:24990927
    Abstract/FREE Full Text
  10. 10.↵
    1. Löbel U,
    2. Sedlacik J,
    3. Reddick WE, et al
    . Quantitative diffusion-weighted and dynamic susceptibility-weighted contrast-enhanced perfusion MR imaging analysis of T2 hypointense lesion components in pediatric diffuse intrinsic pontine glioma. AJNR Am J Neuroradiol 2011;32:315–22 doi:10.3174/ajnr.A2277 pmid:21087935
    Abstract/FREE Full Text
  11. 11.↵
    1. Dyke JP,
    2. Voss HU,
    3. Sondhi D, et al
    . Assessing disease severity in late infantile neuronal ceroid lipofuscinosis using quantitative MR diffusion-weighted imaging. AJNR Am J Neuroradiol 2007;28:1232–36 doi:10.3174/ajnr.A0551 pmid:17698521
    Abstract/FREE Full Text
  12. 12.↵
    1. Löbel U,
    2. Sedlacik J,
    3. Güllmar D, et al
    . Diffusion tensor imaging: the normal evolution of ADC, RA, FA, and eigenvalues studied in multiple anatomical regions of the brain. Neuroradiology 2009;51:253–63 doi:10.1007/s00234-008-0488-1 pmid:19132355
    CrossRefPubMed
  13. 13.↵
    1. Engelbrecht V,
    2. Scherer A,
    3. Rassek M, et al
    . Diffusion-weighted MR imaging in the brain in children: findings in the normal brain and in the brain with white matter diseases. Radiology 2002;222:410–18 doi:10.1148/radiol.2222010492 pmid:11818607
    CrossRefPubMed
  14. 14.↵
    1. Rollins NK,
    2. Glasier P,
    3. Seo Y, et al
    . Age-related variations in white matter anisotropy in school-age children. Pediatr Radiol 2010;40:1918–30 doi:10.1007/s00247-010-1744-1 pmid:20577731
    CrossRefPubMed
  15. 15.↵
    1. Chen J,
    2. Licht DJ,
    3. Smith SE, et al
    . Arterial spin labeling perfusion MRI in pediatric arterial ischemic stroke: initial experiences. J Magn Reson Imaging 2009;29:282–90 doi:10.1002/jmri.21641 pmid:19161176
    CrossRefPubMed
  16. 16.↵
    1. Yeom KW,
    2. Lober RM,
    3. Alexander A, et al
    . Hydrocephalus decreases arterial spin-labeled cerebral perfusion. AJNR Am J Neuroradiol 2014;35:1433–39 doi:10.3174/ajnr.A3891 pmid:24651817
    Abstract/FREE Full Text
  17. 17.↵
    1. Yeom KW,
    2. Lober RM,
    3. Barnes PD, et al
    . Reduced cerebral arterial spin-labeled perfusion in children with neurofibromatosis type 1. AJNR Am J Neuroradiol 2013;34:1823–28 doi:10.3174/ajnr.A3649 pmid:23764727
    Abstract/FREE Full Text
  18. 18.↵
    1. Yeom KW,
    2. Mitchell LA,
    3. Lober RM, et al
    . Arterial spin-labeled perfusion of pediatric brain tumors. AJNR Am J Neuroradiol 2014;35:395–401 doi:10.3174/ajnr.A3670 pmid:23907239
    Abstract/FREE Full Text
  19. 19.↵
    1. Wang J,
    2. Licht DJ,
    3. Jahng GH, et al
    . Pediatric perfusion imaging using pulsed arterial spin labeling. J Magn Reson Imaging 2003;18:404–13 doi:10.1002/jmri.10372 pmid:14508776
    CrossRefPubMed
  20. 20.↵
    1. Biagi L,
    2. Abbruzzese A,
    3. Bianchi MC, et al
    . Age dependence of cerebral perfusion assessed by magnetic resonance continuous arterial spin labeling. J Magn Reson Imaging 2007;25:696–702 doi:10.1002/jmri.20839 pmid:17279531
    CrossRefPubMed
  21. 21.↵
    1. Miranda MJ,
    2. Olofsson K,
    3. Sidaros K
    . Noninvasive measurements of regional cerebral perfusion in preterm and term neonates by magnetic resonance arterial spin labeling. Pediatr Res 2006;60:359–63 doi:10.1203/01.pdr.0000232785.00965.b3 pmid:16857776
    CrossRefPubMed
  22. 22.↵
    1. Duncan AF,
    2. Caprihan A,
    3. Montague EQ, et al
    . Regional cerebral blood flow in children from 3 to 5 months of age. AJNR Am J Neuroradiol 2014;35:593–98 doi:10.3174/ajnr.A3728 pmid:24091444
    Abstract/FREE Full Text
  23. 23.↵
    1. Dai W,
    2. Garcia D,
    3. de Bazelaire C, et al
    . Continuous flow-driven inversion for arterial spin labeling using pulsed radio frequency and gradient fields. Magn Reson Med 2008;60:1488–97 doi:10.1002/mrm.21790 pmid:19025913
    CrossRefPubMed
  24. 24.↵
    1. Buxton RB,
    2. Frank LR,
    3. Wong EC, et al
    . A general kinetic model for quantitative perfusion imaging with arterial spin labeling. Magn Reson Med 1998;40:383–96 doi:10.1002/mrm.1910400308 pmid:9727941
    CrossRefPubMed
  25. 25.↵
    1. Wells WM 3rd.,
    2. Viola P,
    3. Atsumi H, et al
    . Multi-modal volume registration by maximization of mutual information. Med Image Anal 1996;1:35–51 doi:10.1016/S1361-8415(01)80004-9 pmid:9873920
    CrossRefPubMed
  26. 26.↵
    1. Stejskal EO,
    2. Tanner JE
    . Spin diffusion measurements: spin echoes in the presence of a time-dependent field gradient. J Chem Phys 1965;42:288–92 doi:10.1063/1.1695690
    CrossRef
  27. 27.↵
    1. Mazziotta JC,
    2. Toga AW,
    3. Evans A, et al
    . A probabilistic atlas of the human brain: theory and rationale for its development—the International Consortium for Brain Mapping (ICBM). Neuroimage 1995;2:89–101 doi:10.1006/nimg.1995.1012 pmid:9343592
    CrossRefPubMed
  28. 28.↵
    1. Forkert ND,
    2. Cheng B,
    3. Kemmling A, et al
    . ANTONIA perfusion and stroke: a software tool for the multi-purpose analysis of MR perfusion-weighted datasets and quantitative ischemic stroke assessment. Methods Inf Med 2014;53:469–81 doi:10.3414/ME14-01-0007 pmid:25301390
    CrossRefPubMed
  29. 29.↵
    1. Sakov A,
    2. Golani I,
    3. Lipkind D, et al
    . High-throughput data analysis in behavior genetics. Ann Appl Stat 2010;4:743–63 doi:10.1214/09-AOAS304
    CrossRef
  30. 30.↵
    1. Giedd JN,
    2. Blumenthal J,
    3. Jeffries NO, et al
    . Brain development during childhood and adolescence: a longitudinal MRI study. Nat Neurosci 1999;2:861–63 doi:10.1038/13158 pmid:10491603
    CrossRefPubMed
  31. 31.↵
    1. Matsuzawa J,
    2. Matsui M,
    3. Konishi T, et al
    . Age-related volumetric changes of brain gray and white matter in healthy infants and children. Cereb Cortex 2001;11:335–42 doi:10.1093/cercor/11.4.335 pmid:11278196
    Abstract/FREE Full Text
  32. 32.↵
    1. Choe MS,
    2. Ortiz-Mantilla S,
    3. Makris N, et al
    . Regional infant brain development: an MRI-based morphometric analysis in 3 to 13 month olds. Cereb Cortex 2013;23:2100–17 doi:10.1093/cercor/bhs197 pmid:22772652
    Abstract/FREE Full Text
  33. 33.↵
    1. Dobbing J,
    2. Sands J
    . Quantitative growth and development of human brain. Arch Dis Child 1973;48:757–67 doi:10.1136/adc.48.10.757 pmid:4796010
    Abstract/FREE Full Text
  34. 34.↵
    1. Barkovich AJ,
    2. Kjos BO,
    3. Jackson DE J., et al
    . Normal maturation of the neonatal and infant brain: MR imaging at 1.5 T. Radiology 1988;166:173–80 doi:10.1148/radiology.166.1.3336675 pmid:3336675
    CrossRefPubMed
  35. 35.↵
    1. Autti T,
    2. Raininko R,
    3. Vanhanen SL, et al
    . MRI of the normal brain from early childhood to middle age, II: age dependence of signal intensity changes on T2-weighted images. Neuroradiology 1994;36:649–51 doi:10.1007/BF00600432 pmid:7862288
    CrossRefPubMed
  36. 36.↵
    1. Thomas LO,
    2. Boyko OB,
    3. Anthony DC, et al
    . MR detection of brain iron. AJNR Am J Neuroradiol 1993;14:1043–48 pmid:8237678
    Abstract/FREE Full Text
  37. 37.↵
    1. Mukherjee P,
    2. Miller JH,
    3. Shimony JS, et al
    . Normal brain maturation during childhood: developmental trends characterized with diffusion-tensor MR imaging. Radiology 2001;221:349–58 doi:10.1148/radiol.2212001702 pmid:11687675
    CrossRefPubMed
  38. 38.↵
    1. Pal D,
    2. Trivedi R,
    3. Saksena S, et al
    . Quantification of age- and gender-related changes in diffusion tensor imaging indices in deep grey matter of the normal human brain. J Clin Neurosci 2011;18:193–96 doi:10.1016/j.jocn.2010.05.033 pmid:21183352
    CrossRefPubMed
  39. 39.↵
    1. Raichle ME
    . Behind the scenes of functional brain imaging: a historical and physiological perspective. Proc Natl Acad Sci U S A 1998;95:765–72 doi:10.1073/pnas.95.3.765 pmid:9448239
    Abstract/FREE Full Text
  40. 40.↵
    1. Jueptner M,
    2. Weiller C
    . Review: does measurement of regional cerebral blood flow reflect synaptic activity? Implications for PET and fMRI. Neuroimage 1995;2:148–56 doi:10.1006/nimg.1995.1017 pmid:9343597
    CrossRefPubMed
  41. 41.↵
    1. Sokoloff L
    . Localization of functional activity in the central nervous system by measurement of glucose utilization with radioactive deoxyglucose. J Cereb Blood Flow Metab 1981;1:7–36 doi:10.1038/jcbfm.1981.4 pmid:7035471
    FREE Full Text
  42. 42.↵
    1. Chugani HT,
    2. Phelps ME,
    3. Mazziotta JC
    . Positron emission tomography study of human brain functional development. Ann Neurol 1987;22:487–97 doi:10.1002/ana.410220408 pmid:3501693
    CrossRefPubMed
  43. 43.↵
    1. Petersen ET,
    2. Mouridsen K,
    3. Golay X
    . The QUASAR reproducibility study, part II: results from a multi-center arterial spin labeling test-retest study. Neuroimage 2010;49:104–13 doi:10.1016/j.neuroimage.2009.07.068 pmid:19660557
    CrossRefPubMed
  44. 44.↵
    1. Bokkers RP,
    2. van der Worp HB,
    3. Mali WP, et al
    . Noninvasive MR imaging of cerebral perfusion in patients with a carotid artery stenosis. Neurology 2009;73:869–75 doi:10.1212/WNL.0b013e3181b7840c pmid:19752454
    Abstract/FREE Full Text
  45. 45.↵
    1. Chen Y,
    2. Wang DJ,
    3. Detre JA
    . Test-retest reliability of arterial spin labeling with common labeling strategies. J Magn Reson Imaging 2011;33:940–49 doi:10.1002/jmri.22345 pmid:21448961
    CrossRefPubMed
  46. 46.↵
    1. Alsop DC,
    2. Detre JA,
    3. Golay X, et al
    . Recommended implementation of arterial spin-labeled perfusion MRI for clinical applications: a consensus of the ISMRM perfusion study group and the European consortium for ASL in dementia. Magn Reson Med 2015;73:102–16 doi:10.1002/mrm.25197 pmid:24715426
    CrossRefPubMed
  47. 47.↵
    1. Song XX,
    2. Yu BW
    . Anesthetic effects of propofol in the healthy human brain: functional imaging evidence. J Anesth 2015;29:279–88 doi:10.1007/s00540-014-1889-4 pmid:25056258
    CrossRefPubMed
  48. 48.↵
    1. Venkatraghavan L,
    2. Poublanc J,
    3. Bharadwaj S, et al
    . Noninvasive measurement of cerebral blood flow under anesthesia using arterial spin labeling MRI: a pilot study. J Neurosurg Anesthesiol 2015 Sep 20. [Epub ahead of print] pmid:26397237
  49. 49.↵
    1. Chiron C,
    2. Raynaud C,
    3. Mazière B, et al
    . Changes in regional cerebral blood flow during brain maturation in children and adolescents. J Nucl Med 1992;33:696–703 pmid:1569478
    Abstract/FREE Full Text
  50. 50.↵
    1. Lenroot RK,
    2. Gogtay N,
    3. Greenstein DK, et al
    . Sexual dimorphism of brain developmental trajectories during childhood and adolescence. Neuroimage 2007;36:1065–73 doi:10.1016/j.neuroimage.2007.03.053 pmid:17513132
    CrossRefPubMed
  51. 51.↵
    1. Epstein HT
    . EEG developmental stages. Dev Psychobiol 1980;13:629–31 doi:10.1002/dev.420130608 pmid:7429022
    CrossRefPubMed
  52. 52.↵
    1. Hudspeth WJ,
    2. Pribram KH
    . Stages of brain and cognitive maturation. J Educ Psychol 1990;82:881–84 doi:10.1037/0022-0663.82.4.881
    CrossRef
  53. 53.↵
    1. Epstein HT
    . Stages of increased cerebral blood flow accompany stages of rapid brain growth. Brain Dev 1999;21:535–39 doi:10.1016/S0387-7604(99)00066-2 pmid:10598054
    CrossRefPubMed
  54. 54.↵
    1. Rowan RA,
    2. Maxwell DS
    . Patterns of vascular sprouting in the postnatal development of the cerebral cortex of the rat. Am J Anat 1981;160:247–55 doi:10.1002/aja.1001600303 pmid:6164286
    CrossRefPubMed
  55. 55.↵
    1. Fonov V,
    2. Evans AC,
    3. Botteron K, et al
    ; Brain Development Cooperative Group. Unbiased average age-appropriate atlases for pediatric studies. Neuroimage 2011;54:313–27 doi:10.1016/j.neuroimage.2010.07.033 pmid:20656036
    CrossRefPubMed
  • Received December 10, 2015.
  • Accepted after revision February 8, 2016.
  • © 2016 by American Journal of Neuroradiology
View Abstract
PreviousNext
Back to top

In this issue

American Journal of Neuroradiology: 37 (9)
American Journal of Neuroradiology
Vol. 37, Issue 9
1 Sep 2016
  • Table of Contents
  • Index by author
  • Complete Issue (PDF)
Advertisement
Print
Download PDF
Email Article

Thank you for your interest in spreading the word on American Journal of Neuroradiology.

NOTE: We only request your email address so that the person you are recommending the page to knows that you wanted them to see it, and that it is not junk mail. We do not capture any email address.

Enter multiple addresses on separate lines or separate them with commas.
Gray Matter Growth Is Accompanied by Increasing Blood Flow and Decreasing Apparent Diffusion Coefficient during Childhood
(Your Name) has sent you a message from American Journal of Neuroradiology
(Your Name) thought you would like to see the American Journal of Neuroradiology web site.
CAPTCHA
This question is for testing whether or not you are a human visitor and to prevent automated spam submissions.
Cite this article
N.D. Forkert, M.D. Li, R.M. Lober, K.W. Yeom
Gray Matter Growth Is Accompanied by Increasing Blood Flow and Decreasing Apparent Diffusion Coefficient during Childhood
American Journal of Neuroradiology Sep 2016, 37 (9) 1738-1744; DOI: 10.3174/ajnr.A4772

Citation Manager Formats

  • BibTeX
  • Bookends
  • EasyBib
  • EndNote (tagged)
  • EndNote 8 (xml)
  • Medlars
  • Mendeley
  • Papers
  • RefWorks Tagged
  • Ref Manager
  • RIS
  • Zotero
0 Responses
Respond to this article
Share
Bookmark this article
Gray Matter Growth Is Accompanied by Increasing Blood Flow and Decreasing Apparent Diffusion Coefficient during Childhood
N.D. Forkert, M.D. Li, R.M. Lober, K.W. Yeom
American Journal of Neuroradiology Sep 2016, 37 (9) 1738-1744; DOI: 10.3174/ajnr.A4772
del.icio.us logo Twitter logo Facebook logo Mendeley logo
  • Tweet Widget
  • Facebook Like
  • Google Plus One
Purchase

Jump to section

  • Article
    • Abstract
    • ABBREVIATION:
    • Materials and Methods
    • Results
    • Discussion
    • Conclusions
    • Acknowledgments
    • Footnotes
    • References
  • Figures & Data
  • Supplemental
  • Info & Metrics
  • Responses
  • References
  • PDF

Related Articles

  • PubMed
  • Google Scholar

Cited By...

  • Brain Diffusion Abnormalities in Children with Tension-Type and Migraine-Type Headaches
  • Crossref (22)
  • Google Scholar

This article has been cited by the following articles in journals that are participating in Crossref Cited-by Linking.

  • Association of Pediatric Acute-Onset Neuropsychiatric Syndrome With Microstructural Differences in Brain Regions Detected via Diffusion-Weighted Magnetic Resonance Imaging
    Jimmy Zheng, Jennifer Frankovich, Emily S. McKenna, Nathan C. Rowe, Sarah J. MacEachern, Nathan N. Ng, Lydia T. Tam, Peter K. Moon, Jaynelle Gao, Margo Thienemann, Nils D. Forkert, Kristen W. Yeom
    JAMA Network Open 2020 3 5
  • Development of sex differences in the human brain
    Florian Kurth, Christian Gaser, Eileen Luders
    Cognitive Neuroscience 2021 12 3-4
  • Artificial intelligence for automatic cerebral ventricle segmentation and volume calculation: a clinical tool for the evaluation of pediatric hydrocephalus
    Jennifer L. Quon, Michelle Han, Lily H. Kim, Mary Ellen Koran, Leo C. Chen, Edward H. Lee, Jason Wright, Vijay Ramaswamy, Robert M. Lober, Michael D. Taylor, Gerald A. Grant, Samuel H. Cheshier, John R. W. Kestle, Michael S. B. Edwards, Kristen W. Yeom
    Journal of Neurosurgery: Pediatrics 2021 27 2
  • Brain Perfusion and Diffusion Abnormalities in Children Treated for Posterior Fossa Brain Tumors
    Matthew D. Li, Nils D. Forkert, Palak Kundu, Cheryl Ambler, Robert M. Lober, Terry C. Burns, Patrick D. Barnes, Iris C. Gibbs, Gerald A. Grant, Paul G. Fisher, Samuel H. Cheshier, Cynthia J. Campen, Michelle Monje, Kristen W. Yeom
    The Journal of Pediatrics 2017 185
  • Children with epilepsy demonstrate macro- and microstructural changes in the thalamus, putamen, and amygdala
    Sarah J. MacEachern, Jonathan D. Santoro, Kara J. Hahn, Zachary A. Medress, Ximena Stecher, Matthew D. Li, Jin S. Hahn, Kristen W. Yeom, Nils D. Forkert
    Neuroradiology 2020 62 3
  • Spatial coefficient of variation applied to arterial spin labeling MRI may contribute to predict surgical revascularization outcomes in pediatric moyamoya vasculopathy
    Domenico Tortora, Camilla Scavetta, Giacomo Rebella, Marta Bertamino, Marcello Scala, Thea Giacomini, Giovanni Morana, Marco Pavanello, Andrea Rossi, Mariasavina Severino
    Neuroradiology 2020 62 8
  • Arterial Spin Labeling for Pediatric Central Nervous System Diseases: Techniques and Clinical Applications
    Mika Kitajima, Hiroyuki Uetani
    Magnetic Resonance in Medical Sciences 2023 22 1
  • Brain Diffusion Abnormalities in Children with Tension-Type and Migraine-Type Headaches
    J.D. Santoro, N.D. Forkert, Q.-Z. Yang, S. Pavitt, S.J. MacEachern, M.E. Moseley, K.W. Yeom
    American Journal of Neuroradiology 2018 39 5
  • Microstructural Integrity of the Hippocampus During Childhood: Relations With Age and Source Memory
    Daniel D. Callow, Kelsey L. Canada, Tracy Riggins
    Frontiers in Psychology 2020 11
  • Cerebral volume and diffusion MRI changes in children with sensorineural hearing loss
    Peter K. Moon, Jason Z. Qian, Emily McKenna, Kevin Xi, Nathan C. Rowe, Nathan N. Ng, Jimmy Zheng, Lydia T. Tam, Sarah J. MacEachern, Iram Ahmad, Alan G. Cheng, Nils D. Forkert, Kristen W. Yeom
    NeuroImage: Clinical 2020 27

More in this TOC Section

  • SyMRI & MR Fingerprinting in Brainstem Myelination
  • Comparison of Image Quality and Radiation Dose in Pediatric Temporal Bone CT Using Photon-Counting Detector CT and Energy-Integrating Detector CT
  • Neonatal Hypocalcemia: Cerebral MRI Abnormalities
Show more Pediatrics

Similar Articles

Advertisement

Indexed Content

  • Current Issue
  • Accepted Manuscripts
  • Article Preview
  • Past Issues
  • Editorials
  • Editor's Choice
  • Fellows' Journal Club
  • Letters to the Editor
  • Video Articles

Cases

  • Case Collection
  • Archive - Case of the Week
  • Archive - Case of the Month
  • Archive - Classic Case

Special Collections

  • AJNR Awards
  • ASNR Foundation Special Collection
  • Most Impactful AJNR Articles
  • Photon-Counting CT
  • Spinal CSF Leak Articles (Jan 2020-June 2024)

More from AJNR

  • Trainee Corner
  • Imaging Protocols
  • MRI Safety Corner

Multimedia

  • AJNR Podcasts
  • AJNR Scantastics

Resources

  • Turnaround Time
  • Submit a Manuscript
  • Submit a Video Article
  • Submit an eLetter to the Editor/Response
  • Manuscript Submission Guidelines
  • Statistical Tips
  • Fast Publishing of Accepted Manuscripts
  • Graphical Abstract Preparation
  • Imaging Protocol Submission
  • Evidence-Based Medicine Level Guide
  • Publishing Checklists
  • Author Policies
  • Become a Reviewer/Academy of Reviewers
  • News and Updates

About Us

  • About AJNR
  • Editorial Board
  • Editorial Board Alumni
  • Alerts
  • Permissions
  • Not an AJNR Subscriber? Join Now
  • Advertise with Us
  • Librarian Resources
  • Feedback
  • Terms and Conditions
  • AJNR Editorial Board Alumni

American Society of Neuroradiology

  • Not an ASNR Member? Join Now

© 2025 by the American Society of Neuroradiology All rights, including for text and data mining, AI training, and similar technologies, are reserved.
Print ISSN: 0195-6108 Online ISSN: 1936-959X

Powered by HighWire