
Abstract
SUMMARY: Our aim was to prospectively evaluate the relationship between low back pain–related disability and quantitative measures from [18F]-sodium fluoride ([18F]-NaF) MR imaging. Six patients with facetogenic low back pain underwent dynamic [18F]-NaF PET/MR imaging. PET metrics were correlated with clinical measures and MR imaging grading of lumbar facet arthropathy. A significant positive correlation was observed between maximum facet joint uptake rate and clinical disability (P < .05). These data suggest that dynamic [18F]-NaF PET may serve as a useful biomarker for facetogenic disability.
ABBREVIATIONS:
- FJ
- facet joint
- IPAQ
- International Physical Activity Questionnaire
- max
- maximum
- min
- minimum
- mL/ccm/min
- milliliters/cubic centimeter/minute
- ODI
- Oswestry Disability Index
- SUV
- standard uptake value
Clinical assessment for facetogenic low back pain is often hampered by overlapping and nonspecific symptoms and physical examination findings.1 Conventional imaging techniques limited to evaluation of structural changes in the spine may identify morphologic abnormalities in asymptomatic spinal structures that are indistinguishable from degenerative structural alterations that produce severe pain and disability.2 Objective and quantitative biomarkers that are more specific for active generators of low back pain would greatly aid in the effective, targeted treatment of patients with low back pain.
[18F]-sodium fluoride ([18F]-NaF) is a positron-emission tomography radiotracer, which is chemically absorbed into hydroxyapatite in the bone matrix by osteoblasts and can noninvasively detect osteoblastic activity. [18F]-NaF has been increasingly used for evaluating bone diseases, particularly for identification of bone metastases and primary tumors.3⇓–5 The utility of [18F]-NaF PET for evaluating degenerative disease of the lumbar spine remains largely unexplored.6
The goal of this prospective pilot study was to examine the potential correlation between facetogenic low back pain measures of disability with quantitative and semiquantitative [18F]-NaF PET/MR imaging measures of bone turnover and structural MR imaging changes in lumbar facet joints.
Materials and Methods
Patient Population
This prospective feasibility study recruited patients after obtaining human study institutional review board approval and complying with Health Insurance Portability and Accountability Act regulations. Patients served as internal controls with diseased and healthy subregions. Patients with a history of suspected lower lumbar facetogenic syndrome were recruited from UCSF Radiology Spine Clinic. Written informed consent was acquired before entry into the study. The study began in November 2014 and concluded in August 2015.
Inclusion and Exclusion Criteria
Inclusion criteria were as follows: 1) at least 18 years of age with the capacity for informed consent, 2) a reported history of axial nonradicular low back pain, and 3) recommended by the spine interventional radiologists. Exclusion criteria were as follows: 1) a history of fracture or tumor of the spine, including osteoblastic metastases, 2) women who were pregnant or breastfeeding, 3) contraindications to MR imaging or administration of tracer or contrast, and 4) prior lumbar surgery or instrumentation.
Immediately before PET/MR imaging, subjects completed questionnaires measuring pain (numeric rating scale, from 0 to 10 with 0 equal to no pain and 10, the most severe intensity of pain), quality of life (Oswestry Disability Index Low Back Pain Disability Questionnaire [ODI]), and activity (International Physical Activity Questionnaire [IPAQ]).7,8
PET/MR Protocol and Image Review
A 3T Signa PET/MR imaging scanner (GE Healthcare, Milwaukee, Wisconsin) was used for a simultaneous PET and MR image acquisition. Dynamic PET was initiated as 0.08 mCi/Kg of [18F]-NaF (mean dose, 4.6 ± 0.8 mCi) injected intravenously.
Acquisition Parameters
Clinical MR imaging sequences included the following: sagittal T1 (TR/TE = 510/8.6 ms), sagittal T2 fat-saturated (TR/TE = 4208/86.2 ms), axial T2 fast recovery fast spin-echo with and without fat saturation (TR/TE = 750/9.2 ms), axial T1 fast spin-echo (TR/TE = 575/8.9 ms), and axial T1 fast spin-echo postgadolinium (TR/TE = 562/8.6 ms) imaging. The MR imaging attenuation correction for the lumbar spine region was calculated with the accepted standard 2-point Dixon method.9 Sixty minutes of dynamic PET data were acquired across 3 temporal phases (phase 1 = 12 frames of 10 seconds each, phase 2 = 4 frames of 30 seconds each, phase 3 = 14 frames of 4 minutes each). PET reconstruction included postprocessing to correct for decay, attenuation, scatter, and dead time.
MR Imaging Facet Joint Grading
Two board-certified neuroradiologists with 3 (J.F.T.) and >30 (W.P.D.) years' postfellowship experience were blinded to the clinical data and interpreted clinical MR imaging sequences on a reprocessing workstation. Facet synovitis was graded as previously described by Czervionke and Fenton (On-line Fig 1).10
Data Analysis
Quantitative and semiquantitative PET analysis included all facet joints from the L1–L2 to L5–S1 levels. Volumes of interest were selected using anatomic T2 MR images. A spheric VOI (7.5-mm diameter) was constructed around the center of each facet joint. A 5-mm-diameter VOI was placed in the right iliac crest in the central marrow cavity as a reference region. All PET analysis was performed with PMOD licensed software (PMOD Technologies, Zurich, Switzerland). This software facilitates model-based analysis of dynamic PET data. PMOD allows only validated kinetic models that have been extensively studied, and the output of the results is highly reproducible.
Standard Uptake Value Calculations and Kinetic Data
Placement of facet joint (FJ) VOIs is shown in On-line Fig 2A. A cylindric VOI covering 2 axial sections was placed on the abdominal aorta, and the partial volume correction coefficient was calculated. Maximum standard uptake value (SUVmax) and SUVmean values (Equation 1) for each subsite were calculated using the 60-minute time point.
The 3-compartment model used for kinetic modeling is shown in On-line Fig 2B. In Equation 2, Ci represents the bone tissue activity concentration and is the sum of Ce (extravascular compartment) and Ct (target tissue bound compartment); Cp is the concentration of tracer in the blood; V is the effective distribution volume of the tracer.11 A 3-compartment irreversible linear model was used for the Patlak linear model.11 The 2-tissue irreversible compartment model was used to calculate the region-specific influx rate constants (in minute−1) for [18F]-NaF.12 Uptake was normalized by using the iliac crest as the reference region. The tracer influx rate from the blood pool to the bone matrix was calculated with Equation 2 for Ki_Patlak. Ki_Patlak represents the rate at which [18F]-NaF leaves the arterial blood pool and irreversibly binds to a subsite bone matrix. The kinetic analysis was performed by using PMOD. For each subject, FJs with maximum uptake were identified, henceforth referred to as FJmax.
Equation 2 is the Patlak graphical kinetic model:
Statistical Analyses
The statistical significance of the correlations between PET/MR imaging and clinical disability metrics was tested with the Pearson correlation. A 2-samples t test was used (P < .05) to assess the significance of differences in the Ki_Patlak influx rate between the mean FJmax and mean FJminimum (min) Ki_Patlak and among FJ MR imaging grades.
Results
Patient Profile
Patient demographic and clinical disability scores are summarized in the Table.
Profile of patients with facetogenic low back pain
[18F]-NaF Uptake Measurements and MR Imaging Grading
Uptake values were measured in bilateral facet joints across 5 levels in all subjects for a total of 60 measurements. For all 60 sampled regions, the relationship between semiquantitative SUVmax and Ki_Patlak produced a linear correlation (r = 0.58, P < .001; On-line Fig 3A). A similar statistically significant linear correlation was observed between Ki_Patlak and SUVmean (r = 0.7, P < .001; On-line Fig 3B).
For each patient, the single facet joint with the highest Ki_Patlak (FJmax Ki_Patlak) was identified. When FJmax Ki_Patlak was plotted against the ODI score, a strong, statistically significant positive correlation was observed (r = 0.96, P = .0013; Fig 1).

Maximum Ki_Patlak significantly correlates with clinical disability as measured by the Oswestry Disability Index. Facet joints with maximum Ki_Patlak (FJmax Ki_Patlak) plotted against the corresponding patient ODI scores reveal a strong, statistically significant linear correlation (r = 0.96, P = .0013).
The FJ SUVmax and SUVmean for each subject (n = 6) were plotted against the ODI score, and no significant correlations were observed (r = −0.55, P = .35, and r = −0.47, P = .35). The correlation between the maximum MR imaging grade and ODI (n = 6) was not significant (r = 0.38, P = .44). FJmax Ki_Patlak plotted against corresponding patient maximum pain scores showed no correlation (r = 0.06, P = .91). FJmax Ki_Patlak plotted against corresponding patient IPAQ categoric scores showed no correlation (r = 0.15, P = .77).
A weak-to-moderate, but statistically significant, correlation was observed between the MR imaging grade of facet arthropathy and Ki_Patlak (r = 0.37, P = .03; Fig 2A). The average uptake rate as measured by Ki_Patlak for FJmin (0.019 milliliter/cubic centimeter/min [mL/ccm/min]) and FJmax (0.032 mL/ccm/min) showed that FJmax was significantly higher with close to twice the uptake rate (P < .001).
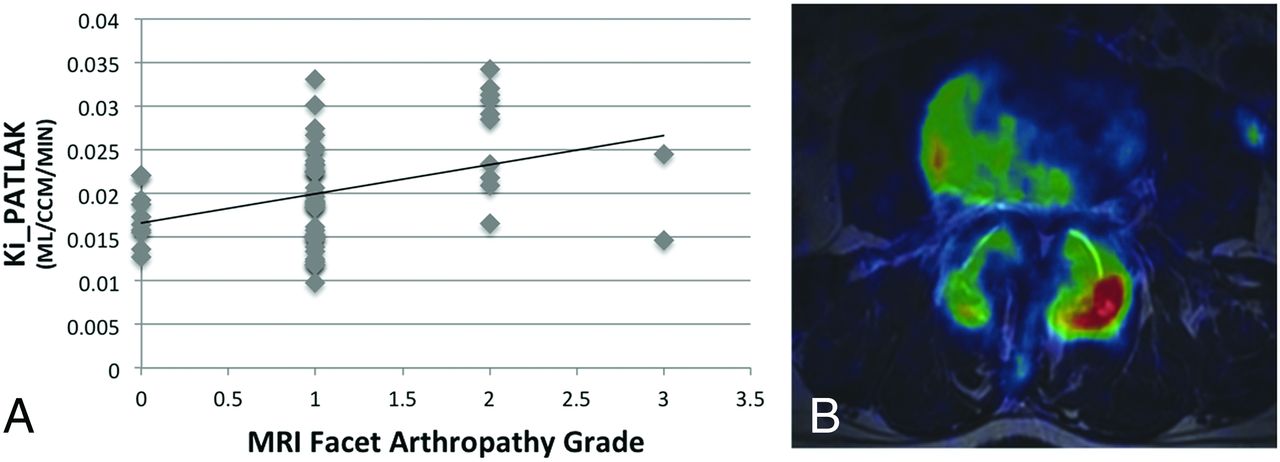
[18F]-NaF PET uptake and MR imaging arthropathy grade are weakly correlated. A, [18F]-NaF uptake (Ki_Patlak) plotted against the facet arthropathy grade on MR imaging shows a weak-to-moderate but statistically significant (r = 0.37, P = .03) correlation. B, Sample PET/MR imaging–fused axial image at the L3–L4 level in a 61-year-old man with suspected facetogenic pain shows differential FJ uptake with noticeably higher uptake on the left. On MR imaging, both facets were grade 2 facet synovitis.
Discussion
In this prospective pilot study of patients with suspected facetogenic low back pain, we show a strong positive linear correlation between a kinetic measure of dynamic NaF uptake by the FJ with maximum uptake (FJmax Ki_Patlak) and disability as measured with ODI. These data suggest that FJmax Ki_Patlak may be a useful metric for quantifying and localizing lumbar facetogenic–related disability. Thus, [18F]-NaF PET may aid in treatment planning and longitudinal monitoring of degenerative lumbar facet disease. With our small sample size of 6 subjects with relatively mild disability and the lack of a healthy control cohort, these data are preliminary. However, our observed strong correlation between [18F]-NaF uptake as measured with FJmax Ki_Patlak and clinical disability, even in this small cohort of patients with facet syndrome, is reassuring that FJmax Ki_Patlak may serve as a useful biomarker for facet joint–related disability. Further larger scale studies are warranted to validate these preliminary data, and a cost-benefit analysis will need to be performed. Most important, our average measurement for FJmax Ki_Patlak across all subjects (0.32 ± 0.003, n = 6) is like that of Brenner et al13 in areas of high bone turnover, including bone grafts, supporting the validity of our quantitative PET measurements.
Neither SUVmax nor SUVmean showed a statistically significant correlation with the ODI score or any other clinical measure of low back pain and disability. While larger studies are needed to confirm this result, the primary finding of this study is that the kinetic variable Ki_Patlak may be useful for evaluating facetogenic pathology by providing a quantitative value that more accurately reflects the dynamic process of bone turnover and osteoblastic activity. SUV values assume that radiotracer is evenly distributed throughout the entire body and base the measurement off a lean body mass coefficient. Ki_Patlak measures specific concentrations of radiotracer reaching the target via the arterial system during the scan. This added information may reveal subtle changes in the flow of the tracer to ROIs that would otherwise be missed.
It is also of interest that a weak, but statistically significant, correlation was observed between the MR imaging morphologic grade of facet arthropathy and quantitative PET measures or ODI. This finding is consistent with a previous study in which a similarly weak correlation was found between NaF-PET uptake and CT measures of facet arthropathy, further supporting the hypothesis that physiologic information afforded by NaF uptake may supplement conventional structural imaging for identifying symptomatic facet joints.6
As a pilot study, the small number of patients and relatively mild disability represent a primary limitation of this study. Despite this limitation, the observed strong and statistically significant correlation between FJmax Ki_Patlak and ODI in this small, inclusive cohort suggests that [18F]-NaF may serve as a robust biomarker for facet syndrome, and future larger studies are warranted to confirm these data. Also, we provide only correlative evidence that FJmax Ki_Patlak and clinical disability are related. Future studies involving targeted facet joint injections based on dynamic PET/MR imaging data are planned and will be needed to validate the present results.
Conclusions
In the lumbar spine, [18F]-NaF uptake rates in facet joints as measured with Ki_Patlak strongly correlate with patient-reported ODI scores. These pilot data suggest that kinetic measurements of [18F]-NaF facet joint uptake may serve as sensitive, quantitative, and noninvasive biomarkers of facetogenic low back pain.
Acknowledgments
We would like to acknowledge the support by Vahid Ravanfar, Emily Verdin, and Stephanie Murphy.
Footnotes
Disclosures: Nathaniel W. Jenkins—RELATED: Grant: National Institutes of Health, Comments: National Institutes of Health P50AR060752*; Other: GE Healthcare, Comments: PET/MR imaging research support grant.* Jason F. Talbott—UNRELATED:Consultancy: StemCells Inc, Comments: member of data-monitoring committee; Expert Testimony: Tindall Bennett and Shoup, Comments: expert witness. Sharmila Majumdar—RELATED: Grant: GE Healthcare*; UNRELATED: Grants/Grants Pending: GE Healthcare.* *Money paid to the institution.
Research support was provided by National Institutes of Health P50AR060752 and GE Healthcare.
Indicates open access to non-subscribers at www.ajnr.org
References
- Received April 20, 2017.
- Accepted after revision June 6, 2017.
- © 2017 by American Journal of Neuroradiology


Jump to section
Related Articles
Cited By...
- No citing articles found.