
Abstract
BACKGROUND AND PURPOSE: Preprocedural identification of the Adamkiewicz artery is crucial in patients with aortic diseases. This study aimed to compare 70-kV CTA with conventional 120-kV CTA for the identification of the Adamkiewicz artery, examining differences in radiation dose and image quality.
MATERIALS AND METHODS: We retrospectively analyzed 2 equal groups of 60 patients who had undergone 70-kV or 120-kV CTA to detect the Adamkiewicz artery before aortic repair. Size-specific dose estimate, the CT number of the aorta, and the contrast-to-noise ratio of the anterior spinal artery to the spinal cord were recorded. Furthermore, detectability of the Adamkiewicz artery was evaluated by using a 4-point continuity score (3, definite to 0, undetectable).
RESULTS: There was significantly lower radiation exposure with 70-kV CTA than 120-kV CTA (median size-specific dose estimate, 23.1 versus 61.3 mGy, respectively; P < .001). CT number and contrast-to-noise ratio were both significantly higher in the 70-kV CTA group than the 120-kV group (999.1 HU compared with 508.7 HU, and 5.6 compared with 3.4, respectively; P < .001 for both). Detectability of the Adamkiewicz artery was not impaired in the 70-kV CTA group (90.0% versus 83.3% in the 120-kV group, P = .28). Moreover, the Adamkiewicz artery was detected with greater confidence with 70-kV CTA, reflected by a significantly superior continuity score (median, 3) compared with 120-kV CTA (median, 2; P = .001).
CONCLUSIONS: Seventy-kilovolt CTA has substantial advantages for the identification of the Adamkiewicz artery before aortic repair, with a significantly lower radiation exposure and superior image quality than 120-kV CTA.
ABBREVIATIONS:
- AKA
- Adamkiewicz artery
- ASA
- anterior spinal artery
- CSA
- critical segmental artery
- CNR
- contrast-to-noise ratio
- CTDIvol
- volume CT dose index
- IQR
- interquartile range
- SSDE
- size-specific dose estimate
Spinal cord ischemia is a serious complication of surgical and endovascular stent-graft repair of thoracic or thoracoabdominal aortic aneurysms and aortic dissection.1 Preservation of spinal cord blood supply, especially from the Adamkiewicz artery (AKA) and its tributary the critical segmental artery (CSA) during the procedure is mandatory to prevent neurologic complications.2,3 Thus, accurate preprocedural knowledge of the anatomy of the AKA and CSA is crucial, particularly in surgical repair.4
Recently, CTA has been used for noninvasive identification of the AKA5,6 in place of invasive selective spinal angiography. However, the anatomic features of the AKA—a small vessel surrounded by osseous structures—may frequently be obscured in the contrast-to-noise ratio (CNR) of the spinal vasculature.7 A higher contrast-to-noise ratio in spinal CTA has previously been achieved with a high tube current–time product with a slow rotation speed and a small helical pitch to reduce image noise,8 and CTA with intra-arterial injection has been used to increase the contrast of the vessel.7,9,10 Consequently, the detection rate of the AKA has been improved to 85%–100%7,8,10⇓–12; however, these techniques require either high radiation exposure or the insertion of a pigtail catheter into the pathologic aorta.8
Seventy-kilovolt CT can substantially increase vascular iodine enhancement compared with conventional 120-kV imaging because the effective photon energy achieved with a 70-kV scan lies in the range of maximum absorption close to the K-edge of iodine (33.2 keV).13,14 The mean CT number in the aorta with 70-kV CTA is reported to be approximately 700 HU, even with intravenous injection,14 which approaches the attenuation in the aorta with intra-arterial injection in 120-kV imaging.7 Moreover, radiation exposure is significantly reduced with lower voltage scanning.14⇓–16 We hypothesized that 70-kV CTA would be associated with superior AKA visualization, with high vessel attenuation and lower radiation exposure. The aim of this study was to compare 70-kV CTA with conventional 120-kV imaging for the identification of the AKA and the CSA regarding the radiation dose and qualitative and quantitative image quality.
Materials and Methods
Ethics
Our institutional review board of Kobe University Hospital approved this retrospective study; the requirement for written, informed consent was waived because of its design. All patient records and information were anonymized before analysis.
Study Population
A total of 185 consecutive subjects who underwent CTA to detect the AKA between January 2014 and September 2016 were enrolled in this study. Subjects who had a history of aortic repair, spinal arteriovenous fistula, or vertebral or spinal tumor were excluded. Ultimately, we included 120 patients (median age, 69 years; range, 28–85 years; 25.8% women) who underwent CTA to detect the AKA before aortic repair. Because we changed scan mode in January 2015 when a new CT scanner was installed, CTA was performed with a 120-kV scanner in the first 60 subjects and a 70-kV scanner in next 60 subjects.
Data Acquisition
Seventy-kilovolt CTA was performed on a 192-section dual-source CT scanner (Somatom Force; Siemens, Erlangen, Germany). Dual-power scan mode was applied with the following parameters: 128 × 0.6 mm detector configuration, 0.5 seconds per rotation, 0.45 pitch, 1170-mA tube current, and 1300-mAs effective tube current–time product. In dual-power scan mode, the total radiation is divided equally between each x-ray tube, and the data from each detector are summed.17 Thus, the maximum photon flux is expected to double, and because of the reduction in load on the x-ray tube, we achieved high tube current with a long scan range. One hundred twenty-kilovolt CTA was performed on a 64- or a 320-section multidetector CT scanner (Aquilion 64 or Aquilion ONE; Toshiba Medical Systems, Tokyo, Japan). The scanning parameters used were like those in previous reports8,12,18 and were as follows: 64-section helical scan mode, 64 × 0.5 mm detector configuration, 0.5 seconds per rotation, 0.64 pitch, 400-mA tube current, and 312.5-mAs effective tube current–time product. The scan range extended from the thoracic inlet to the lesser trochanter of the hip.
Injection Protocol and Scan Timing
Iopamidol 370 mg I/mL (Iopamiron 370; Bayer Yakuhin, Osaka, Japan) was administered through a 20-ga intravenous catheter placed in the right antecubital vein at 5 mL/s, followed by a 30-mL physiologic saline flush at the same rate using a dual-head power injector (Dual Shot GX 7; Nemoto Kyorindo, Tokyo, Japan). Scan timing was set as the peak timing in the true lumen of the descending aorta, which was determined by the timing-bolus method in 70-kV CTA, and by the bolus-tracking method in 120-kV CTA. This technical limitation meant that the ROI could not be moved simultaneously during acquisition of the time-intensity curve in the ROI in the 192-section dual-source CT scanner. For the timing-bolus method, 10 mL of contrast material followed by a 20-mL physiologic saline flush was injected at 5 mL/s, respectively. Timing-bolus scanning was started 10 seconds after the start of injection. The peak time of the CT number in the ROI placed in the true lumen of the descending aorta at the level of the tenth thoracic vertebra was obtained with console software (DynEva, syngo VA50A; Siemens). The 70-kV scan was then started 10 seconds after the peak time. In the bolus-tracking method, the ROI was placed in the descending aorta at the level of the sixth thoracic vertebra, and the trigger threshold was set at 200 HU. The 120-kV scan was automatically started 5 seconds after the trigger. The volume of contrast material used for CTA in the 70- and 120-kV scans was 90 and 100 mL, respectively. The scans were repeated to obtain images in the early and late arterial phases. The scan of the late arterial phase was obtained approximately 10 seconds after the end of the first phase, to evaluate the washout of contrast material in the vessels to distinguish the AKA from the similar hairpin-shaped radiculomedullary vein,7 because vessels that are more prominent in the late phase are likely to be veins.
Image Reconstruction
Seventy-kilovolt CTA image data were reconstructed in the axial plane with 0.6-mm thickness, 0.6-mm interval, 200-mm FOV, and a vascular convolution kernel (Bv44) with Advanced Modeled Iterative Reconstruction (Siemens) with strength level 3. One hundred twenty-kilovolt CTA image data were reconstructed in the axial plane with 0.5-mm thickness, 0.5-mm reconstruction interval, and 200-mm FOV using a soft-tissue convolution kernel (FC13) with the filter back-projection method. The assignable values of both protocols were set as the parameters of reconstruction. Image data were then transferred to a workstation (Ziostation 2, Version 2.4.2.3; Ziosoft, Tokyo, Japan) for further processing and analysis. Curved coronal multiplanar reformatted images (1.0-mm thickness at 1.0-mm intervals) fitted to the curvature of the spinal cord in the early and late arterial phases were obtained.19
Radiation Dose Metrics
The volume CT dose index (CTDIvol) and the dose-length product reported by the scanner after imaging of a 32-cm phantom were recorded. The size-specific dose estimate (SSDE) was calculated by multiplying the CTDIvol by a conversion factor based on the effective diameter,20 which was measured using the lateral diameter of the upper abdomen on the standard posterior-anterior CT radiograph.
Qualitative Image Analysis
To assess performance for identifying the AKA, we initially evaluated the image datasets with the 2 scan modes in a consensus reading by 2 board-certified diagnostic radiologists (T.N. with 10 years of experience and A.K.K. with 15 years of experience), who were unaware of the identity of subjects and CTA protocols. The AKA was identified with a stepwise approach and a 6-point scoring system (Fig 1), modified from a previously published report.8 First, we sought the “hairpin vessel” and assessed it as detectable or undetectable (score 1 or 0, respectively). Second, we assessed continuity to the aorta as definite, conceivable, equivocal, or undetectable (score 3, 2, 1, or 0, respectively). We carefully evaluated the presence of the collateral pathway from the aorta. Third, we evaluated the washout of the attenuation of the vessel from the early-to-late arterial phase (score 1 or 0). Finally, we summed the scores and defined positive identification of the vessel as the AKA when the total score was ≥3. Furthermore, the artery connecting the aorta to the AKA was defined as the CSA. The origin level and the side of the AKA and the CSA were recorded.

The AKA was identified according to the following stepwise approach: 1) detect the hairpin vessel; 2) assess the continuity of the vessel to the aorta mainly around the pedicle of the vertebral arch (white arrows) as definite (a), conceivable (b), equivocal (c), or undetectable; 3) check the washout from the early-to-late arterial phase (white arrowhead), because vessels that are more prominent in the late arterial phase are likely to be veins (black arrowhead); and 4) sum the scores. We defined positive identification of the AKA as a total score of ≥3.
The results of the consensus image interpretation by 2 board-certified diagnostic radiologists were determined to be the reference standard for following analyses. To assess the reproducibility of CSA identification in both imaging protocols, 2 radiologists who were unaware of the identity of subjects and CTA protocols evaluated images independently (observer A, T.N., ≥2 months after the first consensus reading, which was judged to be acceptable to minimize the influence of the first review; observer B, S.S., with 6 years of experience).
Quantitative Image Analysis
For the quantitative image analyses, a cardiovascular radiologist (S.S., observer B) unaware of the scan protocols evaluated the following measurements: Mean CT number and SD of the aorta were calculated from the measurement with the circular ROIs placed at the fifth, eighth, and twelfth thoracic vertebrae and the third lumbar vertebra.18 The ROIs were drawn to include as much vessel lumina as possible, while avoiding areas of artifacts and calcification. Furthermore, for subjects in whom the AKA had been identified with the previous consensus reading, we performed the following measurement: Because it was difficult to measure the CT number of the AKA accurately due to its small diameter and tortuous route, the CT number of the anterior spinal artery (ASA) was used as an indicator.21 The mean CT number of the ASA was obtained from the mean of the measured CT number on a sagittal and a coronal multiplanar reformation adjusted to the ASA course along the length of 1 vertebral body (Fig 2). Furthermore, the mean CT number and SD of the spinal cord were calculated from measurements at 3 positions in the spinal cord in the axial plane (top, middle, and bottom level of the previously set ROI for the ASA, Fig 2). The mean CT number of the bone cortex of the vertebral body was calculated from the measurement of the cortex around the right and left intervertebral foramina at the AKA running level (Fig 2). The SNR and CNRs were calculated with the following equations:


The ROIs placed for measuring CT numbers are shown in a coronal image of the ASA (A), a sagittal image of the ASA (B), an axial image of the spinal cord (C), and a sagittal image of the vertebral bone cortex around the vertebral foramen at the AKA (white arrow) running level (D).
Statistical Analysis
Continuous variables are expressed as the mean ± SD or median and interquartile range (IQR). Categoric variables are expressed as proportions. To evaluate differences between 70- and 120-kV CTA, we used the Welch t test for body mass index, mean CT number of the aorta, SNRAorta, mean CT number of the ASA, SD of the spinal cord, CNRASA-Cord, and CNRASA-Bone. The Wilcoxon test was used to compare age, CTDIvol, SSDE, and dose-length product. The χ2 test was used to evaluate differences in AKA detection rates, CSA location, presence of the collateral pathway, aortic disease (aneurysm versus dissection), and sex. The Cochran-Armitage test was used to evaluate differences between the scores.
Diagnostic accuracy and the Cohen κ for agreement were evaluated by comparing the side and level of the CSA interpreted by 2 independent observers against the reference standard. We also assessed the effect of the presence of the collateral pathway to the AKA on diagnostic accuracy.
For statistical analysis, commercially available (JMP 13.0; SAS Institute, Cary, North Carolina) and open-source (R statistical and computing software; http://www.r-project.org/) programs were used. For all analyses, P < .05 indicated statistical significance.
Results
Subject Characteristics and Radiation Metrics
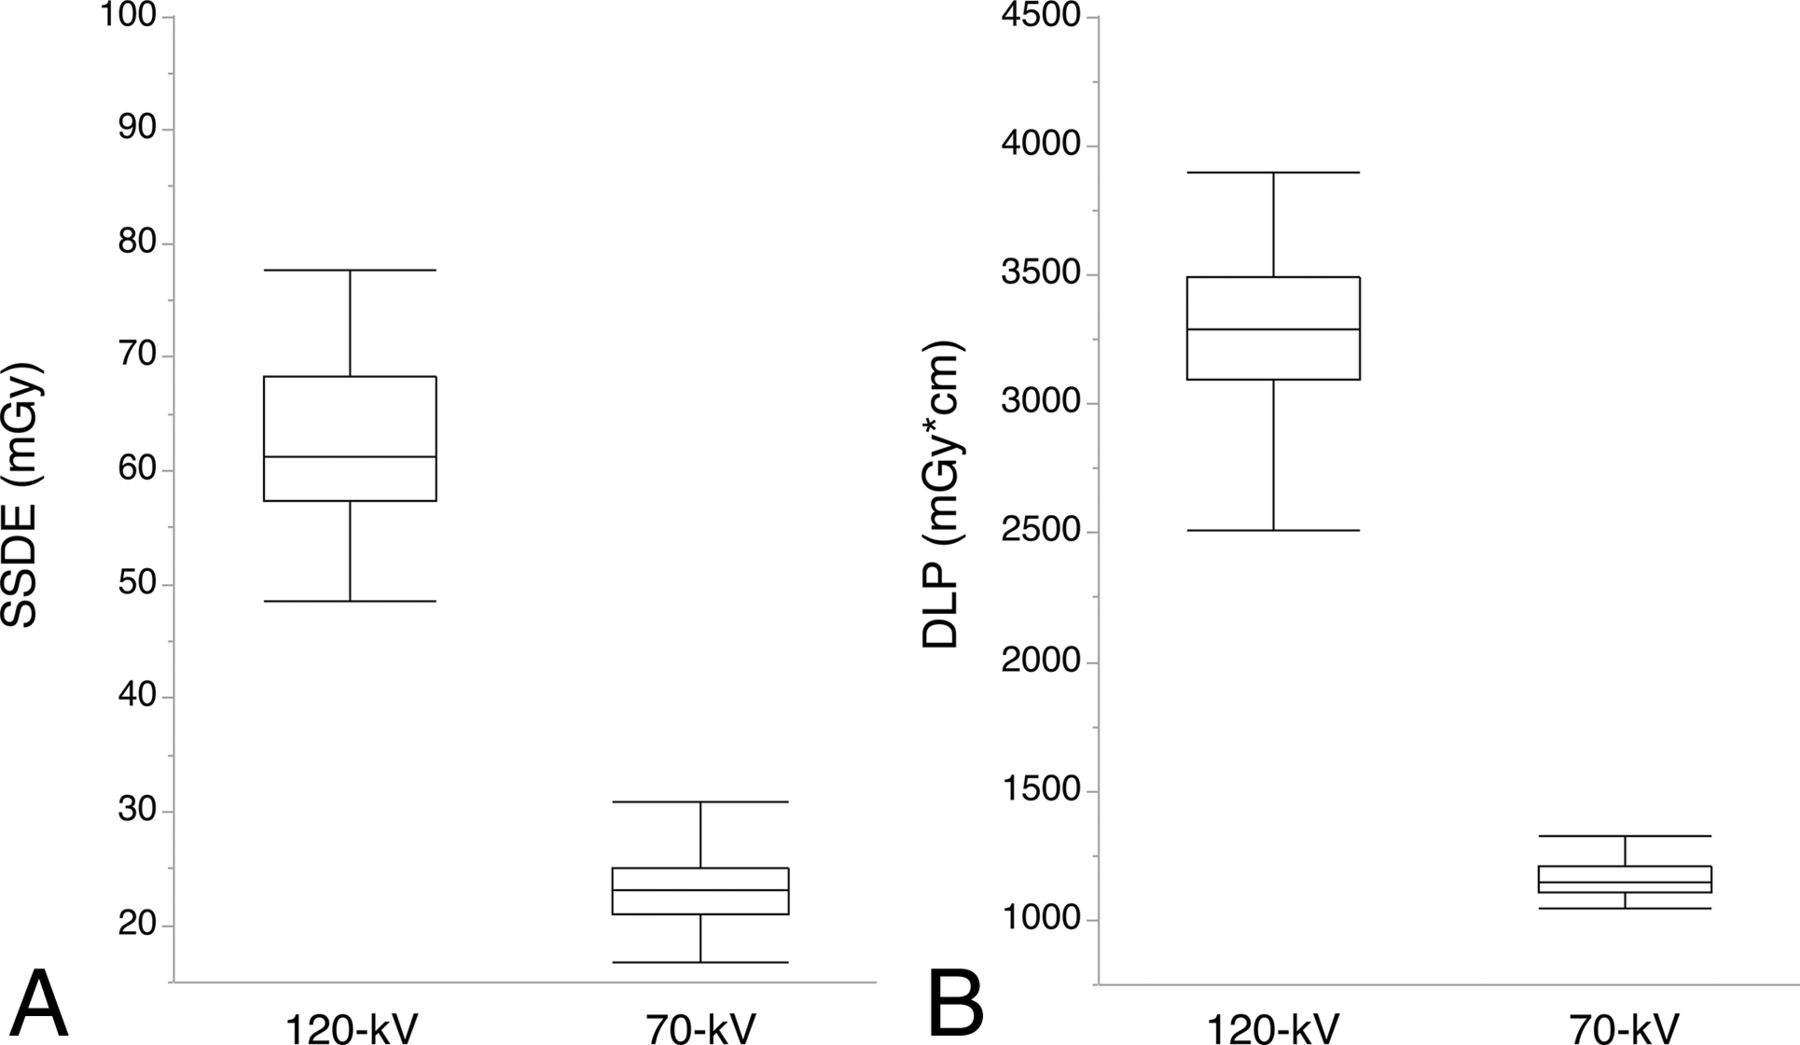
There was no significant difference in the demographic or clinical characteristics of subjects undergoing each of the imaging protocols (Table 1). No adverse events during CT were noted in the medical records. Radiation metrics for 1 phase were significantly reduced in 70-kV compared with 120-kV CTA (CTDIvol median, 16.2 mGy [IQR, 16.2–16.2 mGy] versus 47.1 mGy [IQR, 42.3–47.1 mGy]; SSDE median, 23.1 mGy [IQR, 21.1–25.1 mGy] compared with 61.3 mGy [IQR, 57.5–68.3 mGy]; dose-length product, 1147 mGy × cm [IQR, 1107–1211 mGy × cm] compared with 3293 mGy × cm [IQR, 3093–3487 mGy × cm], respectively; P < .001 for all analyses) (Fig 3).
Subject demographic and clinical characteristics

Box range shows the first and third quartiles; whisker range, from the 5th to 95th percentiles. Seventy-kilovolt CTA yields significantly lower SSDE (A) and dose-length product (B) than 120-kV CTA (P < .001 for both).
Identification of the AKA/CSA
The AKA was identified in 104 of 120 subjects (86.7%). We identified 108 AKAs because there were 2 or 3 AKAs in 3 patients. The CSA originated from a left segmental artery in 66.7% (72/108) and at the level of the eighth intercostal artery to the first lumbar artery in 86.1% (93/108) (Fig 4). A collateral pathway was found in 26 of 120 subjects (21.7%), 13 in each group (Table 2).
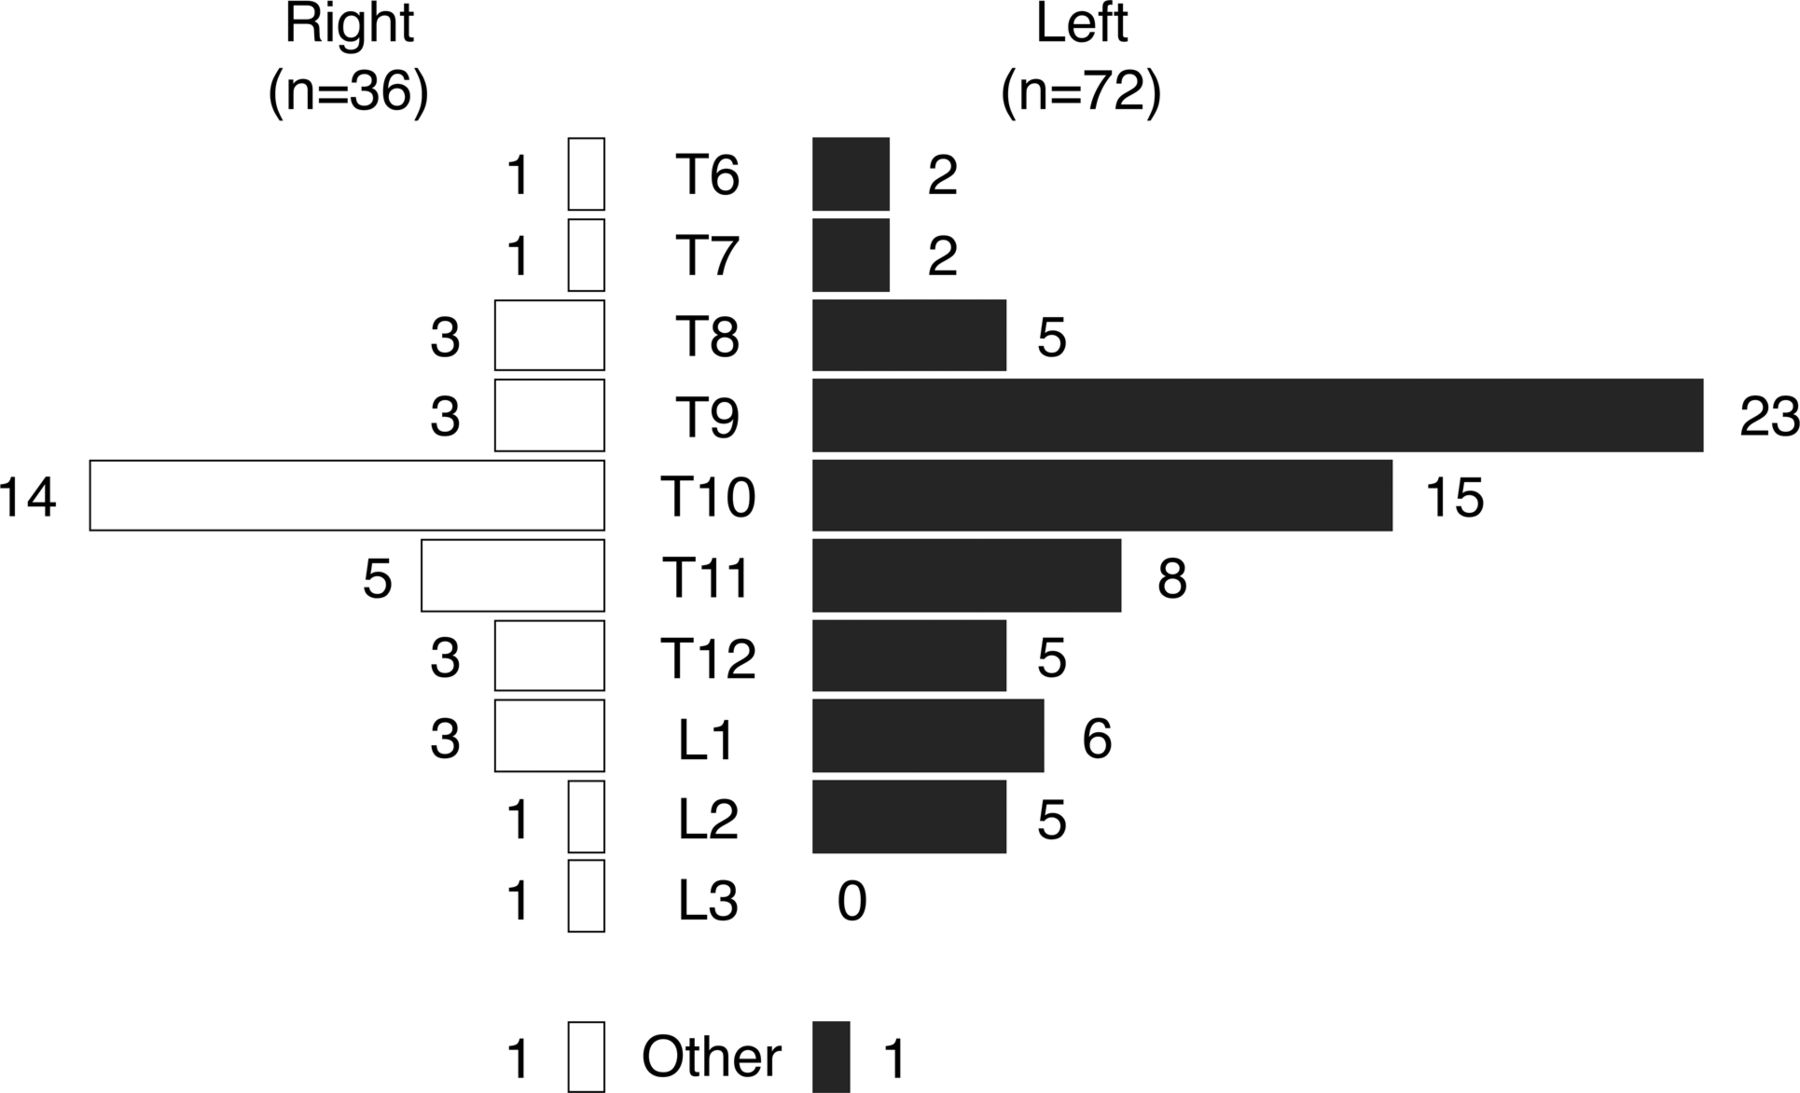
Distribution of the side and level of the CSA to the AKA is shown. Two cases in which the CSA and the AKA were supplied by the axillary artery were described as “other.”
Results of consensus interpretation of the critical segmental artery
Continuity and total scores for 70-kV CTA were significantly superior to those in 120-kV CTA (P = .001 and 0.009, respectively; Fig 5); however, the detection rate was not significantly higher (90.0% versus 83.3%, respectively; P = .28) (Table 2). The difference in detectability between 70- and 120-kV CTA was +6.6% (90% CI, −3.9% to +16.8%). For accuracy of detection of the correct CSA, 70-kV CTA was significantly more accurate than 120-kV CTA for observer A (P = .035), but it was not significantly different for observer B (P = .084, Table 3). For detection of the presence of a collateral pathway, 70-kV CTA showed significantly higher accuracy for both observers (P = .004 for observer A and .047 for observer B). The Cohen κ for agreement between observers A and B and the reference standard was as follows: 0.81 (95% CI, 0.71–0.92) and 0.81 (95% CI, 0.70–0.92) for 120-kV CTA and 0.94 (95% CI, 0.88–1.00) and 0.92 (95% CI, 0.85–1.00) for 70-kV CTA, respectively. Representative CTA images with the highest continuity score in both protocols are presented in Fig 6.

Seventy-kilovolt CTA yielded significantly higher scores than 120-kV CTA. A, Continuity score, median 3 (interquartile range, 2–3) compared with 2 (interquartile range, 1–3), respectively. B, Total score, median 5 (interquartile range, 4–5), compared with 4 (interquartile range, 3–5), respectively (P < .05 for both).
Accuracy of interpretation of the critical segmental artery

A, Curved multiplanar reformatted image of a 77-year-old woman scanned with a 120-kV protocol shows definite continuity between the AKA and the segmental artery. B, Curved multiplanar reformatted image of a 68-year-old man scanned with a 70-kV protocol shows clearer visualization of the AKA and the segmental artery from the aorta. Window center and width were set at 200 and 800.
Quantitative Image-Quality Analysis
Seventy-kilovolt CTA achieved a significantly higher mean CT number in the aorta and SNRAorta than 120-kV CTA (mean CT number, 999.1 ± 187.3 HU compared with 508.7 ± 96.5 HU; SNRAorta, 51.0 ± 11.0 HU compared with 28.8 ± 9.2 HU, respectively; P < .001 for both) (Fig 7). In 70-kV CTA, the CT numbers of the ASA, spinal cord, and bone cortex were significantly higher; however, there was no significant difference in the SD of the spinal cord (Table 4). Consequently, CNRASA-Cord and CNRASA-Bone were both significantly superior with 70-kV CTA than with 120-kV CTA (P < .001 for both, Table 4).

Seventy-kilovolt CTA yielded a significantly higher CT number (A) and SNRAorta (B) than 120-kV CTA (P < .001 for both analyses).
Results of quantitative image-quality analysisa
Discussion
We found that 70-kV CTA has substantial advantages over 120-kV CTA for the detection of the AKA. With 70-kV CTA, a 66% reduction of the radiation dose (mean CTDIvol, 16.2 mGy), while fulfilling the diagnostic reference level for chest or abdominal CT (21–25 mGy)22 was possible without impairing the detection rate of the AKA and the CSA. Moreover, 70-kV CTA yielded significantly higher continuity and total scores and quantitative image-quality metrics, such as CT number of vessels, SNRs, and CNRs.
The use of the 70-kV scanning technique for cervical vascular CT has been reported before23; however, its utility is thought to be limited by image noise and artifacts. Image noise depends on photon flux, which, in turn, is dependent on tube current and voltage.24 Because decreasing the tube voltage reduces photon flux, image noise would be expected to be higher in a 70-kV scan, but this can be addressed with the high tube current provided by the dual-power scan mode and an iterative reconstruction algorithm.25 Using 2 state-of-the-art CT techniques, we were able to control image noise while significantly reducing the radiation dose compared with 120-kV CTA, thereby also improving contrast material enhancement to increase the SNRAorta and CNRASA-Cord in 70-kV CTA. Although the quality of images obtained with 70-kV CT could theoretically be impaired by the presence of metal foreign bodies or stents or streak artifacts from extensive contrast attenuation, we did not observe any substantial diminution in image quality.
To identify the AKA, it is important to establish its continuity with the aorta, because the anterior radiculomedullary vein is similar in shape and size to the AKA and may run close to it.12,18 When aortic disease has occluded the segmental arteries, it is necessary to identify the collateral supply via the CSA at a different vertebral level from the AKA.3,26 The proximity between the AKA (or the collateral supply from the CSA) and the vertebral bone cortex makes the evaluation of continuity of the AKA or correct identification of the CSA challenging and time-consuming in spinal CTA.27 However, due to the improvement of CNRASA-Bone in 70-kV CTA, the continuity score was significantly higher than with 120-kV CTA. The accuracy of detection of the CSA was also improved in 70-kV CTA, especially when there was a collateral pathway to the AKA. Use of the continuity and total scores to detect the CSA allows surgical strategies for spinal protection to be identified with confidence, potentially informing the choice to undertake segmental artery reconstruction.8
Despite improvement in the continuity score, the AKA detection rate with 70-kV CTA was not significantly different from that of 120-kV CTA. However, 85%–90% is considered the upper limit of detectability of the AKA with CTA. Even in postmortem studies, the AKA detection rate (of anterior radiculomedullary arteries of ≥0.5-mm diameter) is reported to be 88%.28 Furthermore, the detection rate of selective spinal angiography in a cohort of 487 patients with aortic disease has been reported as 86%,29 and the combination of CTA and MR arteriography can achieve a detection rate of 89%.12 The remaining 10%–15% of individuals in whom the AKA is undetectable are thought to have a greater number of smaller-caliber anterior radiculomedullary arteries (<0.5-mm diameter), according to an inverse association between the number and caliber of the anterior radiculomedullary arteries contributing to entire spinal blood supply.30 Further advances in spatial resolution with CT might address limitations in visualization of the AKA; however, future studies should focus on fine-tuning CTA protocols to reduce radiation exposure and contrast material volume.
Our study had several limitations because of its single-center retrospective design. First, differences among CT scanners, especially reconstruction methods and the detectors, may have affected image quality. Nonetheless, image noise was not significantly different between the 2 CTA techniques, and consequently, we concluded that the higher vessel CT number of 70-kV CTA made it superior for AKA visualization. Because the scan mode was changed on installation of the new CT scanner at our institution, selection bias should also have been minimized. Second, we used a reference standard for CSA detection of the consensus interpretation of 2 specialists rather than conventional selective spinal angiography. Because selective spinal angiography is associated with complications in patients with aortic disease, we judge that using it to identify the AKA for validation purposes would not have been clinically or ethically acceptable.12
Finally, because all our subjects were Asian, the contrast material volume and usability of the low-kilovolt images may not be representative of those needed by subjects of other ethnicities or body sizes. However, even in obese patients, the low-kilovolt scanning technique can reportedly be successfully adapted by automated tube-voltage selection.31 Further study is required to establish the optimum tube-voltage setting, radiation dose, and contrast material dose and injection rate to visualize the AKA according to body size.
Conclusions
Seventy-kilovolt CTA has substantial advantages over 120-kV CTA for the identification of the blood supply to the spinal cord, requiring a lower radiation dose but improving image quality sufficiently to allow confident and correct interpretation of the AKA and the CSA.
Acknowledgments
The authors thank the following CT technologists for their support in image acquisition and processing: Tomoki Maebayashi, Ryuji Shimada, Erina Suehiro, Wakiko Tani, Toshinori Sekitani. and Noriyuki Negi.
Footnotes
Disclosures: Satoru Takahashi—UNRELATED: Grant: Siemens Healthcare*; Consulting Fee or Honorarium: Siemens Healthcare, Comments: honorarium for lectures; Support for Travel to Meetings for the Study or Other Purposes: Siemens Healthcare, Comments: travel fee for the presentation at Siemens SOMATOM World Summit meeting; Payment for Writing or Reviewing the Manuscript: Siemens Healthcare; Payment for Lectures Including Service on Speakers Bureaus: Siemens Healthcare, Philips Healthcare, Toshiba Medical Systems, GE Healthcare, Bayer Yakuhin, Esai, Fujifilm RI Pharma, Nihon Medi-physics, Daiichi Sankyo, Fuji Yakuhin, Astellas Pharma, AstraZeneca, Novartis International AG. *Money paid to the institution.
References
- Received May 21, 2017.
- Accepted after revision July 7, 2017.
- © 2017 by American Journal of Neuroradiology


