
Abstract
BACKGROUND AND PURPOSE: Resistance to blood flow in the cerebral drainage system may affect cerebral hemodynamics. The objective of the present study was to use phase-contrast MRA to quantify resistance to drainage of blood across branches of the venous sinus tree and to determine whether the resistance to drainage values correlated with internal jugular vein outflows.
MATERIALS AND METHODS: We performed whole-head phase-contrast MRA and 2D phase-contrast MR imaging in 31 healthy volunteers. Vascular segmentation was applied to the angiograms, and the internal jugular vein velocities were quantified from the flow images. Resistance to drainage across branches of the venous sinus tree was calculated from the segmented angiograms, by using the Poiseuille equation for laminar flow. Correlations between the values of resistance to drainage and internal jugular vein outflow measurements were assessed by using the Spearman ρ.
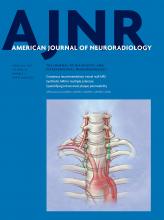
RESULTS: The overall mean resistance to drainage of the venous sinus tree was 24 ± 7 Pa s/cm3. The mean resistance to drainage of the right side of the venous sinus tree was 42% lower than that of the left side (P < .001). There were negative correlations between the values of resistance to drainage and internal jugular vein outflows on both the left side of the venous sinus tree (R = −0.551, P = .002) and the right side (R = −0.662, P < .001).
CONCLUSIONS: Phase-contrast MRA is a noninvasive means of calculating the resistance to drainage of blood across the venous sinus tree. Our approach for resistance to drainage quantification may be of value in understanding alterations in the cerebral venous sinus drainage system.
ABBREVIATIONS:
- AI
- asymmetry index
- IJV
- internal jugular vein
- PC-MRA
- phase-contrast MR angiography
- Rd
- resistance to drainage
The cerebral venous sinus system is characterized by anatomic variations1 associated with marked interindividual variability in blood drainage patterns.2 The venous compartment is generally compliant, whereas the walls of the sinuses tend to be rigid. In comparison with the intracranial arterial system, the venous sinus system has received less attention in the imaging-based evaluation of cerebrovascular diseases in clinical research, possibly because the pathologies that affect the intracranial venous sinus system are less common than those affecting the arterial system and often present a broad spectrum of clinical manifestations.3 However, alterations in cerebral hemodynamics are known to be associated with abnormal drainage in the cerebral venous sinus system. For example, impaired intracranial drainage is widely cited as one of the prime causes in idiopathic intracranial hypertension,4⇓⇓–7 intracranial dural arteriovenous fistula malformation,8 communicating and noncommunicating hydrocephalus,9,10 and multiple sclerosis.11 Nevertheless, a suspected case of venous stenosis must be assessed with caution12 because misinterpretation can lead to a nonindicated operation (with all its associated non-negligible risks). This point is clearly illustrated by the debate over the involvement of jugular venous stenosis in the pathogenesis of multiple sclerosis. In multiple sclerosis, it has been shown that percutaneous transluminal angioplasty of extracranial veins with suspected alterations is ineffective, may exacerbate underlying disease activity, and can lead to serious complications.13
In clinical practice, intraluminal vessel defects and/or pathologic flow velocities of the intracranial drainage system are usually evaluated by using contrast-enhanced or unenhanced MR imaging,5 CTA,14 DSA,15 or transcranial Doppler sonography.16 Although unenhanced vascular imaging techniques are less sensitive than contrast-enhanced techniques, they may be of value for an initial evaluation of the venous system in neonates or in patients who are allergic to contrast agents or have kidney dysfunction. Unenhanced 3D phase-contrast MRA (PC-MRA) offers several advantages: It is relatively rapid, is often appropriate for patient follow-up, and is associated with a lower complication rate.17,18 The results of patient evaluations usually show that a narrower luminal cross-section can produce higher flow resistance and therefore a decrease in flow and an increase in pressure—at least in the region adjacent (proximal) to the lesion. Moreover, venous sinus manometry has shown an elevated sagittal sinus pressure and a significant drop in transverse sinus pressure in patients with idiopathic intracranial hypertension.19 Other researchers have shown that most patients with idiopathic intracranial hypertension have normal blood flow in the superior sagittal sinus.7
The mechanisms linking the cerebral venous outflow rate to intracranial pressure have not been characterized, to our knowledge. However, it is possible that structural factors (such as an increase in the resistance to drainage [Rd] of blood across the branches of the venous sinus pathways) may impact intracranial venous outflow, as has been demonstrated in patients with venous outflow obstruction (in whom an elevated venous back pressure resulted in elevated venous resistance20). It is generally assumed that the pressure drop for driving axial flow across a tube increases with the flow resistance. Thus, an increase in venous sinus flow resistance would require an increase in upstream flow pressure for a constant volume flow through this drainage system to be maintained. Hence, the cumulative effects of the Rd across segments of the venous sinus pathways may have a role in cerebral hydrodynamics in general and in intracranial pressure and cerebral compliance in particular.
While the association between intracranial hydrodynamics and the geometric characteristics of the venous sinus system appears to be strong, we are not aware of any quantitative data on the resistance to blood flow in the cerebral drainage system. The objective of the present study was therefore to calculate the Rd of blood across the major dural sinuses and internal jugular veins (IJVs) in healthy volunteers by using phase-contrast MR angiography. We used the well-established Poiseuille equation for laminar flow to calculate the Rd from the PC-MRA data. Furthermore, we explored the relationship between the values of Rd and the IJV flows measured by cine phase-contrast MR imaging.
Materials and Methods
Participants
Twenty-nine healthy volunteers (mean age, 26.7 ± 5.5 years; 18 women and 11 men) were recruited. None had a history of neurovascular disease. The study was approved by the regional investigational review board, and all participants gave their written, informed consent.
Image Acquisition
Images were acquired with a 3T MR imaging system (dStream; Philips Healthcare, Best, the Netherlands) equipped with a 32-channel digital head coil, by using a 3D PC-MRA sequence. This sequence exploits the property whereby spins that move through a bipolar gradient field accumulate a phase difference, whereas static spins do not. The bipolar flow-encoding gradients can be applied simultaneously along 3 axes to measure the corresponding flow sensitivities. The sensitivity of the PC-MRA technique can be controlled by using a parameter sequence commonly referred to as “velocity-encoding.” More details of this technique have been presented by Dumoulin et al.21
PC-MRA was performed in the sagittal plane (covering the whole cerebral venous system and some of the IJVs, up to the C3–C4 cervical vertebrae) by using the following parameters: FOV = 220 × 220 mm2; number of sections = 320; effective spatial resolution = 0.7 × 0.7 mm2; flip angle = 12°; velocity-encoding = 30 cm/s; TR = 5.5 ms; TE = 3 ms; acquisition time = 6 minutes. Next, 2D PC-MR images were acquired perpendicular to the IJVs near the C2 and C3 vertebrae, by using a gated cine PC-MR imaging pulse sequence. The main scan parameters were as follows: FOV = 120 × 120 mm2; resulting spatial resolution = 0.5 × 0.5 mm2; section thickness = 2 mm; TR/TE = 14/8 ms; flip angle = 30°; velocity-encoding = 80 cm/s; cardiac phases = 16. The acquisition times ranged from 1.2 to 1.8 minutes, depending on the heart rate.
Image Processing
The PC-MRA datasets were imported into Mimics software (Materialise, Leuven, Belgium) for 3D, semiautomated segmentation of the cerebral venous sinus tree (represented as the superior sagittal, straight, transverse, and sigmoid sinuses and the IJVs). Threshold-based segmentation was used to extract the venous sinus tree from each angiogram. To this end, the section passing as close as possible to the mesial plane of the straight sinus was selected, and an intensity profile was obtained along a line perpendicular to the sinus. A suitable intensity threshold was then determined from this profile (17%–23% of its maximum intensity, depending on the image quality for each participant). All voxels with signal intensities below this threshold value were masked. Figure 1 shows a typical segmentation of the venous sinus tree. The final segmented geometry was converted into a Standard Tessellation Language file format. The Standard Tessellation Language file was then imported into the Vascular Modeling Toolkit software (www.vmtk.org) for quantification of the length, cross-sectional area, and associated radius at 10-mm intervals along each vessel segment. To avoid possible bias due to anatomic variations, we excluded the anterior portion of the superior sagittal sinus from the calculation.
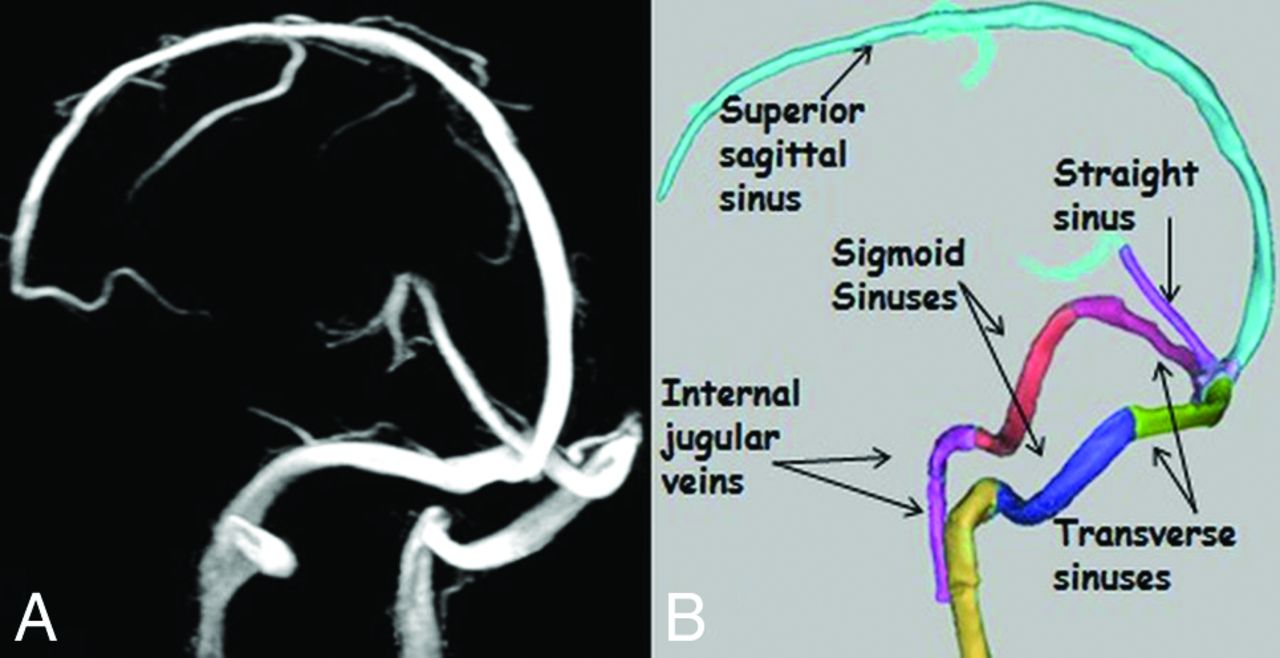
Representative examples of maps of the venous sinus tree. A, Maximum-intensity projection of a 3D PC-MRA source image. B, The venous sinus tree segmentation was produced by Mimics software.
For the flow images, IJV flow velocities at the C2–C3 cervical vertebrae were quantified throughout the cardiac cycle by using freely available, semiautomatic software (Bio Flow image; http://www.tidam.fr). Details of the flow measurement have been described previously.22
Calculation of Resistance and Flows
The Rd of each 10-mm segment was calculated by applying the Poiseuille equation for laminar flow:
 where L (10 mm) and rh are the length and the radius of the segment, respectively, and μ is the viscosity of the blood. The total Rd for a selected part of the venous sinus tree was calculated by summing the Rd for all the component 10-mm segments.
The left- or right-sided Rd for the venous sinus tree was calculated by summing the Rd values for the transverse sinus, sigmoid sinus, and IJV on each side of the head. An overall Rd for the venous sinus tree was also calculated by analogy with an electric circuit (Fig 2). Details of the mathematic equation for calculation of the overall Rd are presented in the Appendix.

Schematic representation of the modeled venous system. S. indicates sinus.
The flows in each IJV were also added to obtain the total IJV flow. Figure 3 shows the change in mean flow in the IJVs over the cardiac cycle in 1 participant.
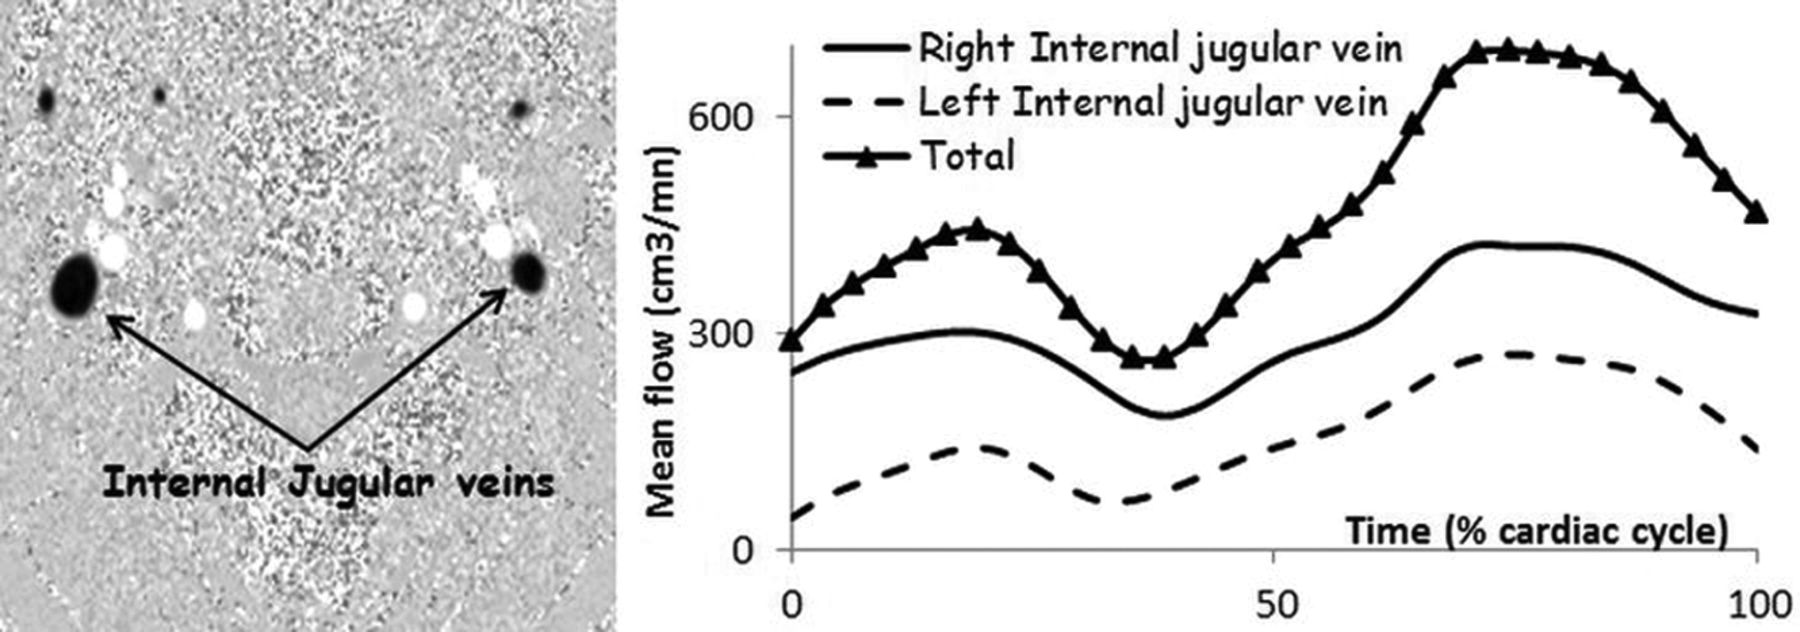
An example of phase-contrast MR imaging showing the 2 IJVs (at the C2–C3 vertebrae) and typical flow curves over the cardiac cycle in 1 participant. The curve marked with triangles shows the total mean flow through the left and right IJVs.
Statistical Analysis
Statistical analysis was performed with R statistical and computing software (Version 3.2.3; http://www.r-project.org/). A Wilcoxon matched-pairs test was used to probe for differences between the left and right sides of the venous sinus tree. Correlations between the values of Rd and blood flow measurements of the IJVs were assessed by using the Spearman ρ. The threshold for statistical significance was set at P < .05.
We calculated the correlations between the values of Rd and IJV flow measurements for each side of the venous tree and between the overall Rd for the venous sinus tree and the total IJV flow measurements. We also looked at whether there was an association between sidedness in flow and sidedness in Rd in the venous sinus tree. To this end, we calculated 2 asymmetry indices (AIs) for each participant:
The resistance AI, reflecting asymmetry resistance, was the following:

The flow AI, reflecting IJV flow dominance, was the following:
The AIs obtained with these 2 equations ranged from −1 (strong right dominance) to +1 (strong left dominance). The strength of the sidedness (for flow or resistance) was categorized as +0.2 < AI < +1 (left-sided dominance), −0.2 < AI < −1 (right-sided dominance), and −0.2 < AI < +0.2 (codominance).
The correlation between the flow AIs and resistance AIs were also evaluated.
Results
The mean values of Rd for each vessel segment and for the venous sinus tree as a whole are summarized in the Table. Significant sidedness was observed for the mean of Rd (left side versus right side, 42.1 ± 17 versus 18.4 ± 10 Pa s/cm3; P < .001) and the measured flows (left side versus right side, 250 ± 108 versus 349 ± 124 cm3/min; P = .02). Left-dominant, right-dominant, and codominant flow was observed in, respectively, 17%, 48%, and 35% of the participants.
Values of the mean Rd of blood in the study population of healthy adults
Scatterplots of the associations between the values of Rd and flow measurements are shown in Fig 4. There were significant negative correlations between the values of Rd and the flow measurements on both the left side of the venous sinus tree (R = −0.551, P = .002) and the right side (R = −0.662, P < .001). When we considered associations between flow dominance and resistance dominance, there was a strong negative correlation between the flow AIs and the resistance AIs (R = −0.792, P < .001) as illustrated by a scatterplot (Fig 5). There was no significant correlation between total resistance and total venous outflow (R = −0.359, P = .06).

The relationship between mean flow and calculated Rd on the left (left panel) and right (middle panel) sides of the venous sinus tree. The vessels of the left and right sides, respectively, comprise the 3 left or right vessel segments (the transverse sinus, sigmoid sinus, and IJV). The right panel shows the relationship between total mean flow and the overall Rd.
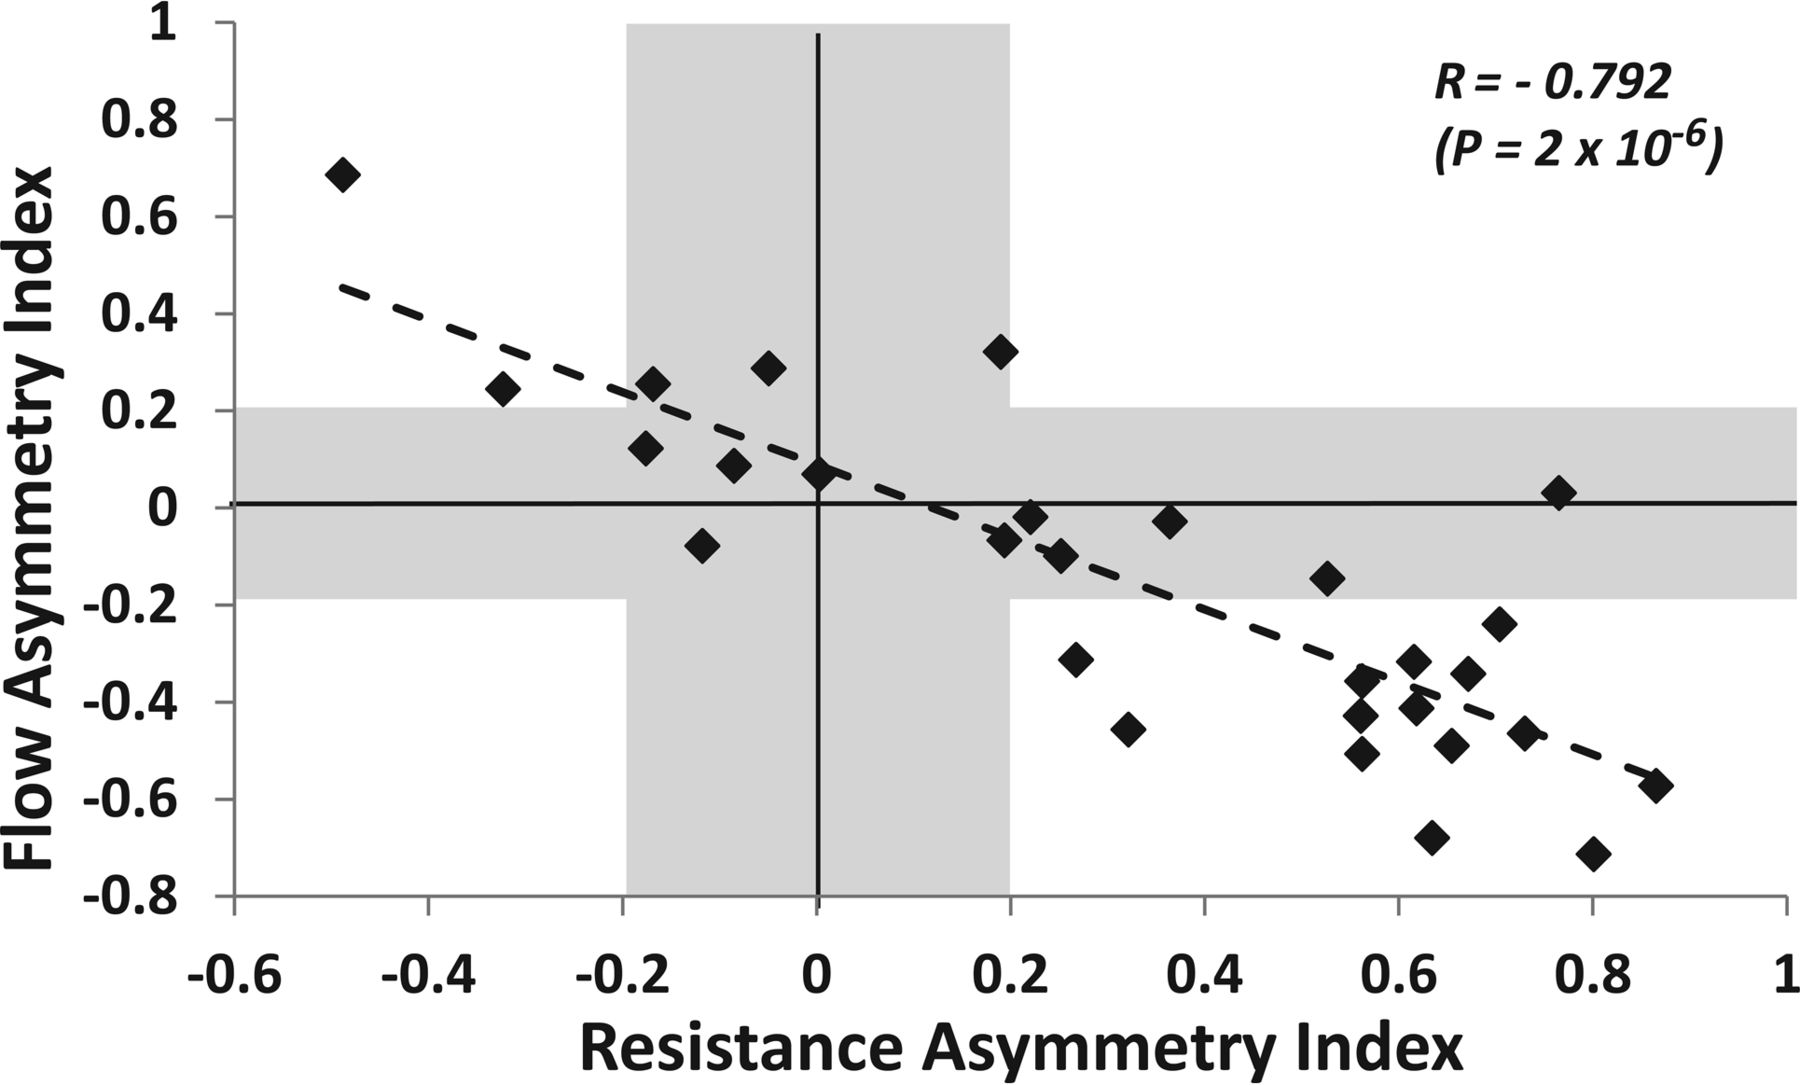
Flow AIs plotted against resistance AIs. Diamonds located below the horizontal gray band (AI < −0.2) reflect right-sided flows, and those above the horizontal gray band (AI > +0.2) reflect left-sided flows. Diamonds located to the left of the vertical gray band (AI < −0.2) reflect right-sided resistance, and those on the right of the vertical gray band (AI > +0.2) reflect left-sided resistance.
Discussion
It has been suggested that cerebral venous sinus insufficiency is a major factor in certain neurovascular diseases.4,5,8⇓–10,23 Apart from evaluations of anatomic abnormalities and the quantification of narrowed vessels and abnormal flow/pressure patterns,24,25 little is known about resistance to blood flow in the cerebral venous sinus drainage system. Here, we describe a novel approach for calculating the Rd through the cerebral venous tree; it is based on the application of the Poiseuille equation for laminar flow to data from phase-contrast MRA, a highly sensitive technique for noninvasive imaging of the cerebral venous sinus system.26
In the present study, we hypothesized that turbulent flow conditions occur very infrequently. To confirm this hypothesis, we calculated the Reynolds number (Re) for the study participants' superior sagittal sinus and IJVs according to the following equation: Re = ρVD / μ, where V is the maximum velocity, D is the diameter of the luminal cross-section, ρ is the attenuation of blood, and μ is the viscosity of blood. The highest Reynolds number that we obtained was 392, well below the value of 2000 at which turbulent flow conditions can be expected.27
The blood flows through the IJVs measured in our study agree with the literature data.28 We also observed relatively high interindividual variations in both the calculated Rd and outflows. These flow variations have been reported by others2 and may reflect anatomic variants rather than changes in physiologic conditions.11 The total venous flow appeared to be correlated with the overall Rd of the venous sinus tree, though the relationship did not achieve statistical significance. One possible explanation is that our representation of the very complex venous sinus pathway was oversimplified; some branches of the venous drainage network were not taken into account in our calculation of the overall resistance. For example, the straight sinus drains the deep venous system through the inferior sagittal sinus and the vein of Galen.29 The transverse sinus also receives the superior petrosal sinuses and the veins of Labbé, which drain blood from the temporo-occipital cortex. Moreover, the drainage pathways include the emissary veins, vertebral veins, and pterygoid plexus; this network may also explain the lack of a statistically significant correlation between the values of the overall Rd and the total IJV flow measurements. We chose to limit our measurements to the major dural sinuses, in view of the high interindividual variations in the venous sinus system.30
Another unique feature of the cerebral venous drainage system is its dependence on posture. In the upright position, the IJVs tend to collapse and thus prompt a concomitant rise in flow in the vertebral veins31; in the supine position, they are the main drainage pathways for the cerebral outflow. Our participants were imaged in the supine position, which minimized the impact of position on both flow and Rd measurements of the IJVs.
The present findings and previous reports2,32 show that venous drainage is dominated by the right outflow, reflecting the asymmetry in the resistance between the left and right sides of the venous sinus pathway. Furthermore, the relationship between resistance and flow was highlighted by our observation of a strong, inverse correlation between the resistance AIs and the flow AIs. The presence of an inverse association may indicate a lateralization effect, whereby one side compensates for the other.2,28 It may also underline the importance of flow resistance in the regulation of cerebral blood outflow. Although our results are preliminary, they suggest that the cumulative effects of resistance to flow along vessel segments may have repercussions on the intracranial hydrodynamics, insofar as cerebral blood outflow may be influenced by the venous sinus resistance to flow. It is also possible that an elevated Rd across the cerebral sinus pathways contributes to the elevation of blood pressure on the venous side of the cerebral vascular tree. An elevation in venous pressure makes the cortical veins stiffer and induces a decrease in craniospinal compliance.33 Furthermore, several researchers have emphasized the relevance of the venous sinus drainage system in hydrocephalus.9,10 One hypothesis is that elevated pressure in the venous system may lead to alterations in CSF resorption through the arachnoid granulations. Moreover, other researchers have suggested that reduced cortical vein compliance and reduced superior sagittal sinus flow in normal-pressure hydrocephalus indicate the presence of a significant elevation in the resistance to flow through these vessels.34,35 The balance between cerebral arterial inflow and venous outflow contributes to the maintenance of normal intracranial pressure, which depends not only on the arterial volume input and CSF volume but also on venous outflow.
The effect of intracranial fluid dynamics on intracranial pressure is a major component of the Monro-Kellie36,37 doctrine. As presented in Wilson's recent review,38 increasing evidence suggests that a venous pathology is central to the multiple conditions that cause a rise in intracranial pressure. A better understanding of the role of the venous system in neurocritical care is essential. In a prospective controlled study based on a grading system, Farb et al25 showed sinovenous stenosis in 27 of 29 patients with idiopathic intracranial hypertension and in only 4 of 59 control patients. Moreover, the severity of intracranial hypertension (which depends on the degree of venous congestion) was found to be closely related to the intradural sinus pressure.39 As the latter rises, slight parenchymal damage may progress to severe cerebral edema and/or hematoma if thrombolysis is delayed. Furthermore, some researchers have suggested that benign intracranial hypertension may be caused by venous hypertension,19,20 mostly due to stenosis or occlusions of the lateral sinuses. Moreover, it has been shown that dilation of one of the sinuses with a stent may reduce the pressure gradient and produce a striking reduction in symptoms.40 This venous sinus stent placement technique had a high technical success rate and was highly effective (80%) in reducing the headache associated with benign intracranial hypertension.41 Nevertheless, sinus stenosis appears to result from elevated CSF pressure (rather than hypertension) in some cases.42
Also, there is some evidence that idiopathic intracranial hypertension may be characterized by elevated central venous pressure20 in the absence of ventricular dilation, a mass lesion, or venous sinus thrombosis.43,44 Thus, it is possible that the cumulative effects of resistance to blood flow across the venous sinus pathways may lead to a substantial pressure increase in the intracranial drainage system. This question could be addressed (at least in part) by comparing venous sinus Rd measurements in patients versus healthy individuals. However, in the absence of such data, it seems premature to draw conclusions with regard to a possible causal link between venous sinus resistance to blood flow and intracranial hypertension.
The relationships between blood flow velocity, cross-sectional area, pressure drop, and resistance are very complex. A simplified relationship between fluid velocity and pressure can be described by the Bernoulli law, which is based on the fundamental physical law of energy conservation. The equation based on the Bernoulli law can take various forms, which differ in their complexity as a function of the type of fluid flow45 but can be represented as (½)·ρ·V2 + P + ρ·g·z = Constant, where ρ is the fluid attenuation, V is the velocity, P is the pressure, z the vertical height relative to a reference location, and g is the gravity constant. The first term of this equation accounts for the kinetic energy, and the 2 last terms represent the potential energy resulting from pressure and gravity. According to this principle, an increase in fluid velocity implies a concomitant decrease in pressure and vice versa. Therefore, if vessel resistance is increased by lumen constriction, the flow velocity rise would imply a decrease in pressure.
However, several assumptions must be made before applying the Bernoulli equation. In particular, the velocities must be uniformly distributed at the cross-sectional area, the fluid must be incompressible, and there must be no loss of energy. These assumptions tend to limit the applicability of the Bernoulli law to structures that are subject to deformation. Moreover, Cebral et al46 used phase-contrast MR imaging to investigate the flow-area relationship in the internal carotid and vertebral arteries. To the best of our knowledge, a similar study on the cerebral veins has not been performed. The pressure/area/flow relationships in compliant veins are much more complicated to evaluate than in the venous sinuses because the veins are prone to hydrostructural instability and are much more sensitive to slight pressure variations.
The present study had a number of limitations. First, the relatively small sample size must be taken into account when interpreting the results. A second limitation relates to the calculated Rd possibly being influenced by the hydrostatic pressure gradient across the venous sinus wall, which might influence the compliance of the vessels. Third, given that patterns of complex and disturbed flow may occur at branch points in the venous sinus network, the laminar flow required for the validity of the Poiseuille equation may not be met. It is also possible that the image quality was worsened by intravascular signal loss due to turbulence and intravoxel dephasing.47 Moreover, although the PC-MRA technique may be useful for imaging slowing blood flow48 and can depict multidirectional flow (such as recirculating flow patterns) with good sensitivity,49 the choice of an optimal velocity-encoding value that enables avoiding velocity aliasing also constitutes a study limitation.26 Last, our data were collected from a group of young, healthy participants. Extending this investigation to more representative samples of older individuals (including patients with cerebrovascular/neurovascular disease) would be a valuable goal in the near future.
Conclusions
The results of this preliminary study suggest that PC-MRA can be used to quantify Rd in the venous sinus drainage system. These measurements may improve our understanding of certain cerebrovascular diseases. Along with flow measurements, this approach can also be used to calculate a pressure drop across vessel segments by application of the Poiseuille equation for laminar flow: pressure gradient = resistance × flow.
Acknowledgments
The authors are grateful to the staff members at the Institut Faire Faces (Amiens, France) for technical assistance and thank the study volunteers for their participation.
Appendix
Calculation of Overall Rd
The overall Rd of the venous sinus system can be calculated by an analogy with an electric circuit (Fig 2). We have the following:
 Here, SSS and StS denote the superior sagittal sinus and the straight sinus, respectively, and Rleft side (or right side) represents the resistance of the left (or right) side of the venous sinus tree, calculated as the sum of the Rd of the 3-vessel segments (transverse sinus + sigmoid sinus + internal jugular vein):
Footnotes
The research was funded in part by the French National Research Agency (grant ANR-12-MONU-0010).
References
- Received April 20, 2016.
- Accepted after revision September 11, 2016.
- © 2017 by American Journal of Neuroradiology


Jump to section
Related Articles
Cited By...
- The Effects of Free Breathing on Cerebral Venous Flow: A Real-Time Phase Contrast MRI Study in Healthy Adults
- Insufficient cerebral venous drainage predicts early edema in acute intracerebral hemorrhage
- Differences in the Calculated Transvenous Pressure Drop between Chronic Hydrocephalus and Idiopathic Intracranial Hypertension