
Abstract
BACKGROUND AND PURPOSE: As amide proton transfer imaging is sensitive to protein content and intracellular pH, it has been widely used in the nervous system, including brain tumors and stroke. This work aimed to measure the lactate content and amide proton transfer values in the basal ganglia of a neonatal piglet hypoxic-ischemic brain injury model by using MR spectroscopy and amide proton transfer imaging.
MATERIALS AND METHODS: From 58 healthy neonatal piglets (3–5 days after birth; weight, 1–1.5 kg) selected initially, 9 piglets remained in the control group and 43 piglets, in the hypoxic-ischemic brain injury group. Single-section amide proton transfer imaging was performed at the coronal level of the basal ganglia. Amide proton transfer values of the bilateral basal ganglia were measured in all piglets. The ROI of MR spectroscopy imaging was the right basal ganglia, and the postprocessing was completed with LCModel software.
RESULTS: After hypoxic-ischemic insult, the amide proton transfer values immediately decreased, and at 0–2 hours, they remained at their lowest level. Thereafter, they gradually increased and finally exceeded those of the control group at 48–72 hours. After hypoxic-ischemic insult, the lactate content increased immediately, was maximal at 2–6 hours, and then gradually decreased to the level of the control group. The amide proton transfer values were negatively correlated with lactate content (r = −0.79, P < .05).
CONCLUSIONS: This observation suggests that after hypoxic-ischemic insult, the recovery of pH was faster than that of lactate homeostasis.
ABBREVIATIONS:
- APT
- amide proton transfer
- APTw
- amide proton transfer–weighted
- HI
- hypoxic-ischemic
- HIBI
- hypoxic-ischemic brain injury
The neonatal brain is in a process of continuous development and maturation and has a great demand for oxygen. Normally, brain activities are primarily supported by energy produced from the aerobic metabolism of glucose.1⇓–3 In a physiologic state, 90%–95% of brain energy is consumed by neurons, but 80% of glucose use happens in astrocytes, which suggests that a glucose mesostate released by astrocytes is absorbed and used by neurons to support their high energy consumption. A study4 has shown that during glucose metabolism in the brain, lactate is a carrier of energy and facilitates interaction between astrocytes and neurons. Astrocytes absorb glucose and transform it into lactate and then provide lactate to neurons. Therefore, lactate is an important mesostate during energy metabolism in the brain.
Normally, this astrocyte-neuron-lactate shuttle maintains a dynamic balance. However, when the brain is exposed to a hypoxic-ischemic (HI) environment, aerobic energy metabolism is interrupted5⇓–7 and becomes anaerobic. During anaerobic metabolism, lactate is produced, causing an increase of lactate in brain tissue. As a result, the accumulated lactate suppresses glucose metabolism and uses up adenosine triphosphate, thus exacerbating intracellular acidosis.8,9 Meanwhile, lactate is a crucial substrate for neurons that restores aerobic energy metabolism after an HI insult and plays an important role in the early stage of HI insult. Therefore, the study of lactate metabolism changes in the brain after HI insult furthers the understanding of neuronal energy metabolism and post-hypoxic-ischemic brain injury (HIBI) neuronal energy recovery and neuron protection mechanisms.
Brain acidosis often occurs after HI insult, for which the adjustment of the brain pH is critical. pH is especially important for protein structure and enzyme activity in the brain. Therefore, it is essential to timely detect and regulate the intracellular pH of brain tissues.
Amide proton transfer (APT) imaging is a recently developed MR imaging technique. In theory, APT signal intensity primarily depends on the exchange rate between amide protons and water protons10⇓–12; this exchange rate is associated with the protein content, pH, and temperature. If it is assumed that other variables remain unchanged, when the pH decreases, the exchange rate slows and APT signal intensity weakens.13⇓–15 Thus, APT imaging can also be considered pH-weighted imaging. The magnetization transfer ratio asymmetry (3.5 ppm) is called the amide proton transfer–weighted (APTw) intensity, to reflect the APT effect, which is contaminated by the conventional magnetization transfer ratio asymmetry and nuclear Overhauser enhancement.
In the normal physiologic state, lactate is absent or rare,16 but in an HI environment, lactate is increased; this change indicates enhanced anaerobic metabolism. To date, studies that explore the role of lactate in energy metabolism, particularly in neuron recovery after hypoxic-ischemic brain injury, and investigate the noninvasive detection of intracellular pH in brain tissues are few but promising. In the present study, we simulated pathophysiologic changes by using a neonatal piglet HIBI model and simultaneously evaluated the time course of lactate and APT changes in hypoxic-ischemic injury.
Materials and Methods
Experimental Animals
Initially, 58 healthy piglets (Yorkshire piglets or Large White pigs, 3–5 days after birth; weight, 1–1.5 kg) were selected; then, 6 animals were excluded because of in-process death, modeling failure, and motion artifacts. Data were collected from the remaining 52 animals, and they were randomly assigned to the control group (n = 9) and model group (n = 43). On the basis of the MR imaging time after the HI procedure, the model group was further divided into 6 subgroups (0–2 hours, n = 8; 2–6 hours, n = 8; 6–12 hours, n = 6; 12–24 hours, n = 10; 24–48 hours, n = 5; and 48–72 hours, n = 6). All experiments in animals were performed in compliance with the Regulations for the Administration of Affairs Concerning Experimental Animals (http://www.asianlii.org/cn/legis/cen/laws/rftaoacea704/) and Measures for the Administration of Licenses Concerning Experimental Animals (http://www.chinalawedu.com/news/23223/23228/24345.htm).
Establishment of Experimental Models
Control Group.
In the operating room with a temperature of 28°∼30°C, 0.6 mL/Kg of Su-mian-xin,16 an anesthetic agent (Changchun Military Veterinary Institute, Academy of Military Medical Science, Beijing, China), was intramuscularly injected; then tracheal intubation (2.5-mm cannula) was performed, and the tracheal intubation was connected to a TKR-200C small-animal ventilator (Jiangxi TELI Anesthesia & Respiration Equipment, Jiangxi Province, China) for mechanical ventilation (100% oxygen ventilator parameters: inspiratory/expiratory ratio, 1:1.5; respiratory frequency, 30 breaths/minute; pressure, 0.05–0.06 MPa). The heart rate and blood oxygen saturation were monitored with a TuffSat hand-held pulse oximeter (GE Healthcare, Milwaukee, Wisconsin). A catheter was inserted via an ear vein and then fixed in position. Thereafter, the neck skin was disinfected with iodophors, a median incision was made, and the bilateral common carotid arteries were isolated. Finally, the incision was sutured. During the operation, the piglet's body was covered with a quilt. After the surgery was completed, it was immediately put into an incubator (Shenzhen Reward Life Technology 912–005; Guangdong Province, China). Rectal temperature was maintained between 38° and 40°C.
HIBI Model Group.
The same procedures as in the control group were performed on model piglets. In addition, when their statuses became stable after 30 minutes of rest, the bilateral common carotid arteries were clamped with artery clamps to occlude blood flow and 6% oxygen was mechanically delivered (Dalian Special Gases, Liaoning Province, China) for 40 minutes; then 100% oxygen (Dalian Special Gases) was inhaled, the blood supply of bilateral common carotid arteries was restored, and the neck incision was sutured. After the model was established, the piglet was put into the incubator. The heart rate and blood oxygen saturation were monitored throughout the process. Intraoperative and postoperative shock and convulsion were treated promptly.17,18 After the animals resumed spontaneous breathing, the ventilator was withdrawn.
MR Imaging Protocol
1H-MR Spectroscopy Scanning and Data Processing.
The scanning was performed by using a 3T MR imaging scanner (Achieva 3.0T TX; Philips Healthcare, Best, the Netherlands) with pencil beams, second-order shimming, body coils for emission, and 8-channel head coils (sensitivity encoding) for receiving. MR spectroscopy was implemented with a point-resolved spectroscopy single-voxel sequence, and the sequence was performed with the following parameters: TR/TE = 2000/37 ms, number of signal averaged = 64, VOI = 10 mm × 10 mm × 10 mm. The right basal ganglia were selected as the ROI (Fig 1A). Before scanning, fluid attenuation and shimming were finished automatically by the scanner. Conventional MR imaging was performed before MR spectroscopy to obtain T1WI and T2WI for brain morphology observation and MR spectroscopy positioning. After HI insult, MR imaging was performed at the time points specified for each group (time = 0 was defined as control group). The raw image data were postprocessed by Linear Combination Model (LCModel; http://www.lcmodel.com/) software.19 NAA is at 2.02 ppm; Cr, at 3.02 ppm; Cho, at 3.2 ppm; and lactate, at 1.33 ppm. When MR imaging was performed, the piglet was carefully wrapped with a thick quilt to maintain body temperature. If spontaneous breathing was not restored after the operation, MR imaging was performed with artificial balloon breathing instead of mechanical ventilation.17,20,21
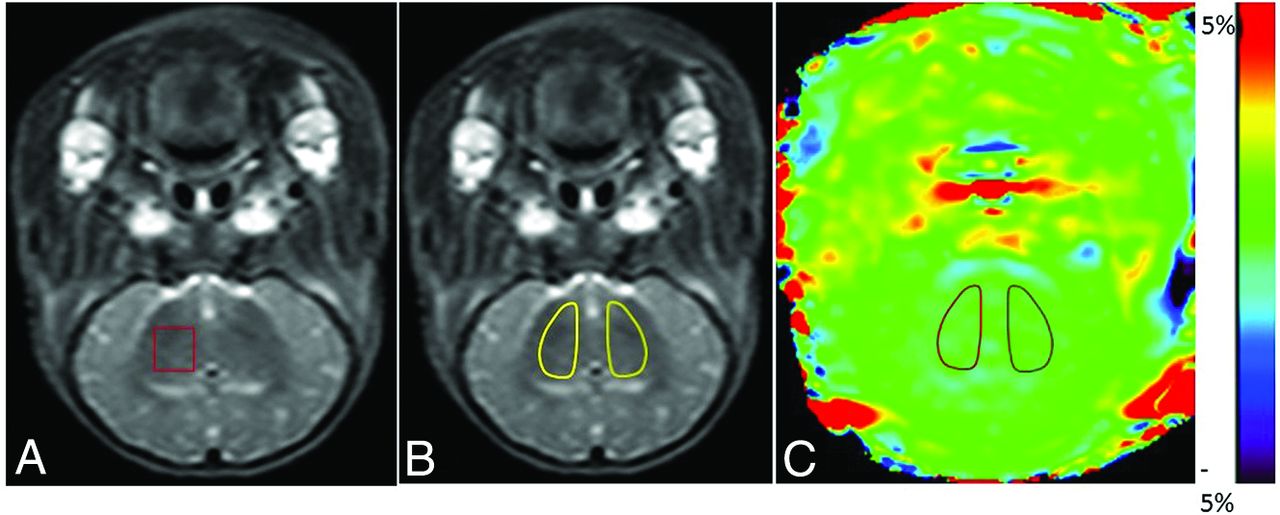
Definition of ROIs in MR spectroscopy and APT images. A, Illustration of the ROI in MR spectroscopy. For all animals, the right basal ganglia were selected as the ROI. B and C, Illustrations of ROIs in APT images (the T2WI serves as reference for the selection of ROIs in this study). In the control and HIBI groups, the bilateral basal ganglia were selected as ROIs, as shown by the areas marked with a solid line in B and C.
APT Data Acquisition and Processing
Acquisition of APT Data.
The coil used for the APT experiments was the same as that used for the 1H-MR spectroscopy. All piglets were positioned at the level of the basal ganglia by using coronal T2WI. An off-resonance continuous-wave radiofrequency saturation pulse was used. APT single-section imaging was performed, and the saturation time, at 2 μT excitation power, was 500 ms (the maximum time available for this body coil22⇓–24). The acquisition mode was TSE, and the factor was 38. We used the following settings: TR = 4000 ms, TE = 8.1 ms, matrix = 108 × 71, FOV = 170 mm × 145 mm, section thickness = 5 mm, scan time = 4 minutes 16 seconds. For APT imaging, the multiacquisition method with multiple radiofrequency pulses was performed to enhance the signal-to-noise ratio.25 During acquisition, saturated radiofrequency pulses of 31 frequencies were acquired at different offsets from the water resonance frequency (0, ±0.25, ±0.5, ±0.75, ±1, ±1.5, ±2, ±2.5, ±3 [2], ±3.25 [4], ±3.5 [8], ±3.75 [4], ±4 [2], ±4.5, ±5, ±6 ppm), where the number in brackets represents the number of repeat acquisitions when different from 1, and the images acquired without radiofrequency saturation served as normalized images. This acquisition protocol enabled the correction of the B0 field and the acquisition of APT images with a high SNR. When the experimental animals were scanned, a constant body temperature was maintained to avoid signal changes caused by temperature fluctuations.
Postprocessing of APT Data.
The acquired APT raw data were imported into the IDL application (Research Systems, Boulder, Colorado) for analysis, measurement, and reconstruction of pseudocolor images. First, voxel-based Z-spectra were obtained and then fitted by using a 12-order polynomial to identify the trough of the Z-spectrum and construct B0 heterogeneity; this process completed the field correction. In the corrected Z-spectrum, the symmetric data points at ±3.5 ppm were selected for asymmetry analysis (magnetization transfer ratio asymmetry, [3.5 ppm] = Ssat[−3.5 ppm] / S0 −Ssat[+3.5 ppm] / S0, where Ssat denotes the signal intensity with the radiofrequency pulse and S0 represents the signal intensity without the radiofrequency pulse).
APT Imaging: Selection of ROIs.
After the raw data were analyzed automatically by the software, the acquired APT images were evaluated by 2 senior radiologists and then quantified. After we combined the conventional coronal T2WI, ROIs (bilateral basal ganglia, Fig 1B) were manually drawn carefully on the APT images. The APT value of this ROI indicates the signal intensity. The ROIs should avoid the interference of the skull, CSF, and cerebral ventricles.
Statistical Analysis
The statistical analysis of data was performed by using SPSS for Windows (Version 17.0; IBM, Armonk, New York). Data were presented as mean ± SD (X̄ ± SD). The difference in APT values between the left and right basal ganglia was analyzed with the independent-samples t test. The statistical differences in APT values and lactate content between the control and HIBI groups at different time points were analyzed by ANOVA. The correlation between APT values and lactate content was analyzed by Spearman rank correlation analysis. P < .05 was a statistically significant difference.
Results
Measurements of APT Values and Lactate Content
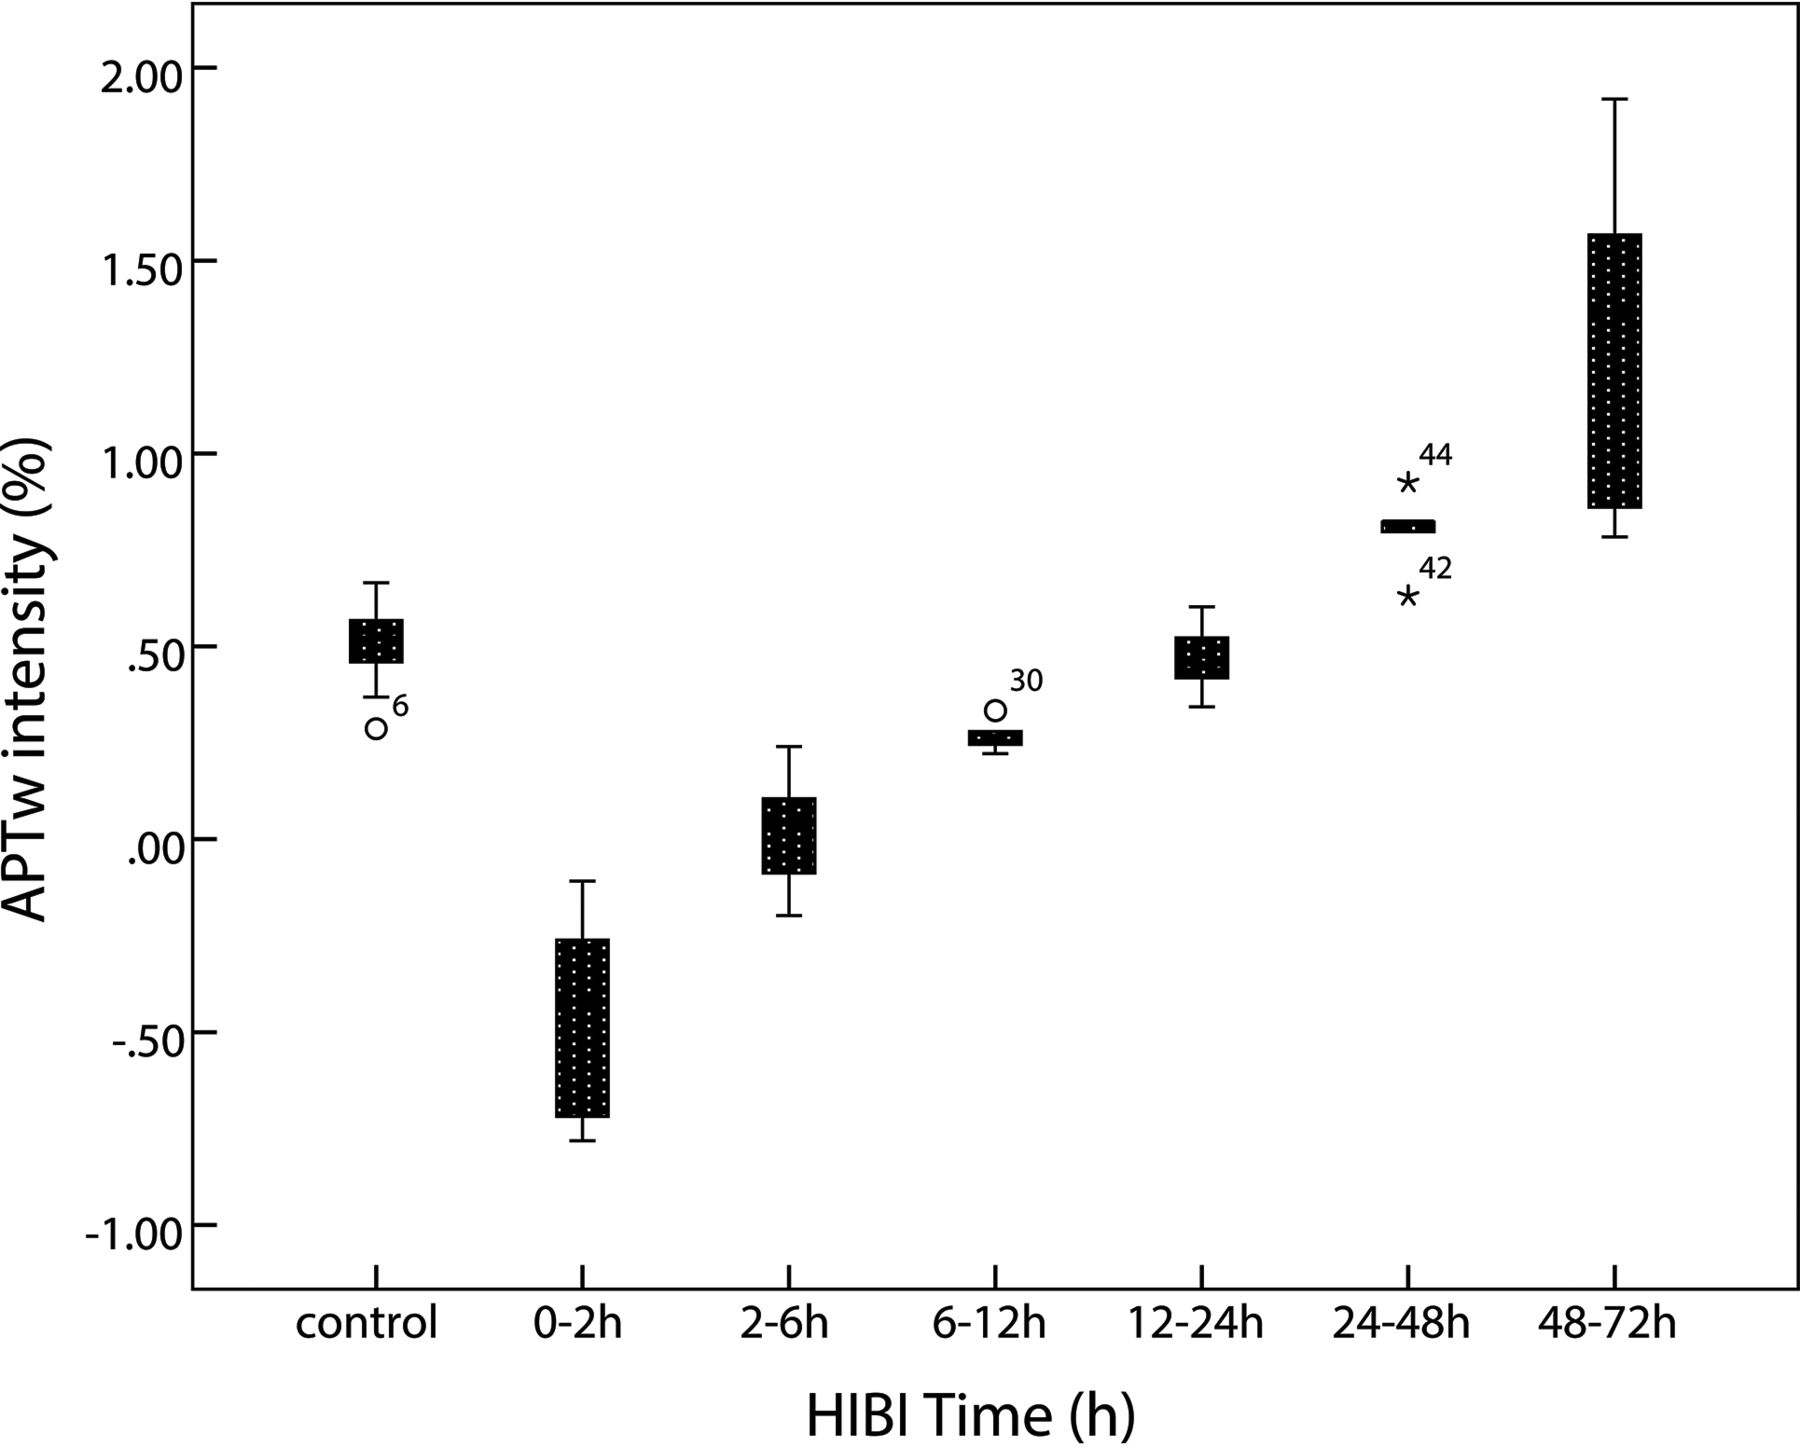
Because no statistical difference in APT values was observed between the left and right basal ganglia (P = .82), APT values of the bilateral basal ganglia were averaged to calculate a mean APT value for each group. The APT values of the control group and HIBI groups differed significantly (control group versus 6–12 hours, P = .029; control group versus 24–48 hours, P = .009; other groups, P < .001) except for control group versus the 12- to 24-hour group (P = .762). The time-related changes of APT values in the control and HIBI model groups are shown in the Table and Fig 2.
APT and lactate measurements at different time points

Time-related changes of APT values of the basal ganglia. After HI insult, APT values immediately decrease and reach the lowest level at 0–2 hours; thereafter, the values gradually increase, recover to the level of the control group at 12–24 hours, and then continue increasing. They are higher than the control group level at 48–72 hours.
1H-MR Spectroscopy
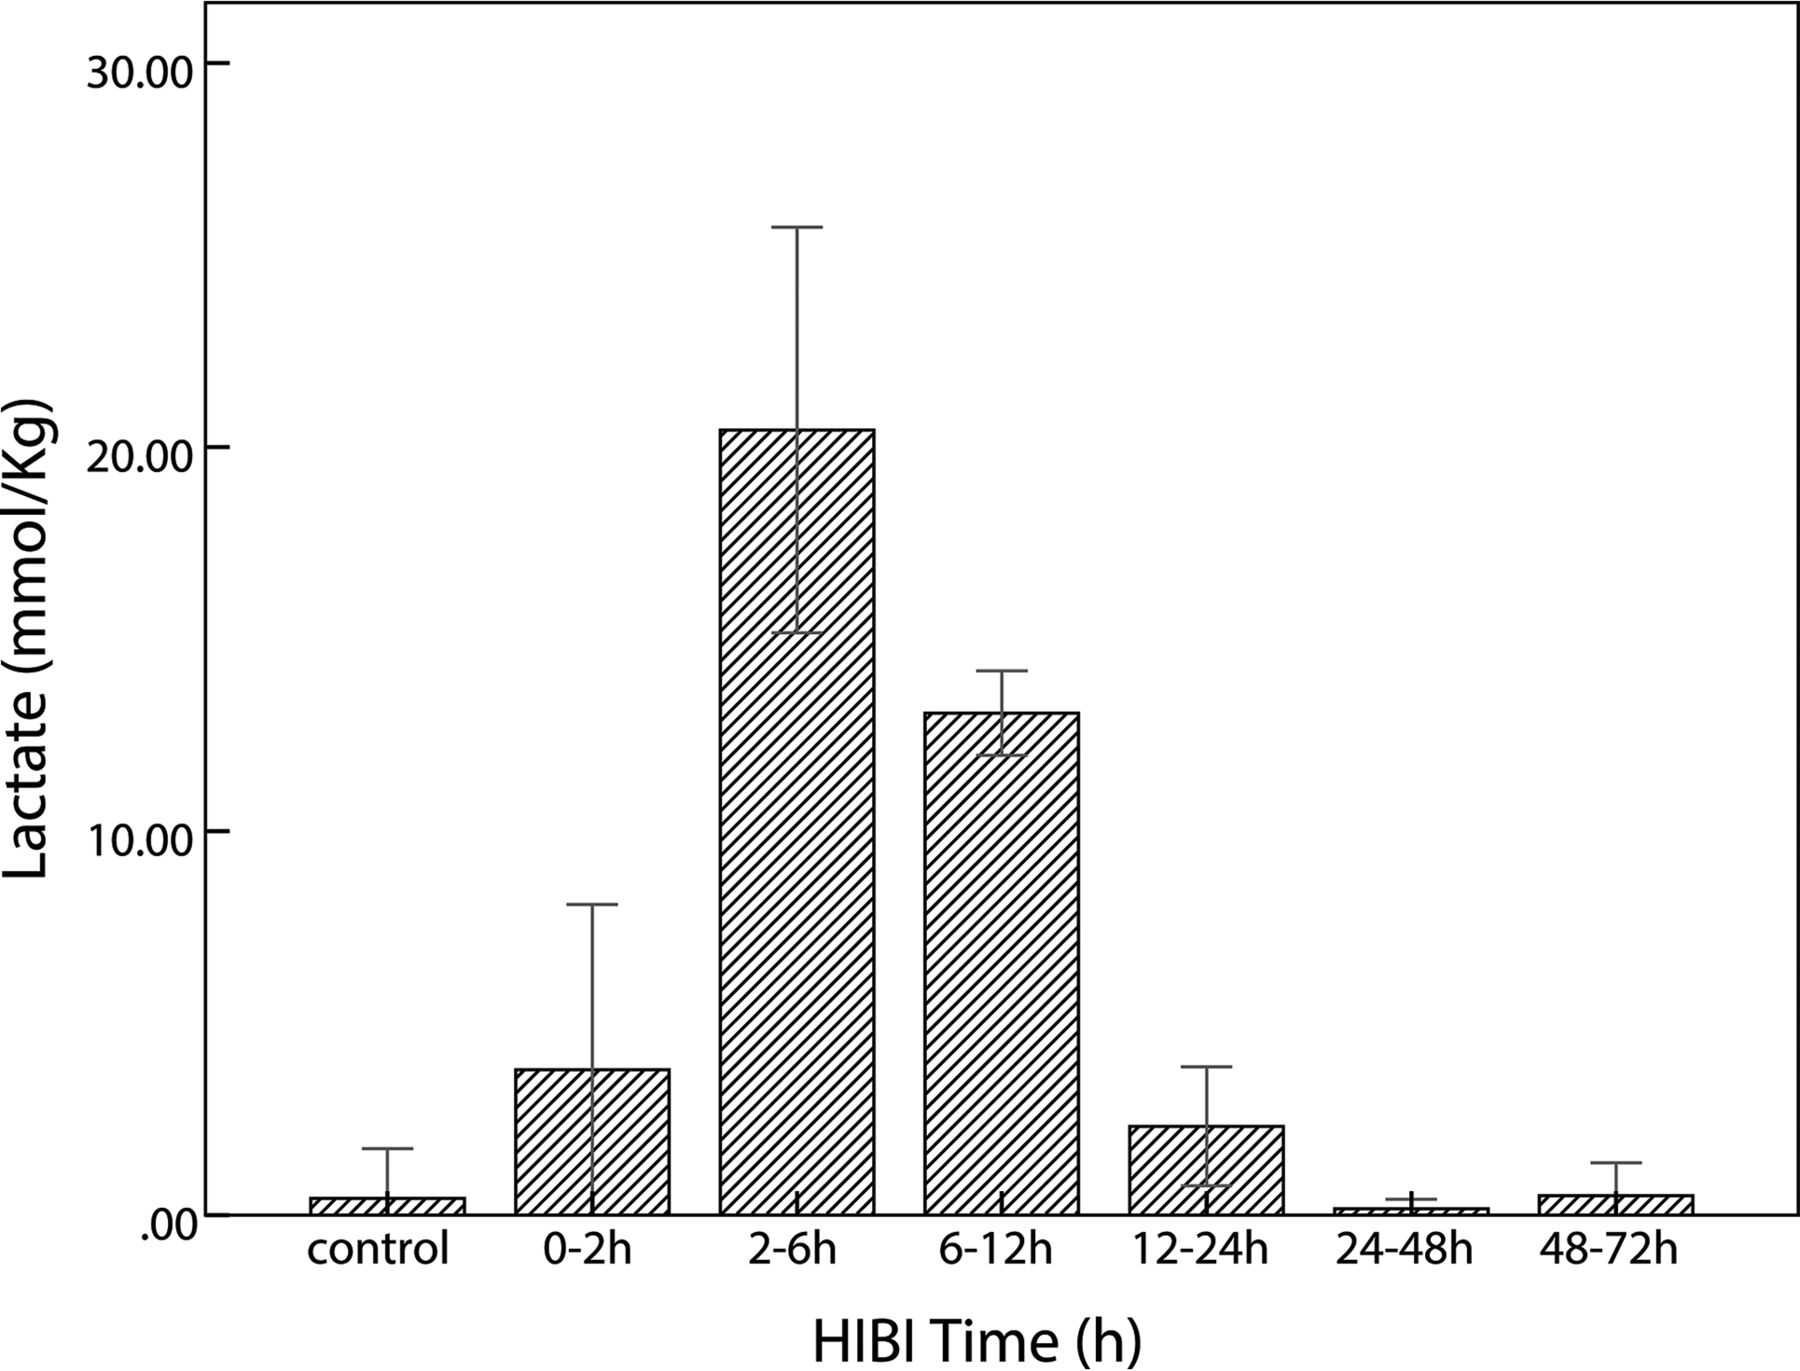
In the HIBI group, lactate content was maximal at 2–6 hours; thereafter, it gradually decreased and finally was similar to that of the control group, as shown in the Table and Fig 3. The lactate content of the control and HIBI groups did not differ significantly at 12–24 hours, 24–48 hours, or 48–72 hours (control versus 12–24 hours, P = .16; control versus 24–48 hours, P = .87; and control versus 48–72 hours, P = .96), but it differed significantly at other time points (0–2 hours versus the control group, P = .02; 2–6 hours and 6–12 hours versus the control group, P < .001). The lactate content at different time points is presented as X̄ ± SD, as shown in the Table.

Time-related changes of lactate in the control and HIBI groups. After HI insult, lactate increases immediately, reaches maximal value at 2–6 hours, and thereafter decreases gradually; in the HIBI model group, lactate is similar to that of the control group at 48–72 hours after HI injury.
MR images and spectra fitted by the LCModel of the control and HIBI groups are shown in Figs 4 and 5.

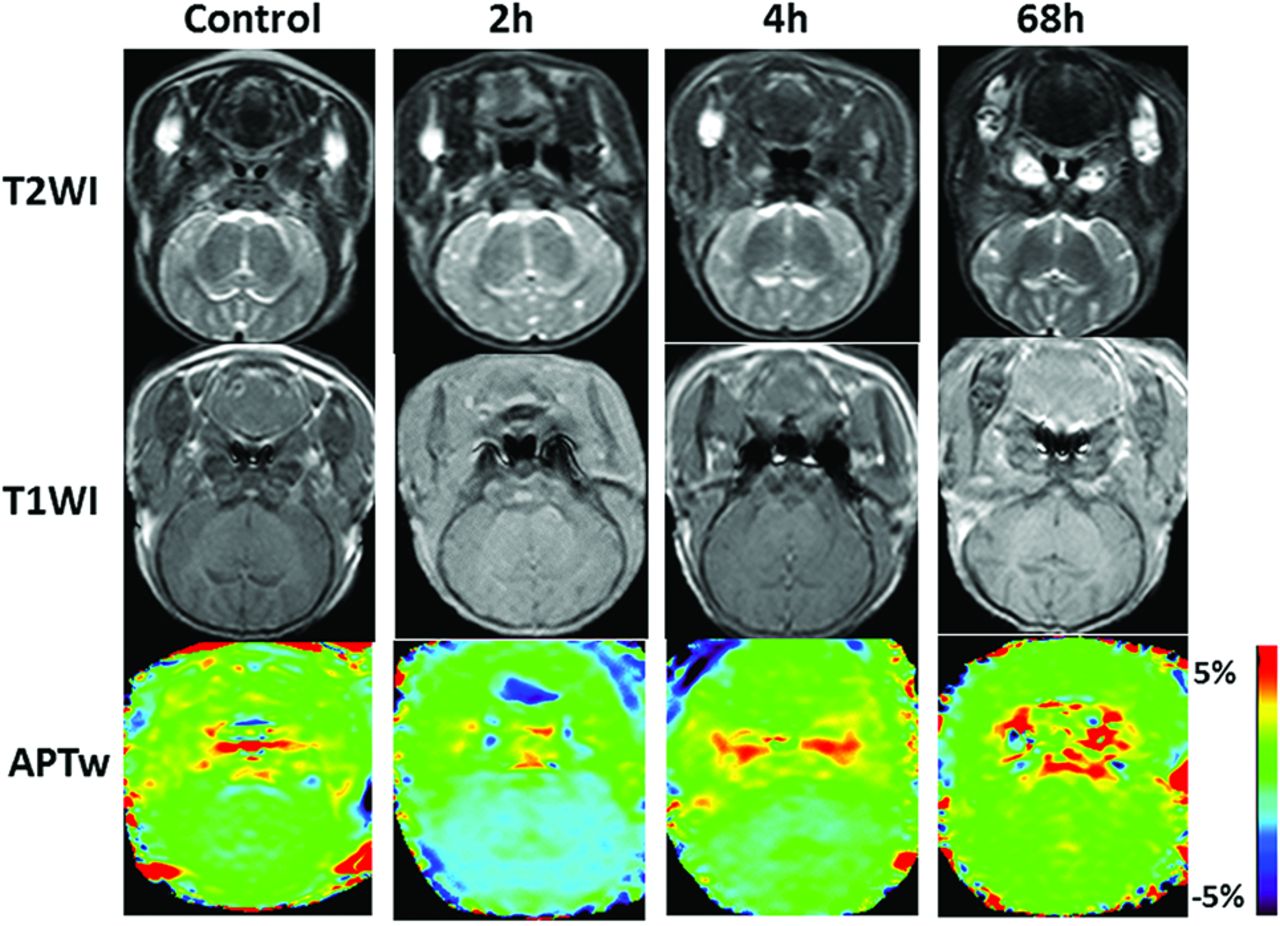
Coronal T1WI, T2WI, and APT scans at the basal ganglia area in the control and the model groups (2 hours, 4 hours, and 68 hours after hypoxia-ischemia reperfusion). The APT signal demonstrates the hypointensity at 2 hours after HI, and then the signal gradually increases.

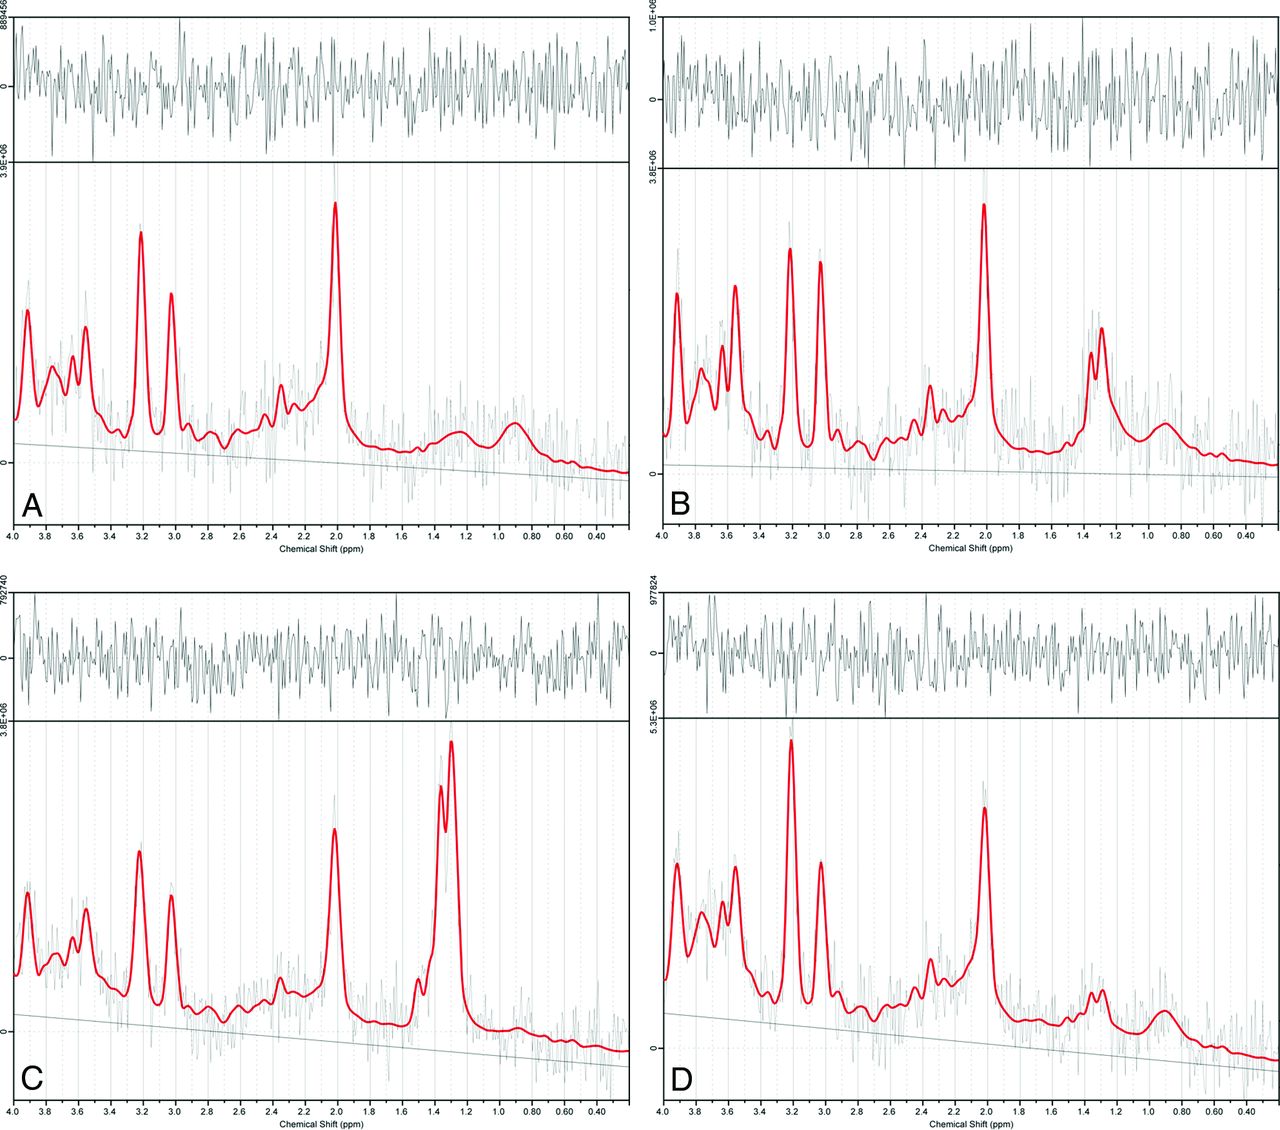
Results of 1H-MR spectroscopy data at selected time points in sample data analyzed by LCModel software. A–D, 1H-MR spectroscopy spectral curves of the right basal ganglia analyzed by LCModel in the control group and the HIBI group at 2 hours, 4 hours, and 68 hours, respectively. At 2 and 4 hours after HI insult, the lactate peaks (1.2–1.4 ppm) are markedly elevated, showing an upright single-peak or double-peak change; at 68 hours, the lactate peak is lower but still higher than that of the control group.
Correlation between APT Values and Lactate Content
Time-related changes of APT values and lactate content are shown in Fig 6. APT values decreased at 0–2 hours and thereafter increased; lactate content continued increasing at 2–6 hours and thereafter trended toward decreasing.

Changes and correlation between APT values and lactate content in basal ganglia of the HIBI model. A, The time-related changes in APTw intensity and lactate content are depicted in the same graph (the red square represents the APTw intensity at each time point; the blue circle denotes the lactate content at each time point). B, The correlation between APTw intensity and lactate content (r = −0.79, P = .036).
As shown by Spearman rank correlation test, the APT values were negatively correlated with lactate content (r = −0.79, P = .036).
Discussion
HIBI is a hypoxic-ischemic brain impairment caused by many factors during the perinatal period and also a type of reperfusion brain injury after HI insult of the whole brain. The brain tissues undergo a series of pathophysiologic changes in the transition from hypoperfusion to reperfusion. Therefore, it is essential to develop a noninvasive neonatal MR imaging examination technique to evaluate molecular pathophysiologic changes of the brain after an HI procedure. In a study of middle cerebral artery occlusion in mouse models, Zhou et al10,26 found a marked change in pH in lesions before and after ischemic insult, but no obvious variation in amide content was found during a short period. The exchange rate decreasing 50%–70% with a pH decrease of 0.5 U supports the application of APT imaging in HI insult.
Our study results showed that after HI injury, APT values trended toward decreasing sharply at first (Table and Fig 2); if it is assumed that the protein content and temperature in the brain remains unchanged for a short period after HI insult, the change of APT signal may be primarily related to pH changes. Such a signal change reflects a reduction of intracellular pH in brain tissues within a short time after HI insult, primarily depending on acidosis secondary to aerobic dysmetabolism caused by HI insult (aerobic dysmetabolism refers to glucose metabolic disturbances, and the acidosis related to HI leads to an increase in anaerobic metabolism; it is not a dysmetabolism of the mitochondria, but a change in cellular processes). Intracellular acidosis is not only caused by lactate accumulation but also attributed to the aerobic dysmetabolism of glucose that occurs in the acute stage of HI insult. Furthermore, the cell membrane is unable to maintain the normal ion pump function that leads to intracellular H+ retention in the early stage of HIBI.10 Subsequently, APT values gradually increased and recovered to the level of the control group at 12–24 hours. Such recovery of APT values is achieved by pH normalization after HI reperfusion, perhaps because locally accumulated metabolites are excreted by reperfusion, accompanied by the restoration of aerobic metabolism. The intracellular pH in mammal brain tissue is 7.2–7.3, and the extracellular pH is 7.3–7.4.27⇓–29 The intracellular pH in HI brain tissue can impact cell survival and brain tissue outcomes. Studies have shown that when brain tissue undergoes HI injury, pH decreases transiently and then increases, inducing rebound alkalosis. Patients with alkalosis have a poor prognosis.30⇓⇓–33 Furthermore, an in vivo trial revealed that neuronal protection could be achieved by timely intervention to treat alkalosis.27
When the brain experiences HI insult, the relevant signaling pathways in astrocytes are activated, and lactate, as an important neurotransmitter, can regulate energy metabolism and secrete neuroprotective substances to achieve neuron protection through a series of biochemical changes and has a regulatory effect on cell apoptosis.34,35 Lactate can be transmitted and absorbed via monocarboxylic acid transporters between astrocytes and neurons to provide the substrate of energy metabolism for neuronal activities.36⇓–38 Thus, lactate produced by glycolysis is transmitted out of astrocytes via monocarboxylic acid transporter-4 on the cell membrane, accumulates in the extracellular spaces, is then absorbed by neurons via monocarboxylic acid transporter-2 on neuronal membranes, is transformed into pyruvic acid via lactate dehydrogenase, and finally enters into the tricarboxylic acid cycle of aerobic metabolism.
An increase of lactate was observed in the early stage of HI insult (Table and Fig 3), which is an important sign of brain hypoxia-ischemia. This finding is consistent with that in a previous study.39 After reperfusion, lactate is gradually decreased due to both aerobic metabolism recovery and lactate excretion.
At the time of acute hypoxia-ischemia, it is assumed that the amide proton concentration and temperature remain constant, and the change of APT value is mainly affected by the pH. This study found that APT values were gradually restored to normal 2 hours after reperfusion; lactate increased in the first 6 hours after reperfusion and gradually decreased thereafter. Moreover, this trend matches those in previous experimental study.12 We also found that there was a relative delay between the peak change in lactate and the lowest peak value of APT, which indicates that the removal of H+ and lactate is not synchronous. This time delay was interpreted as the recovery of pH being earlier than the clearance of lactate after HI reperfusion. Discharge mechanisms of H+ include Na+–H+ exchange and HCO3− neutralization and other mechanisms.27 Thus, a possible reason for the rapid recovery of pH and the relatively slow removal of lactate was that glucose anaerobic glycolysis was conducted continuously after reperfusion and the removal of lactate was first transported out of the cell, and then carried out by the circulation.40,41 Nevertheless, this aspect needs to be further studied.
In this study, the basal ganglia were selected as an ROI for both APT imaging and 1H-MR spectroscopy scanning because the basal ganglia are an area of high aerobic metabolism.42 Such an ROI can increase the sensitivity of biochemical tests and avoid the interference of lipids at the cerebral margin that influences the accurate measurement of lactate content.43
In the present study, there were some limitations: 1) The current APT imaging sequence used single-section imaging, and the coronal images of the basal ganglia were selected in this study, so HI injury of other parts and structures were not displayed and evaluated. 2) Due to limitations of anatomic structures, resolution, and other factors, only the basal ganglia were selected as ROIs, so other cerebral regions (eg, cerebral cortex, subcortical white matter, and hippocampus) were not evaluated. 3) Even though the magnetization transfer ratio asymmetry analysis (which can reduce the direct water saturation effect and semisolid magnetization transfer effect) was used, the APT effect was mixed with the nuclear overhauser enhancement.44 4) Only data from the right basal ganglia were acquired by single-voxel 1H-MR spectroscopy scanning, so bilateral tissues could not be compared and analyzed.
1H-MR spectroscopy data were postprocessed by using LCModel software, which effectively addresses issues such as baseline correction, spectral line decomposition, and accurate measurement of the absolute content of metabolites.45 The LCModel can automatically perform baseline correction, eddy current correction, and phase correction and provide an ideally fit spectral line. The Cramer-Rao Lower Bound estimating produced by the LCModel avoids extensive examination of each spectroscopic image and helps reject low-quality spectra (Fig 4).46 Studies47,48 have suggested that the coefficient of variation of absolute substance content calculated by the LCModel is lower than that for the ratio of metabolites.
In this study, an acute HIBI model was established in piglets, in which the blood supply of the bilateral common carotid arteries was interrupted and then the reperfusion was simulated when the blood supply was restored; it facilitates the investigation of reperfusion injury.49⇓–51 In this study, we simulated neonatal pathophysiologic changes by using a neonatal piglet HIBI model. The basal ganglia injury shown on MR imaging was consistent with histologic changes; therefore, this model is suitable for acute and subacute experimental studies.16,17 The results indicate that this model is suitable for molecular imaging studies. Compared with previous studies with a rat hypoxia-ischemia model,49,52,53 the neonatal pig brain sulcus and gyrus are obvious and similar to the human brain structure. At present, there is no report in the literature describing the use of a piglet hypoxia-ischemia model for APT imaging studies, to our knowledge. Our modeling method has high reproducibility and can provide reliable experimental results, though it is somewhat complex. APT and MR spectroscopy have been measured separately many times in different ischemic models; however, they have not been measured together as in this model. In fact, this relative delay between the peak change in lactate and the APT value is one of the main novel points of our work because it has not previously been observed.
Conclusions
In the present study, the changes in APTw intensity and lactate content show a relative time delay in their recovery stage, indicating that recovery of pH was faster than that of lactate.
Footnotes
This study was supported by the National Natural Science Foundation of China (No. 30570541, 30770632, 81271631).
Indicates open access to non-subscribers at www.ajnr.org
REFERENCES
- Received September 7, 2016.
- Accepted after revision November 6, 2016.
- © 2017 by American Journal of Neuroradiology


Jump to section
Related Articles
Cited By...
- Lactate receptor HCAR1 regulates neurogenesis and microglia activation after neonatal hypoxia-ischemia
- Lower Lactate Levels and Lower Intracellular pH in Patients with IDH-Mutant versus Wild-Type Gliomas
- Expression Changes in Lactate and Glucose Metabolism and Associated Transporters in Basal Ganglia following Hypoxic-Ischemic Reperfusion Injury in Piglets