
Abstract
BACKGROUND AND PURPOSE: Assessing the response to treatment in infiltrative brain tumors by using lesion volume–based response criteria is challenging. We hypothesized that in such tumors, volume measurements alone may not accurately capture changes in actual tumor burden during treatment. We longitudinally evaluated volume changes in both normal-appearing supratentorial white matter and the brain stem lesions in patients treated for diffuse intrinsic pontine glioma to determine to what extent adjuvant systemic therapies may skew the accuracy of tumor response assessments based on volumetric analysis.
MATERIALS AND METHODS: The anatomic MR imaging and diffusion tensor imaging data of 26 patients with diffuse intrinsic pontine glioma were retrospectively analyzed. Treatment included conformal radiation therapy in conjunction with vandetanib and dexamethasone. Volumetric and diffusion data were analyzed with time, and differences between time points were evaluated statistically.
RESULTS: Normalized brain stem lesion volume decreased during combined treatment (slope = −0.222, P < .001) and increased shortly after completion of radiation therapy (slope = 0.422, P < .001). Supratentorial white matter volume steadily and significantly decreased with time (slope = −0.057, P < .001).
CONCLUSIONS: Longitudinal changes in brain stem lesion volume are robust; less pronounced but measurable changes occur in the supratentorial white matter. Volume changes in nonirradiated supratentorial white matter during the disease course reflect the effects of systemic medication on the water homeostasis of normal parenchyma. Our data suggest that adjuvant nontumor–targeted therapies may have a more substantial effect on lesion volume changes than previously thought; hence, an apparent volume decrease in infiltrative tumors receiving combined therapies may lead to overestimation of the actual response and tumor control.
ABBREVIATIONS:
- BL
- baseline
- BS-L
- brain stem lesion
- DIPG
- diffuse intrinsic pontine glioma
- ePFS
- end of PFS
- eRT
- end of RT
- PFS
- progression-free survival
- RT
- radiation therapy
- ST-WM
- supratentorial white matter
- VEGF
- vascular endothelial growth factor
- W
- week
Diffuse intrinsic pontine glioma (DIPG), a diffusely infiltrative high-grade glioma, is the most common brain stem tumor in children. Currently used mainstream therapies for DIPG include conformal radiation and adjuvant steroid therapy, which, in recent years, have been combined with new molecularly targeted agents, including vascular endothelial growth factor (VEGF) inhibitors within the framework of Stage I and/or II clinical trials, but key outcome metrics, such as progression-free survival (PFS) and overall survival, have remained dismal.
As with many other brain tumors, longitudinal evaluation of the response to therapy in clinical trials or care relies heavily on MR imaging. Most clinical trials require 2D or 3D measurements or volumetric evaluation of the tumor to monitor and evaluate the response to treatment with time. Such strategies may be appropriate for discrete tumors, but their adequacy in diffusely infiltrative brain tumors is increasingly questioned because conceptually, the “lesion” seen by imaging does not necessarily correspond to the “tumor within,” but with conventional, anatomic imaging, one can measure only the “lesion.”
In DIPG, radiation therapy (RT) initially results in reduced lesion volume, which is assumed to indicate some degree of tumor control, albeit temporary. Corticosteroids—potent antiedema agents—reduce tumor-induced edema in brain lesions, in general. Anti-VEGF agents may also contribute to apparent volume reduction of tumor lesions by reducing the proportion of angioneogenic, leaky vessels and, hence, interstitial, vasogenic edema.1 It is conceivable that all of these therapeutic measures affect lesion volume reduction, but their respective contributions are undetermined. In this research, we set out to test our hypothesis that volumetric changes in DIPG during treatment may not accurately reflect changes in tumor burden within the apparent brain stem lesion; hence, volumetric analysis in DIPG (and, perhaps, other infiltrative gliomas) may be inadequate for assessing actual tumor response to treatment.
Materials and Methods
Patients
In a prospective Phase I clinical trial (SJBG07, NCT00472017; clinicaltrials.gov) conducted at our institution between June 2007 and August 2009, children with newly diagnosed DIPG were treated with conformal photon radiation therapy and vandetanib (ZD6474, ZACTIMA; AstraZeneca, London, England) in conjunction with adjuvant dexamethasone. The study was approved by our institutional review board. Written, informed consent for participation was obtained from the parents or legal guardians of the patients. Results of this clinical trial have been published.2 For the current research, we requested that the board allow us to retrospectively evaluate some of the clinical, medication, and imaging data collected within the framework of the aforementioned clinical trial. This request, in conjunction with a waiver of repeat consenting, was granted.
Treatment consisted of 3D conformal RT given in 1.8-Gy fractions 5 days/week for 6 weeks, to a total dose of 54 Gy to the brain stem lesion (BS-L) and orally administered vandetanib. The maximum tolerated dose of vandetanib was evaluated by randomizing patients into 1 of 5 strata, with escalating dosage levels of 50 (n = 3), 65 (n = 3), 85 (n = 3), 110 (n = 16), or 145 (n = 10) mg/m2 per day. Vandetanib treatment and RT were started on the same day. Patients were receiving oral dexamethasone as an adjuvant therapy before or on admission to our institution. After admission, dexamethasone was administered as necessary on an individual basis to control neurologic signs and symptoms related to the BS-L, with the goal of reducing or discontinuing use when clinically possible.
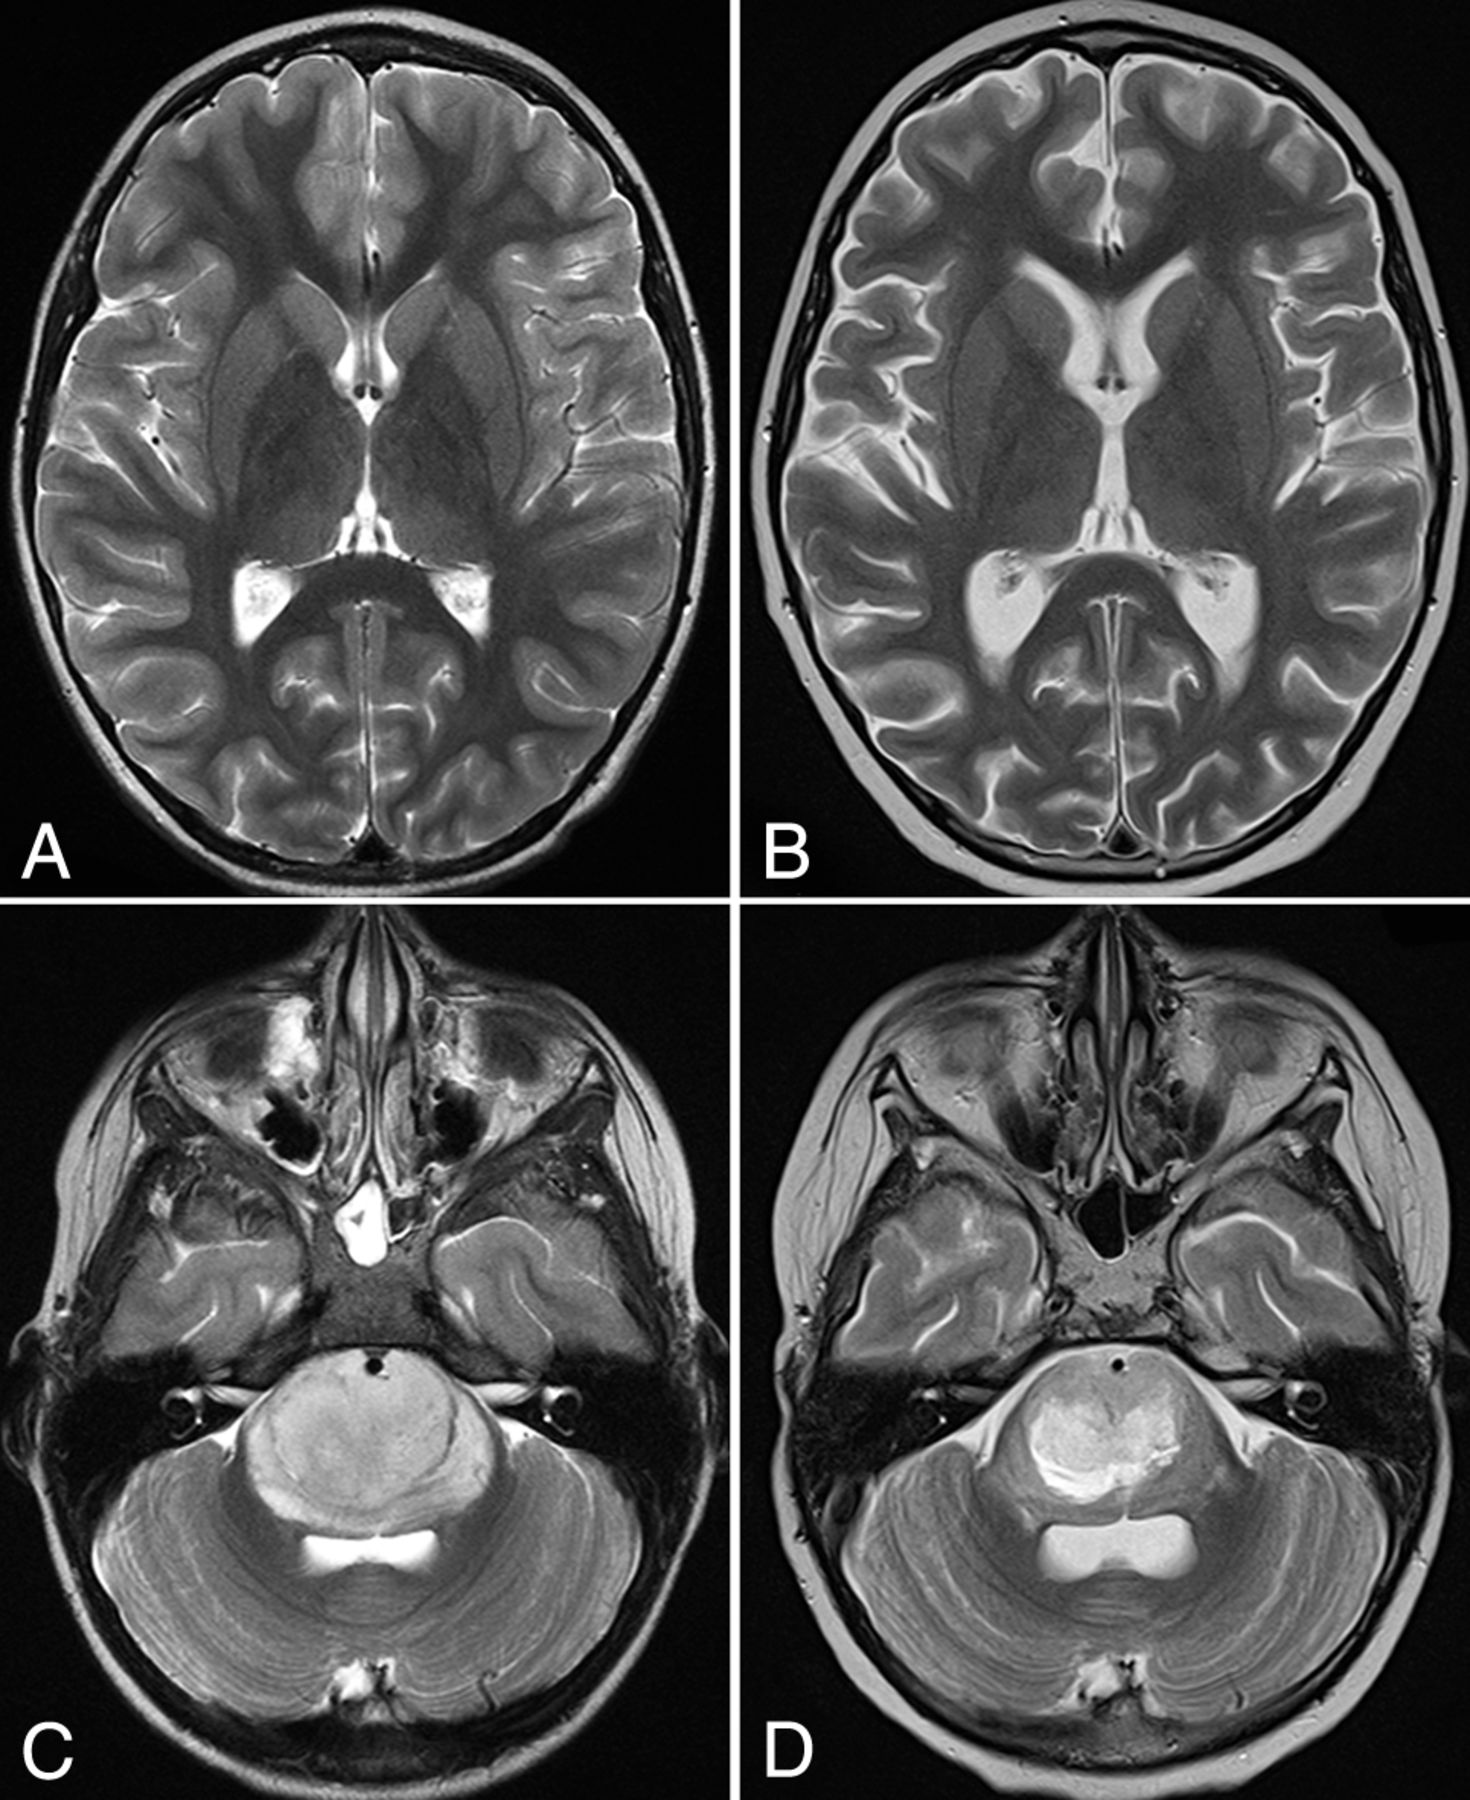
As per protocol stipulations, partial response to treatment was defined as ≥50% reduction in the sum of the product of the maximum perpendicular diameters of the BS-L by MR imaging and a stable or decreasing dose of dexamethasone accompanied by stable or improving neurologic examination findings maintained for at least 6 weeks (Fig 1). PFS was defined as the time interval from the start of therapy to disease progression or death. Progressive disease, indicating the end of PFS, was defined in the protocol as the following: 1) neurologic abnormalities or worsening neurologic status not explained by causes unrelated to tumor progression (eg, seizures, anticonvulsant toxicity, electrolyte disturbances, sepsis), or 2) a >25% increase in the product of the maximum perpendicular diameters of the tumor lesion by imaging, or 3) increasing doses of dexamethasone required to maintain a stable neurologic status. Patients received additional dexamethasone as necessary toward the end of PFS. Seven patients underwent shunt placement during the course of their disease: 6 patients before (mean, 19 days) and 1 patient (3 days) after RT initiation. Hydrocephalus requiring shunting did not develop in other patients during the study period.

Axial T2-weighted images of the supratentorial brain (A and B) and brain stem lesions (C and D) in a patient with DIPG at baseline (A and C) and after RT (B and D). D, Note the prominent brain stem lesion volume reduction in conjunction with less robust but measurable pseudoatrophic changes within the supratentorial brain parenchyma.
Thirty-five patients with newly diagnosed DIPG were enrolled in the aforementioned therapeutic trial. For the current imaging-based research study, inclusion criteria consisted of the following: 1) patients with newly diagnosed DIPG; 2) participation in the therapeutic protocol and completing RT; 3) a complete dataset of conventional, volumetric, and diffusion data for each patient; and 4) patient follow-up with at least 2 consecutive post-RT imaging studies before the end of PFS (see definition above). Consequently, 3 patients were excluded because they were taken off the trial before the completion of RT because of unacceptable, presumably anti-VEGF–related toxicity. Two patients had no follow-up data: One was taken off protocol at the end of RT because of progressive disease, and the guardian of one withdrew consent on the completion of RT. Another 4 patients survived ≥3 years, suggesting that they may not have had a “classic” DIPG; hence, histopathologic and biologic properties of those tumors might not represent typical DIPG. Overall, 26 patients were eligible for enrollment in our retrospective research (10 boys, 16 girls; mean age at the start of RT, 6.55 ± 3.04 years). Relevant patient data are summarized in On-line Table 1.
MR Imaging
MR imaging was performed on either a 3T system (Magnetom Trio Tim; Siemens, Erlangen, Germany) or a 1.5T platform (Magnetom Avanto; Siemens) by using 12-channel matrix head coils. In total, 178 examinations were performed, of which 157 were on the 3T platform. Per protocol requirements, MR imaging examinations were scheduled within 1 week before RT and vandetanib initiation (baseline [BL]); at 1, 3, and 6 weeks (end of RT [eRT]); and every other month (after each vandetanib treatment cycle) until the patient was taken off the study due to progressive disease indicating the end of PFS (ePFS). To maintain consistency between time points of measurements, we considered the initiation of RT as time point zero.
The conventional MR imaging protocol at all time points consisted of whole-brain precontrast sagittal and axial T1W1 gradient-echo and axial T2WI turbo spin-echo sequences. Postcontrast imaging included an axial T1WI gradient-echo sequence and sagittal isotropic 3D MPRAGE and T2WI FLAIR sequences. A section thickness of 4 mm with no gap was used for all 2D acquisitions.
DTI data were acquired by using a double-spin-echo, EPI pulse sequence (TR = 6500–10,000 ms, TE = 100–120 ms, b=0 and 700-1000 s/mm2) applying bipolar diffusion-encoding gradients to reduce gradient-induced eddy currents. Forty or more 3-mm-thick images were acquired in contiguous axial sections to provide whole-brain coverage with a matrix size of 128 × 128 and an FOV of 192–230 mm2.
Image Postprocessing
BS-L segmentation was based on T2 hyperintensity and performed by 1 postprocessing specialist supervised by a board-certified, experienced neuroradiologist. T1WI and FLAIR images were aligned to the T2WI from the same examination by using rigid-body registration from the FMRIB Software Library (FSL; http://www.fmrib.ox.ac.uk/fsl). The segmentations were performed manually by drawing an ROI on every T2WI section containing a lesion, and volume was combined across the stack of images. The T1WI and FLAIR coregistered images were used to differentiate lesions from adjacent CSF when necessary (On-line Figure).
For volumetric analysis of supratentorial white matter (ST-WM), T2WI was registered to the T2WI at BL for each patient with the Rigid Body Tools in FSL. The remaining conventional image sets were then aligned to the T2WI for that patient's space by using the same tools. Brain parenchyma masks were computed and then modified to remove the brain stem and cerebellum volume before performing inhomogeneity correction.3 Finally, the ST-WM volume was segmented by using a Kohonen self-organizing network technique based on T1WI, T2WI, and FLAIR images (On-line Figure).4,5 Repeated measures of ST-WM demonstrated a predicted variance of approximately 2% with these methods.5
DTI data analysis was performed with SPM8 software (http://www.fil.ion.ucl.ac.uk/spm/software/spm12) by using the Diffusion Toolkit (TrackVis; http://www.trackvis.org/dtk) for voxelwise tensor calculations. Each of the 4 acquisitions was aligned to remove eddy-current drift and patient motion before being averaged. Tensor deconvolution was used to calculate tensors and derive the eigenvectors and eigenvalues. Eigenvalues were combined to acquire ADC parametric maps. The b=0 image, the reference for all tensor calculations, was registered to the T2WI from each examination used for ST-WM segmentation by using the Affine Registration Tools in FSL. The ADC output map was aligned to the same space as the BS-L and ST-WM segmentation data by applying this transformation. These registered maps were used to determine the mean ADC for the segmented BS-L and ST-WM. All output data were normalized to BL.
Statistical Analysis
All statistical analyses were conducted by using SAS 9.3 (SAS Institute, Cary, North Carolina). A 2-sided significance level of P < .05 was used for all statistical tests. The changes in volume and ADC measurements between time points were assessed by paired t tests for differences that were normally distributed and by Wilcoxon signed rank tests for differences that were not normally distributed. Normal tests and Q-Q plots were used to assess normality. The false discovery rate method was used to adjust P values for multiple testing.
Linear mixed-effect models were used to describe the patterns of change in volume and ADC measurements with time. The results of pair-wise comparisons between time points, mean response plots with time, and the Akaike information criterion were used to select an optimal mixed-effects model for each measurement. The autoregressive covariance structure was selected to account for the correlation among repeated measurements for all models.
The Wilcoxon rank sum test was used to examine differences in PFS and overall survival between patients with a >50% or ≤50% reduction in volume from baseline.
Results
The mean normalized volume and diffusion values of the BS-Ls and ST-WM are summarized in the Table. In the current study, we longitudinally evaluated volumetric and diffusion changes at 4 distinct clinical time points: at BL, the eRT, 14 weeks (W) from BL (week 14 [W14]), and at the ePFS. The selection of W14 as a time point of measurement was arbitrary, but our data indicated this time as a turning point in the clinical course. Initially, most patients showed clinical and imaging improvement; hence, few patients (2/26) were receiving dexamethasone at that time. Tumor recurrence typically started after W14, and the mean time interval between W14 and ePFS was only 4 ± 3 months.
Volumetric and diffusion measurements of brain stem lesions and supratentorial white mattera
On the basis of these data, key clinical events, and results of our statistical analysis, we established 3 phases of the evaluation period: Phase I (BL-eRT), Phase II (eRT-W14), and Phase III (W14-ePFS) (Fig 2). Phase I was the combined treatment period (RT, vandetanib for all patients, and dexamethasone for most). The number of patients receiving dexamethasone at baseline and at the eRT was 21 and 16, respectively. Phase II indicates the early post-RT period during which patients continued to receive vandetanib and dexamethasone; however, dexamethasone was gradually reduced, and by W14, only 2 patients were still receiving treatment. Phase III was the late post-RT follow-up period leading to the ePFS and patient drop-off from the protocol; it also corresponded to the end of vandetanib administration. Dexamethasone was re-administered as necessary for progressive disease (4/23 patients received dexamethasone by the ePFS time point). Patient medication data at each time point are summarized in On-line Table 2.
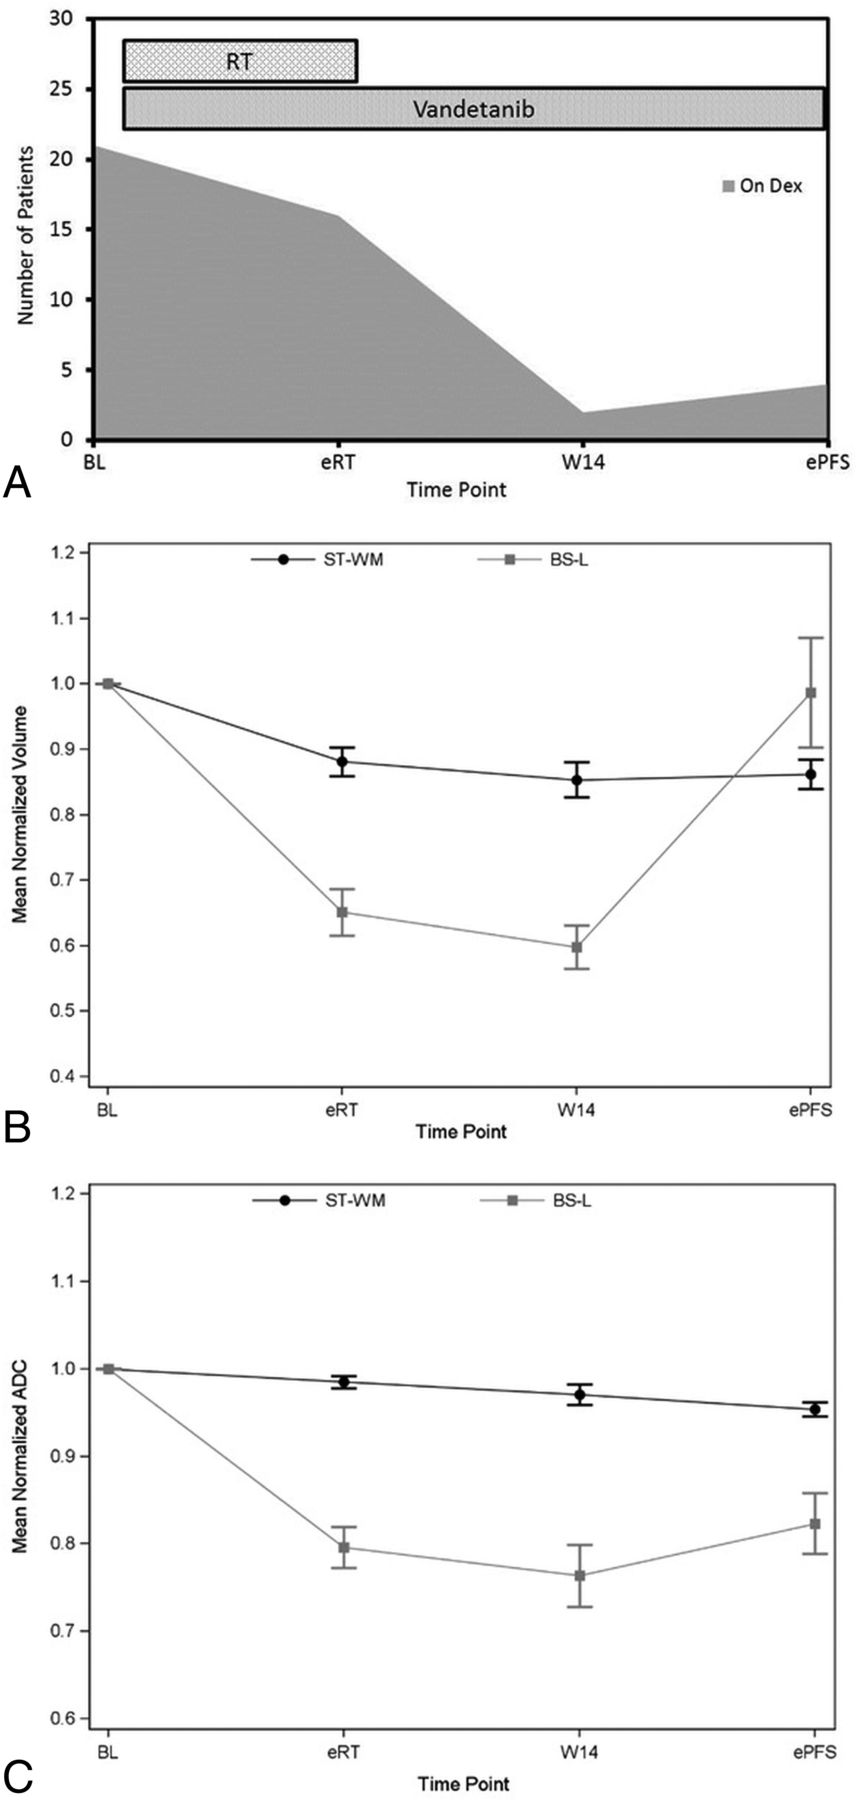
A, Treatment duration and number of patients receiving corticosteroids at each time point. Radiation therapy and vandetanib were started on the same date, approximately 1 week from baseline. Longitudinal volumetric (B) and diffusion (C) changes (mean ± standard error) of the brain stem lesion and supratentorial white matter.
In terms of response to treatment, 12/26 patients (46%) had >50% BS-L volume reduction during the therapeutic trial: 5 at the eRT, 3 by W14, and 4 before the ePFS, hence meeting the criterion of partial response as assessed by imaging. However, when we subtracted the volume-reduction percentage of the ST-WM from that of the BS-L for each patient, only 2 had a “net” or “adjusted” volume decrease of the BS-L of >50% (both of those during Phase II) (On-line Table 3).
Volumetric changes of the BS-Ls and ST-WM were analyzed in each phase along with changes in the ADC values. Figure 2 shows longitudinal volumetric and diffusion changes and the treatment scheme applied in each phase.
Overall, the normalized BS-L volume decreased during Phases I and II (slope = −0.222, P < .001) and increased in Phase III (slope = 0.422, P < .001). The normalized ST-WM volume decreased with time (slope = −0.057, P < .001). Similarly, the normalized ST-WM ADC decreased with time (slope = −0.015, P < .001), and the normalized BS-L ADC decreased during Phases I and II (slope = −0.125, P < .001) and increased in Phase III (slope = 0.069, P = .02).
Regarding volumetric and diffusion changes between time points in Phase I, paired t test comparisons revealed a statistically significant decrease in BS-L and ST-WM normalized volumes (P < .001) and in the normalized BS-L ADC (P < .001). No significant changes were observed in either BS-L or ST-WM normalized volumes during Phase II; however, the Wilcoxon signed rank test showed a significant decline in the normalized BS-L ADC (P = .029). In Phase III, normalized BS-L volume and ADC increased significantly (P < .001 and P = .029, respectively). No significant differences were observed in normalized ST-WM volume or ADC between these time points.
We further analyzed our data to determine whether the magnitude of maximal “unadjusted” volume reduction (>50% or <50%) during the monitored course of disease correlated with standard outcome metrics, notably PFS and overall survival. There were no statistically significant differences in PFS and overall survival between patients with a >50% and ≤50% reduction in unadjusted BS-L volume from BL (On-line Table 4).
Our data also showed that at ePFS, only 11 patients had BS-L volumes greater than the corresponding BL volumes and only 4 of those had a volume increase of >25%. In most patients (56%), the BS-L was still smaller at the ePFS than at BL, despite clinical and/or neurologic signs of disease deterioration (On-line Table 5). Altogether, 21 patients (84%) either did not have BS-L volume increases at the ePFS compared with BL or had an increase of <25% (On-line Table 5).
Discussion
According to published data from the Pediatric Brain Tumor Consortium, children with DIPG having >25% decrease in tumor volume (and ADC) after RT have a higher 6-month survival rate than those without such decreases, but the reasons are still unclear.6 Our data, with >50% volume decrease as the threshold, do not support this observation.
In our cohort, almost half of the patients experienced a volume reduction of >50% of the BS-L sometime during the course of their disease; yet, the ultimate outcome remains uniformly dismal. In this study, we showed that apart from the significant volume changes within the tumor lesion itself, measurable and non-negligible volume changes may also be induced in remote normal brain parenchyma, which is not directly targeted by RT; therefore, those changes likely develop in response to systemic medication used during treatment, particularly corticosteroids, which cause well-known, reversible pseudoatrophic changes in the brain.
In recent years, molecularly targeted treatments for adult high-grade gliomas have generated considerable interest.7,8 Vandetanib, the anti-VEGF agent used in our clinical trial, is a tyrosine kinase receptor inhibitor that may inhibit VEGF receptor-2 tyrosine kinase activity and shows additional inhibitory activity against the Ret proto-oncogene tyrosine-protein kinase receptor and the epidermal growth factor receptor in isolated enzyme assays.8 By targeting VEGF, a promoter of angiogenesis that leads to the “haphazard” formation of deficient, new vessels in response to tissue hypoxia, anti-VEGF agents may indirectly decrease fluid leakage into the interstitial space, reducing peritumoral edema in synergy with corticosteroids by reducing the number of defective, leaky vessels.9,10 The effect of anti-VEGF agents, including vandetanib, on normal vessels (and brain parenchyma) is unclear.
In the present study, the progressive decrease of the normalized ST-WM volume with time was evident. Similarly, although on a larger scale, normalized BS-L volume decreased until approximately 2 months following RT completion, after which BS-L volumes started to increase again, presumably due to commencing tumor recurrence. The BS-L responded well to treatment during Phase I. Normalized ADC values of the lesion decreased during this phase, likely indicating contraction of the intratumoral extracellular water compartments in response to synergistic effects of the various treatments. According to protocol requirements, vandetanib levels were kept constant in each patient stratum, contrary to dexamethasone, which was initially given at higher doses and gradually tapered off as the lesion size decreased and the patient's clinical signs and symptoms improved.2 Vandetanib may not substantially reduce volume during Phase I because pharmacokinetic studies have shown that therapeutic blood levels of vandetanib are reached after approximately 45 days (6.5 weeks) in adults and, presumably, in pediatric patients as well.2,11 Hence, by the eRT (6 weeks), vandetanib may not have reached a steady-state blood level that would be sufficient to substantially affect intratumoral edema and, thus, BS-L volume size. Hence, the pronounced volumetric changes in the BS-L during Phase I are likely due to a combination of tumor control by RT and the removal of vasogenic edema by dexamethasone.
Volume changes were also evident in ST-WM as early as Phase I, even though the supratentorial brain was largely outside the radiation field. On the basis of test simulations, approximately 20%–25% of the supratentorial brain (mainly the posterior temporal and the occipital lobes) in patients treated for DIPG receives radiation doses higher than 20 Gy. Therefore, volume decreases of the ST-WM reflect the effect of systemically administered dexamethasone on the normal cerebral parenchyma, especially because no regional differences in pseudoatrophic changes were seen between the “irradiated” and the “nonirradiated” brain regions. For the above-mentioned reasons, vandetanib is not expected to substantially affect ST-WM. The decreasing ADC values in ST-WM may indicate that water is removed, resulting in contraction of the interstitial space in the brain during Phase I. In our patients, no clinical or MR imaging finding suggested that the volume decrease in ST-WM would be indicative of any drug-induced myelinotoxicity.
As expected, the trend toward volume and ADC reduction of the BS-L continued in Phase II after RT completion, most probably due to the sustained effects of RT on the BS-L and the ongoing, potentially synergistic effect of dexamethasone and vandetanib. During this phase, dexamethasone was gradually reduced, and by the end of W14, most patients were taken off therapy. Therefore, the decreased rates may reflect decreasing corticosteroid use, suggesting that the delayed effects of RT and vandetanib may not be sufficient to sustain control of edema. Nevertheless, it is unclear which treatment component has the dominant effect on tumor volume reduction during Phase II. Normalized ST-WM volume also decreased at a slower rate, again, most likely due to weaker dexamethasone effects. The steady decrease of ADC values in ST-WM indicates further contraction of the interstitial water compartments in normal brain parenchyma.
In Phase III, BS-L volume progressively increased despite sustained vandetanib therapy, indicating early signs of tumor recurrence. ADC values gradually increased, suggesting a rebound of edema due to an increasing tumor burden.
Unlike in BS-Ls, volume in ST-WM minimally increased during Phase III at the group level. Because anti-VEGF was continuously given, the only factor inducing this change is probably the discontinuation of dexamethasone for most patients and slow remigration of water back to the ST-WM, leading to a modest re-expansion of the interstitial space. Such reversible brain atrophy due to medication-induced effects has been documented in clinical studies. For example, corticosteroid-induced brain volume changes occur in patients with multiple sclerosis, with researchers showing that brain fractional volumes return to baseline values 1–2 months after treatment.12,13 Reversible changes in the brain also occurred in a cohort of patients with alcohol dependence under detoxification.14,15 Similarly, reversal of pseudoatrophic brain changes and cognitive improvement have been associated with discontinuation of drug therapy in epilepsy.16 All studies accentuated the confounding dynamics of water shifts induced by drugs or other substances in the brain parenchyma, without a concomitant effect on histoarchitectural integrity.
Because the vandetanib dose level was fixed in each stratum, the only robust variable in patients was the presence or absence of dexamethasone. Our results show that corticosteroids may induce measurable volume changes not only in the BS-L but also in the ST-WM volume. This finding is quite remarkable because it clearly indicates that corticosteroids are powerful water-volume regulators not only in pathologic but also in normal tissues. The potential practical implication of this finding is that tumor volume reduction induced by drugs without a direct antitumoral effect (ie, corticosteroids and anti-VEGF drugs in our study) may be potentially misinterpreted as a partial response during treatment or follow-up when volume reduction exceeds 50%. This overestimation occurred in almost 50% of our patients. Hence, observed changes in DIPG “lesion volume” during treatment and the associated T2 normalization may not be reliable indicators of effective tumor control. Therefore, reliable appreciation of the actual antitumor effect (or lack thereof) of current or future antitumoral drugs in treating DIPG (or other diffusely infiltrative gliomas) in patients who receive corticosteroids may not be possible.
For the whole patient cohort, an overall mean 20% decrease of ST-WM volume was seen, though the ST-WM was largely unexposed to radiation. Assessing how much BS-L volume reduction was induced by RT itself is not feasible, but one may assume that at least 20% of the change is due to concurrent “drug therapy” as seen in the ST-WM. This percentage, however, may be even higher because steroids and anti-VEGF drugs may have a more robust effect on edematous tissue than on normal parenchyma. This notion is supported by our clinical observations suggesting that DIPGs presenting markedly increased T2 signal intensity at diagnosis respond better to therapy, likely due to the presence of more easily “treatable” intratumoral edema. We took advantage of the available data and calculated an “adjusted” volume decrease for the BS-L, after which only 2 patients had a volume reduction of >50%. However, only 4 patients had a volume increase of >25% at the ePFS. These data suggest that both the −50% and the +25% thresholds have poor correlation with clinical reality and are inadequate for partial response and progressive disease determinations. This finding is in keeping with reports showing that advanced MR imaging techniques, such as proton MR spectroscopy, show little, if any, improvement in the metabolic profile of lesions, even during apparent volume reduction of the tumor.17,18
In DIPG, the T2 hyperintense area corresponds to the extent of vasogenic edema, which is induced by the tumor within through a mechanism (eg, development of leaky, angioneogenetic vessels) promoting the influx of excess water from the intravascular compartment to the intralesional interstitial compartment. In practical clinical terms, the T2 hyperintense area is likely an inaccurate representation of the actual tumor burden. Consequently, temporal variations of the T2 hyperintense lesion volume during the disease are probably inadequate to monitor therapy- or disease progression–related changes in tumor burden because non-negligible portions of those volume variations may reflect bulk water shifts to and from the lesion area. This situation would be particularly concerning in clinical trials.
The Response Assessment in Neuro-Oncology working group has developed response criteria in adult high-grade gliomas. Although most clinical trials adopt the Response Assessment in Neuro-Oncology criteria,19 the validity and appropriateness of these schemes for pediatric patients require further studies. Pediatric brain tumors present with unique challenges that may require adjustment of imaging criteria; however, a “one size fits all” strategy may not be the right answer.19,20 It is unlikely that a universal, standard set of response criteria would be suitable for all types of pediatric brain tumors, including embryonal tumors, infiltrative gliomas, and focal gliomas, due to inherently different histoarchitectural features and tumor-host relationships. Advanced, quantitative MR imaging data may more directly capture key biologic or pathophysiologic tumor properties: indeed, perfusion and spectroscopic data reportedly have potential prognostic value in DIPG.21,22 A recent study also demonstrated that diffusion measurements could be used as noninvasive biomarkers to differentiate distinct subgroups of DIPG and select patients for clinical trials.23 Nonetheless, the possibility of incorporating advanced MR imaging techniques (perfusion imaging DTI, MR spectroscopy) in response assessment schemes for childhood brain cancer is still under evaluation.
Overall, shortcomings of anatomic MR imaging in reflecting actual tumor burden in cerebral neoplasms at diagnosis and during treatment are increasingly recognized, especially in cases of diffusely infiltrative high-grade gliomas, such as DIPG. Identifying surrogate biomarkers other than volume-based measures that can accurately predict or measure tumor response to treatment is crucial to effectively managing DIPG or other infiltrative tumors in clinical care and in drug trials.
Conclusions
Our data suggest that volumetric measurements of the brain stem lesion defined by the T2/FLAIR hyperintense area, which are commonly used in clinical trials for DIPG, may not be appropriate to assess response to treatment. There is an obvious need for robust, standardized, reproducible, and quantitative imaging biomarkers to accurately monitor therapy-induced changes in infiltrative brain tumors, including DIPG.
Acknowledgments
The authors thank Dr Cherise Guess of the Department of Scientific Editing at St. Jude Children's Research Hospital for editing the manuscript and Edwina Anderson for data management.
Footnotes
Disclosures: Zoltan Patay—RELATED: Grant: National Institutes of Health, Comments: Cancer Center Support grant P30 CA 21765*. *Money paid to the institution.
This work was supported by the US National Institutes of Health Cancer Center Support grant (P30 CA21765) and by the American Lebanese Syrian Associated Charities.
Indicates open access to non-subscribers at www.ajnr.org
References
- Received October 2, 2016.
- Accepted after revision January 26, 2017.
- © 2017 by American Journal of Neuroradiology


Jump to section
Related Articles
Cited By...
- No citing articles found.