
Abstract
BACKGROUND AND PURPOSE: Shutter-speed model analysis of dynamic contrast-enhanced MR imaging allows estimation of mean intracellular water molecule lifetime (a measure of cellular energy metabolism) and volume transfer constant (a measure of hemodynamics). The purpose of this study was to investigate the prognostic utility of pretreatment mean intracellular water molecule lifetime and volume transfer constant in predicting overall survival in patients with squamous cell carcinomas of the head and neck and to stratify p16-positive patients based upon survival outcome.
MATERIALS AND METHODS: A cohort of 60 patients underwent dynamic contrast-enhanced MR imaging before treatment. Median, mean intracellular water molecule lifetime and volume transfer constant values from metastatic nodes were computed from each patient. Kaplan-Meier analyses were performed to associate mean intracellular water molecule lifetime and volume transfer constant and their combination with overall survival for the first 2 years, 5 years, and beyond (median duration, >7 years).
RESULTS: By the last date of observation, 18 patients had died, and median follow-up for surviving patients (n = 42) was 8.32 years. Patients with high mean intracellular water molecule lifetime (4 deaths) had significantly (P = .01) prolonged overall survival by 5 years compared with those with low mean intracellular water molecule lifetime (13 deaths). Similarly, patients with high mean intracellular water molecule lifetime (4 deaths) had significantly (P = .006) longer overall survival at long-term duration than those with low mean intracellular water molecule lifetime (14 deaths). However, volume transfer constant was a significant predictor for only the 5-year follow-up period. There was some evidence (P < .10) to suggest that mean intracellular water molecule lifetime and volume transfer constant were associated with overall survival for the first 2 years. Patients with high mean intracellular water molecule lifetime and high volume transfer constant were associated with significantly (P < .01) longer overall survival compared with other groups for all follow-up periods. In addition, p16-positive patients with high mean intracellular water molecule lifetime and high volume transfer constant demonstrated a trend toward the longest overall survival.
CONCLUSIONS: A combined analysis of mean intracellular water molecule lifetime and volume transfer constant provided the best model to predict overall survival in patients with squamous cell carcinomas of the head and neck.
ABBREVIATIONS:
- CRT
- chemoradiation therapy
- DCE-MRI
- dynamic contrast-enhanced MR imaging
- HNSCC
- squamous cell carcinomas of the head and neck
- HPV
- human papillomavirus
- HR
- hazard ratio
- Ktrans
- volume transfer constant
- OS
- overall survival
- τi
- mean intracellular water molecule lifetime
Patients with squamous cell carcinomas of the head and neck (HNSCC) are usually associated with a poor prognosis, and the presence of metastatic lymph nodes is considered a negative prognostic indicator.1 Consequently, there is an unmet need to understand the tumor biology to improve clinical management.
Dynamic contrast-enhanced MR imaging (DCE-MRI) allows estimation of volume transfer constant (Ktrans),2,3 an efflux rate constant of gadolinium-based contrast agent from the intravascular compartment to tumor interstitium. The potential of pretreatment Ktrans in predicting short-term response4⇓⇓–7 as well as overall survival (OS) in patients with HNSCC has been reported.8,9 Patients treated with chemoradiation therapy (CRT) and with high baseline Ktrans from metastatic nodes were associated with an improved prognosis compared with patients with low baseline Ktrans.8,9 In addition to Ktrans, shutter-speed model analysis of DCE-MRI derives a novel imaging biomarker known as mean intracellular water lifetime (τi),10⇓–12 which has been suggested to be a metabolic marker.12 The unique strength of τi lies in the fact that it is less sensitive to arterial input function scaling variations than Ktrans,13 indicating that τi is a more reproducible and reliable marker. The parameter τi has been used to characterize breast,14 prostate,15,16 esophageal,17 and hepatocellular cancer.18 A recent study19 also demonstrated the prognostic utility of τi in predicting survival in patients with hepatocellular carcinomas.
Although Ktrans reflects tumor perfusion and vascular permeability,3 τi provides unique information related to tumor cell characteristics such as cell size, cell membrane permeability, and cellular metabolic activity.12 Given that Ktrans and τi provide complementary information about the tumor microenvironment, we believe that a combined analysis may be more useful than individual parameters in predicting prognosis in patients with HNSCC.
Thus, the purpose of the present study was to assess the prognostic value of pretreatment τi and Ktrans in predicting OS in patients with HNSCC. In addition, in a subset of patients, we explored the prognostic potential of τi and Ktrans in p16-associated HNSCC given the fundamental differences in tumor biology and prognosis of these patients.20⇓–22
Materials and Methods
Patients
This retrospective analysis of pre-existing imaging and clinical data was institutional review board–approved and was compliant with the Health Insurance Portability and Accountability Act. On the basis of previous CT/MR imaging reports, all patients were assessed for the presence of at least 1 metastatic cervical lymph node measuring >1 cm3 and biopsy-proved histopathologic diagnosis of HNSCC. The exclusion criteria included prior CRT or a history of cancer other than HNSCC. A total of 72 patients with newly diagnosed HNSCC met the inclusion criteria and were recruited between January 2005 and August 2009. TNM staging was used to determine the disease status. Each patient received appropriate therapy to deliver the maximum clinical benefit, which included upfront neck dissection (n = 3), concurrent CRT (n = 46), or induction chemotherapy followed by CRT (n = 23). Three patients who underwent upfront neck dissection and 9 patients who had either corrupted MR imaging data or insufficient clinical data were excluded from the data analysis. Therefore, OS analyses were performed on the remaining 60 patients (mean age ± SD, 62.34 ± 9.18 years; 49 men, 11 women). Tumor location and staging from these patients at the initial presentation are summarized in the Table.
Patient characteristics and treatment modalities
Data Acquisition
All patients underwent MR imaging before surgery and CRT on a 1.5T Sonata scanner (Siemens, Erlangen, Germany; n = 37) or on a 3T Magnetom Trio scanner (Siemens; n = 35). Structural imaging included axial T2-weighted and T1-weighted images with standard parameters. Inversion-recovery–prepared T1-weighted images were acquired by using TIs of 60, 200, 400, 800, and 1600 ms before the acquisition of DCE-MRI data for T1 quantification.
As described previously,5 DCE-MRI was performed by using a rapid 3D-spoiled gradient-echo sequence modified to acquire 8 angle-interleaved subaperture images from the full-echo radial data.23 Imaging parameters were: TR, 5.0 ms; TE, 4.2 ms; 256 readout points per view; 256 views (32 views per subaperture, 8 subapertures); field of view, 260 × 260 mm2; number of sections, 8; section thickness, 5 mm. Fat saturation was applied once every 8 excitations. Spatial saturation was applied once every 32 excitations to minimize the flow effect while minimizing acquisition time. This scheme resulted in a temporal resolution of 2.5 seconds for each subaperture image with full spatial resolution of 256 × 256 by using a dynamic k-space–weighted image reconstruction contrast algorithm.
Image Processing
All images (T2, T1, postcontrast T1-weighted, and DCE-MRI) were coregistered by using a 2-step nonrigid image registration technique.5 The ROIs were drawn on the solid portion of the largest nodal mass by using anatomic images. Care was taken to avoid necrotic/cystic or hemorrhagic parts as well as surrounding blood vessels. Pharmacokinetic analysis of DCE-MRI data was performed for each voxel in the selected ROIs by using a shutter-speed model.5,10 Estimation of arterial input function was performed semiautomatically from an ROI on one of the carotid arteries located near the metastatic lymph node.5,10 Median pretreatment τi and Ktrans were computed by using only the central 4 sections to avoid erroneous results from wraparound artifacts in the edge sections.
Clinical Follow-Up and Data Analysis
The clinical follow-up period was measured from the end date of CRT to the date of death for deceased patients or to the date of last observation for surviving patients.
Median pretreatment τi and Ktrans values were 0.125 seconds and 0.409 minutes−1, respectively, and were used as thresholds to divide patients into 2 groups (at or above and below the threshold value). Patients in the high τi group had a mean ± SD τi of 0.276 ± 0.086 seconds and a median of 0.269 seconds. Patients in the low τi group had a mean ± SD τi of 0.070 ± 0.028 seconds and a median of 0.071 seconds. Similarly, patients in the high Ktrans group had a mean ± SD Ktrans of 0.90 ± 0.54 minutes−1 with a median of 0.88 minutes−1, whereas patients in the low Ktrans group had a mean ± SD Ktrans of 0.188 ± 0.108 minutes−1 and a median of 0.196 minutes−1.
Using the 2-year (short-term), 5-year (intermediate-term), and all available follow-up (long-term [median, 7.83 years; range, 0.07–10.7 years]) as clinical end points, OS was analyzed. In addition to using τi and Ktrans as independent predictors, combinations of these parameters (high τi/high Ktrans, high τi/low Ktrans, low τi/high Ktrans, and low τi/low Ktrans) were used. Kaplan-Meier survival curves were plotted and compared by using log-rank tests. Using a Cox regression model, hazard ratios (HRs) of deaths and associated 95% CI were estimated for τi and Ktrans first separately, and then for the different combinations of these parameters (high τi/high Ktrans, high τi/low Ktrans, low τi/high Ktrans, and low τi/low Ktrans). In addition, a Wald test was performed to evaluate the joint effect of these combinations. A P value <.05 was considered significant. All data analyses were performed by using SPSS for Windows version 18.0 (IBM, Armonk, New York).
Stratifying HPV/p16-Positive and p16-Negative Patients
Human papillomavirus (HPV) status was determined from tissue specimens by immunohistochemical evaluation of p16 expression by using a commercially available monoclonal antibody. Tissue samples were available from only 32 patients, and these were divided into 2 groups: positive (n = 21) or negative (n = 11) for p16 expression.24 There were no significant differences (P > .05) in age, treatment regimen, τi, and Ktrans between patients who had and those who did not have tissue specimens for p16 expression. Using p16 as an independent variable, OS analyses were performed from these 32 patients. To further stratify p16-positive and p16-negative patients, separate OS analyses were performed by using τi and Ktrans as independent variables and by using combinations of these parameters.
Results
Representative anatomic images and τi and Ktrans maps from a patient who was alive by the last date of observation with a follow-up duration of 8.19 years and from a patient who died 2.12 years after the end of CRT are shown in Figs 1 and 2, respectively. In the first 2-year follow-up period, 13 of 60 patients died of the disease. In 5 years, the number of deceased patients was 17, whereas a total of 18 patients died by the last date of observation. The median follow-up for surviving patients (n = 42) was 8.32 years (range, 5.42–10.7 years).
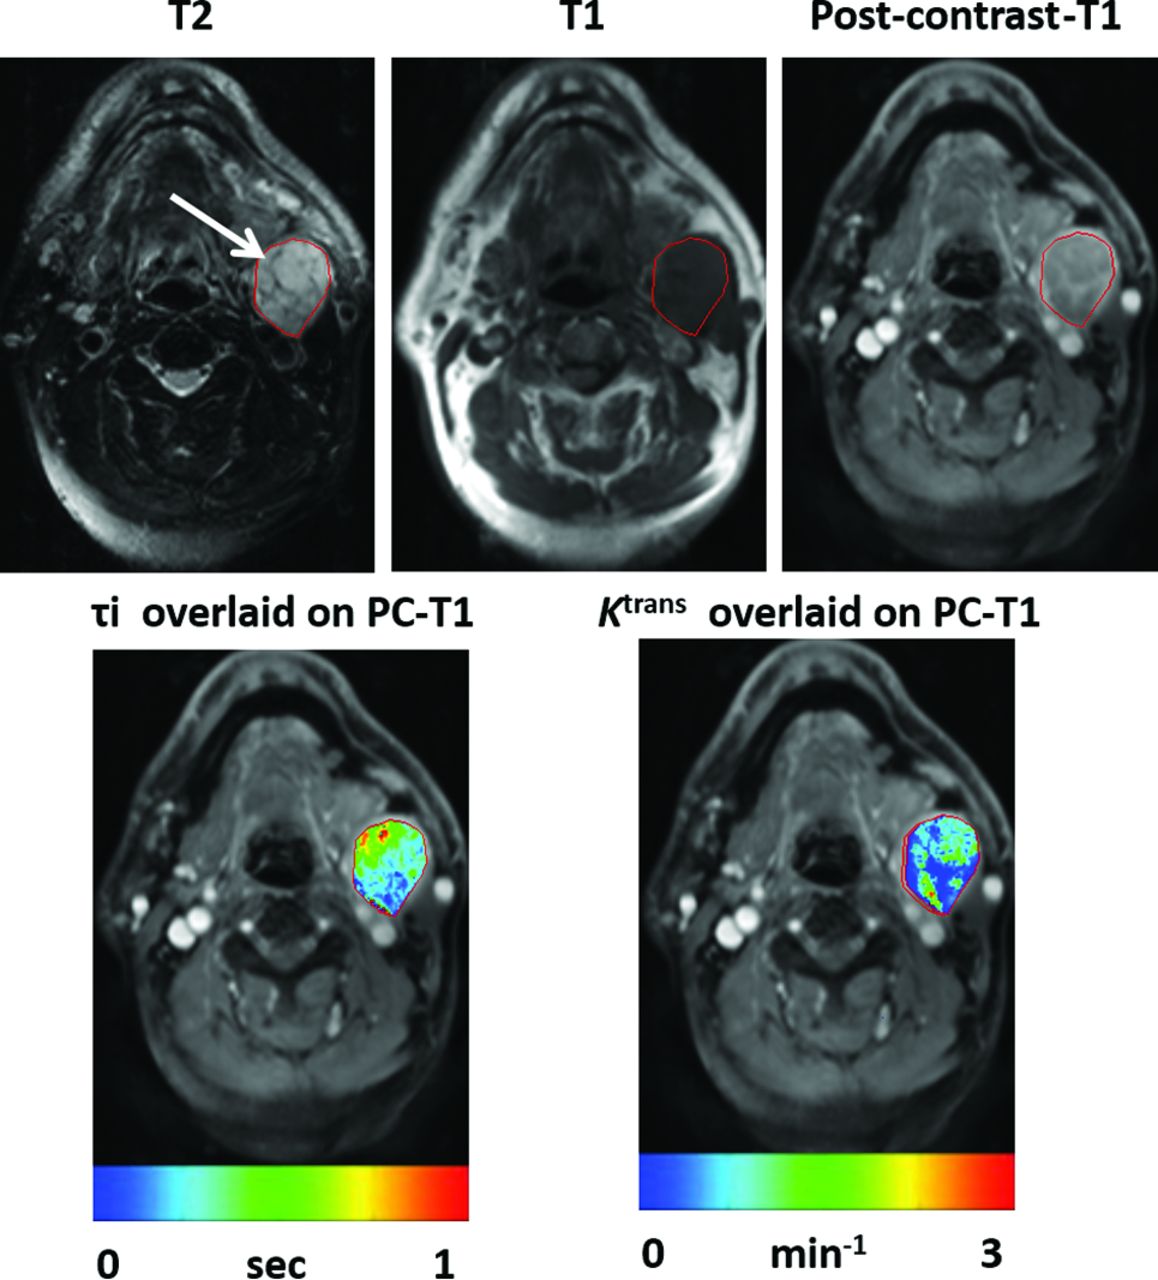
Representative images from a patient exhibiting long survival (follow-up duration of 8.19 years). Axial T2-weighted image (A) demonstrates an enlarged heterogeneous hyperintense metastatic left level IIa lymph node (arrow). This appears hypointense on a coregistered T1-weighted image (B), with heterogeneous enhancement on the corresponding postcontrast T1-weighted image (C). DCE-MRI–derived τi (0.136 seconds [D]) and Ktrans (0.882 minutes−1 [E]) maps are shown as color images overlaid on postcontrast T1-weighted images.

Representative images from a patient who died 2.12 years after the end of CRT. Axial T2-weighted image (A) demonstrates a heterogeneous hyperintense metastatic left level IIb lymph node (arrow). It appears hypointense on a coregistered T1-weighted image (B) with heterogeneous enhancement on postcontrast T1-weighted image (C). DCE-MRI–derived τi (0.031 seconds; [D]) and Ktrans (0.135 minutes−1 [E]) maps overlaid on postcontrast T1-weighted images demonstrating lower τi and Ktrans values from the node compared with the patient with longer survival as shown in Fig 1.
Prognostic Utility of τi
In the first 2 years, a trend toward longer OS was noted for patients with higher τi (4 deaths) compared with those with lower τi (9 deaths; log-rank P = .09). The probability for survival in patients with high τi was 86.7% (95% CI, 68.3%–94.8%), whereas it was 70% (95% CI, 60.3%–83.1%) for patients with low τi.
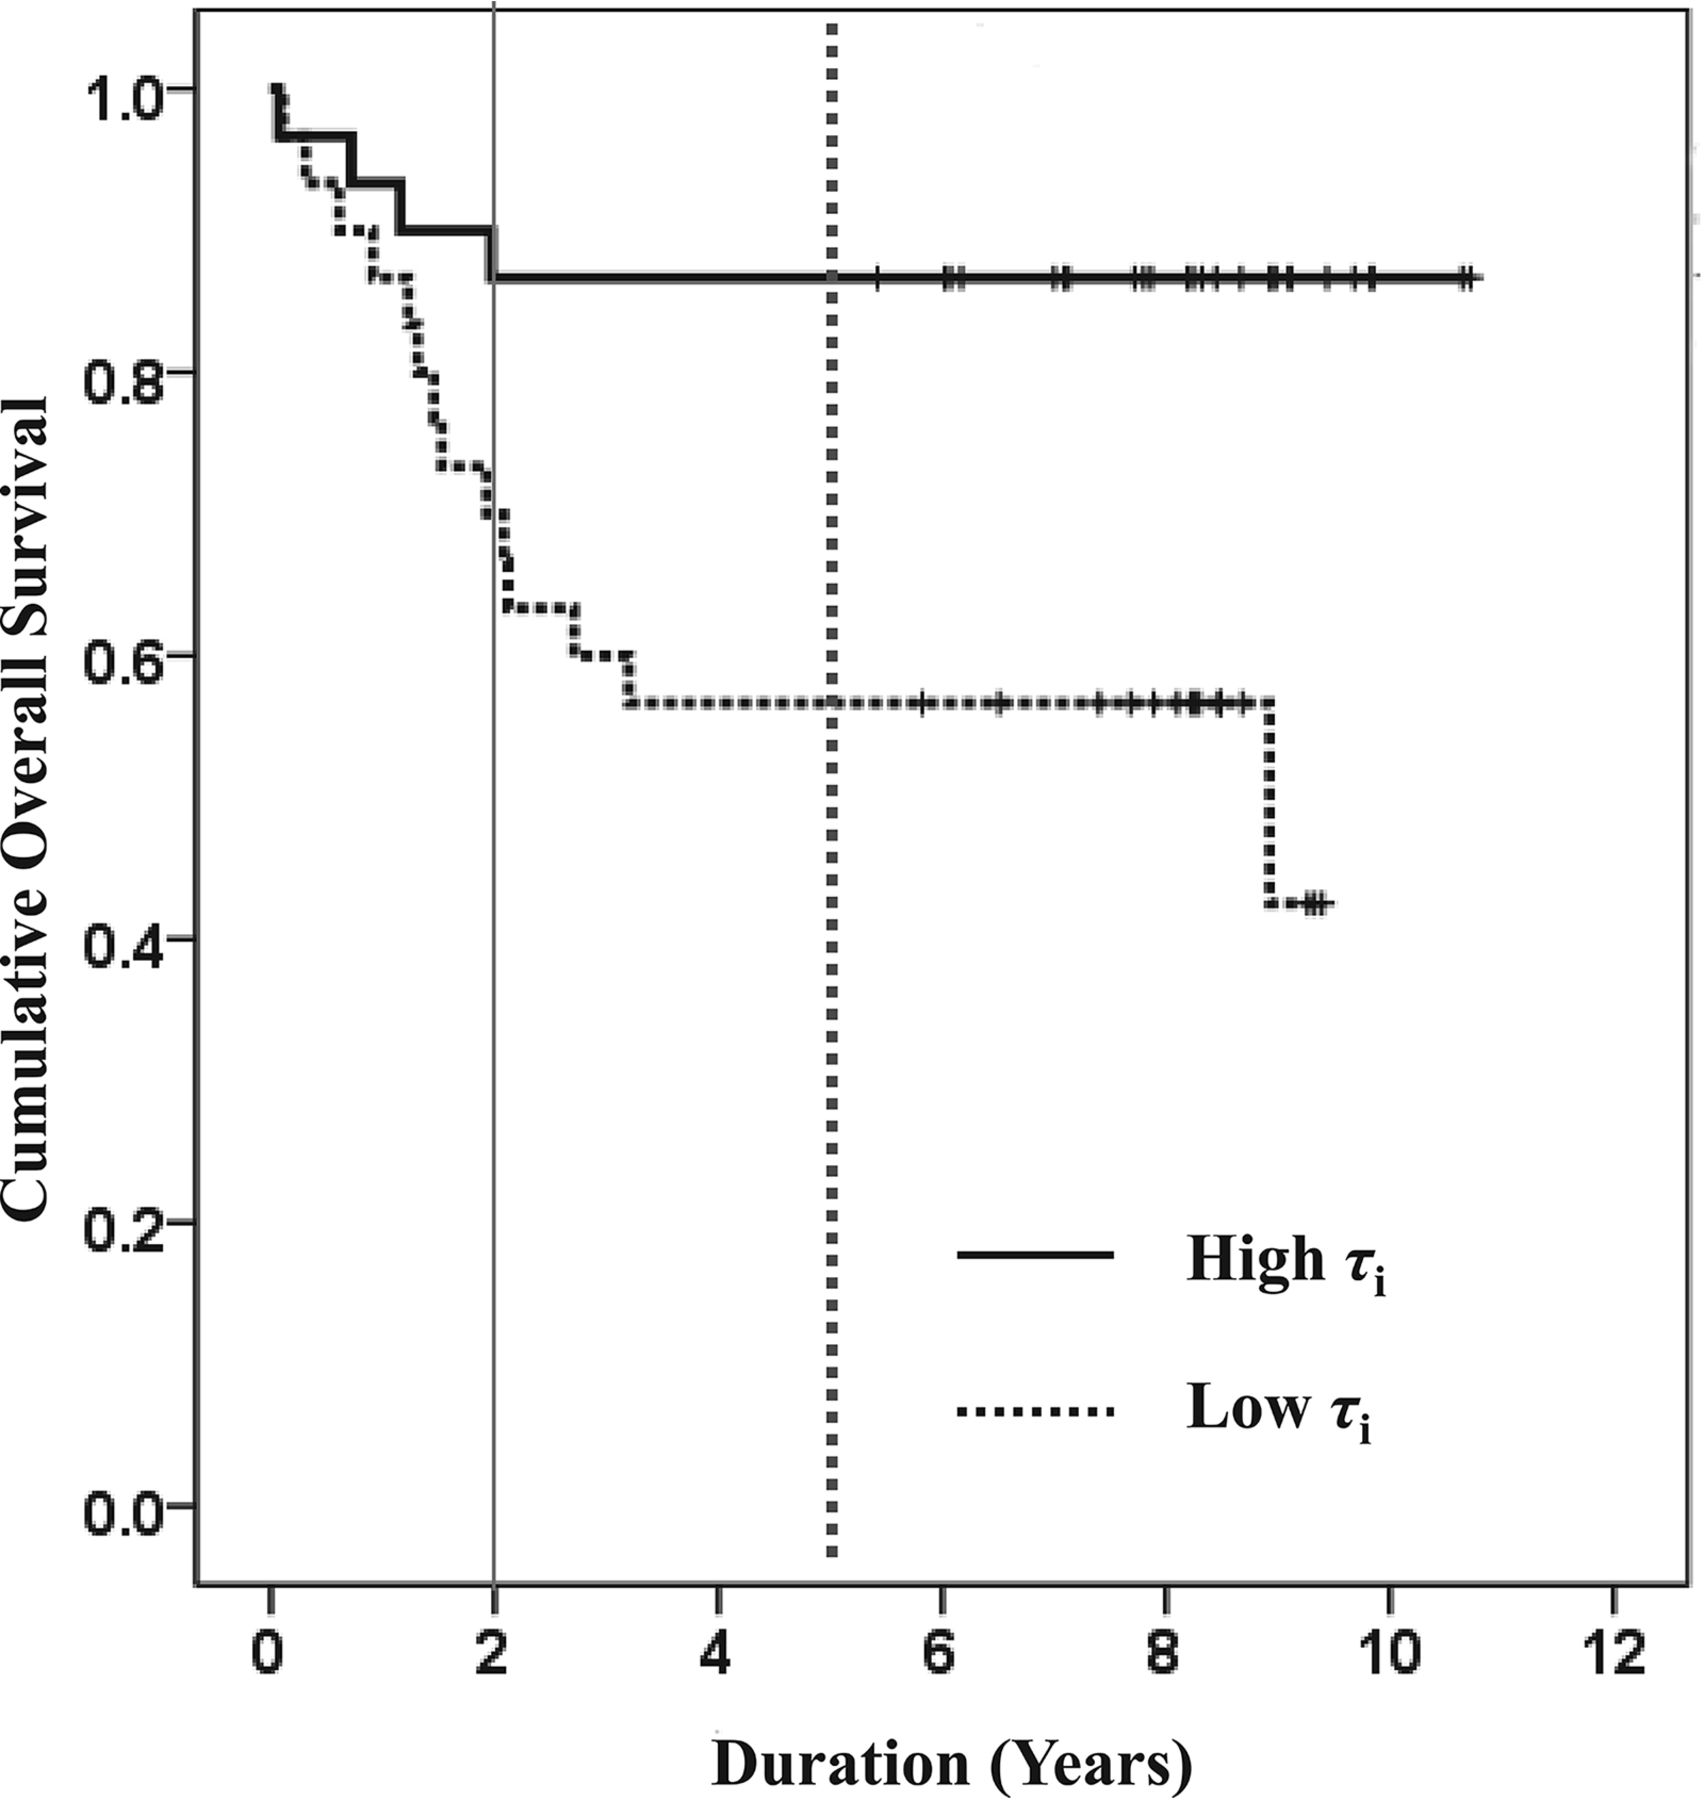
Interestingly, by 5 years, significantly longer OS was observed for patients with higher τi (4 deaths) compared with those with lower τi (13 deaths; log-rank P = .01). Similarly, patients with higher τi (4 deaths) had significantly prolonged OS compared with those with lower τi (14 deaths; log-rank P = .006; Fig 3) when long-term follow-up duration was considered (median duration, >7 years). At 5 years, survival probability for patients with high τi was 86.7% (95% CI, 68.3%– 94.8%), and for patients with low τi, it was 56.8% (95% CI, 37.4%–72.1%).

Kaplan-Meier plot for τi. Patients with higher pretreatment τi (solid curves) demonstrate longer OS compared with patients with lower τi (broken curves) for first 2-year (solid vertical line, P = .09), 5-year (dotted vertical line, P = .01), and long-term (median duration, >7 years; P = .006) follow-up periods.
Cox regression analysis demonstrated a nonsignificant difference (P = .13) in OS between the 2 groups for the 2-year follow-up period, with an HR of 2.43 (95% CI, 0.75–7.92). However, a P value of .02 with HR of 3.71 (95% CI, 1.20–11.39) for 5 years and a P value of .01 with HR of 4.24 (95% CI, 1.38–12.97) were observed in predicting long-term OS.
Prognostic Utility of Ktrans
At 2 years, patients with higher Ktrans (4 deaths) had longer but nonsignificant OS compared with those with lower Ktrans (9 deaths; log-rank P = .07). At 2 years, survival probability was 87.1% (95% CI, 69.2%–95.0%) for patients with high Ktrans and 69.0% (95% CI, 48.8%–82.5%) for patients with low Ktrans.
By 5 years, significantly prolonged OS for patients with higher Ktrans (5 deaths) was noted compared with those with lower Ktrans (12 deaths; log-rank P = .03). Survival probability for patients with high Ktrans was 83.9% (95% CI, 65.5%–93.0%) and for patients with low Ktrans was 58.6% (95% CI, 38.8%–74.0%). However, only a trend toward prolonged OS was observed for patients with higher Ktrans (6 deaths) compared with those with lower Ktrans (12 deaths; log-rank P = .06) when long-term OS was evaluated (Fig 4).
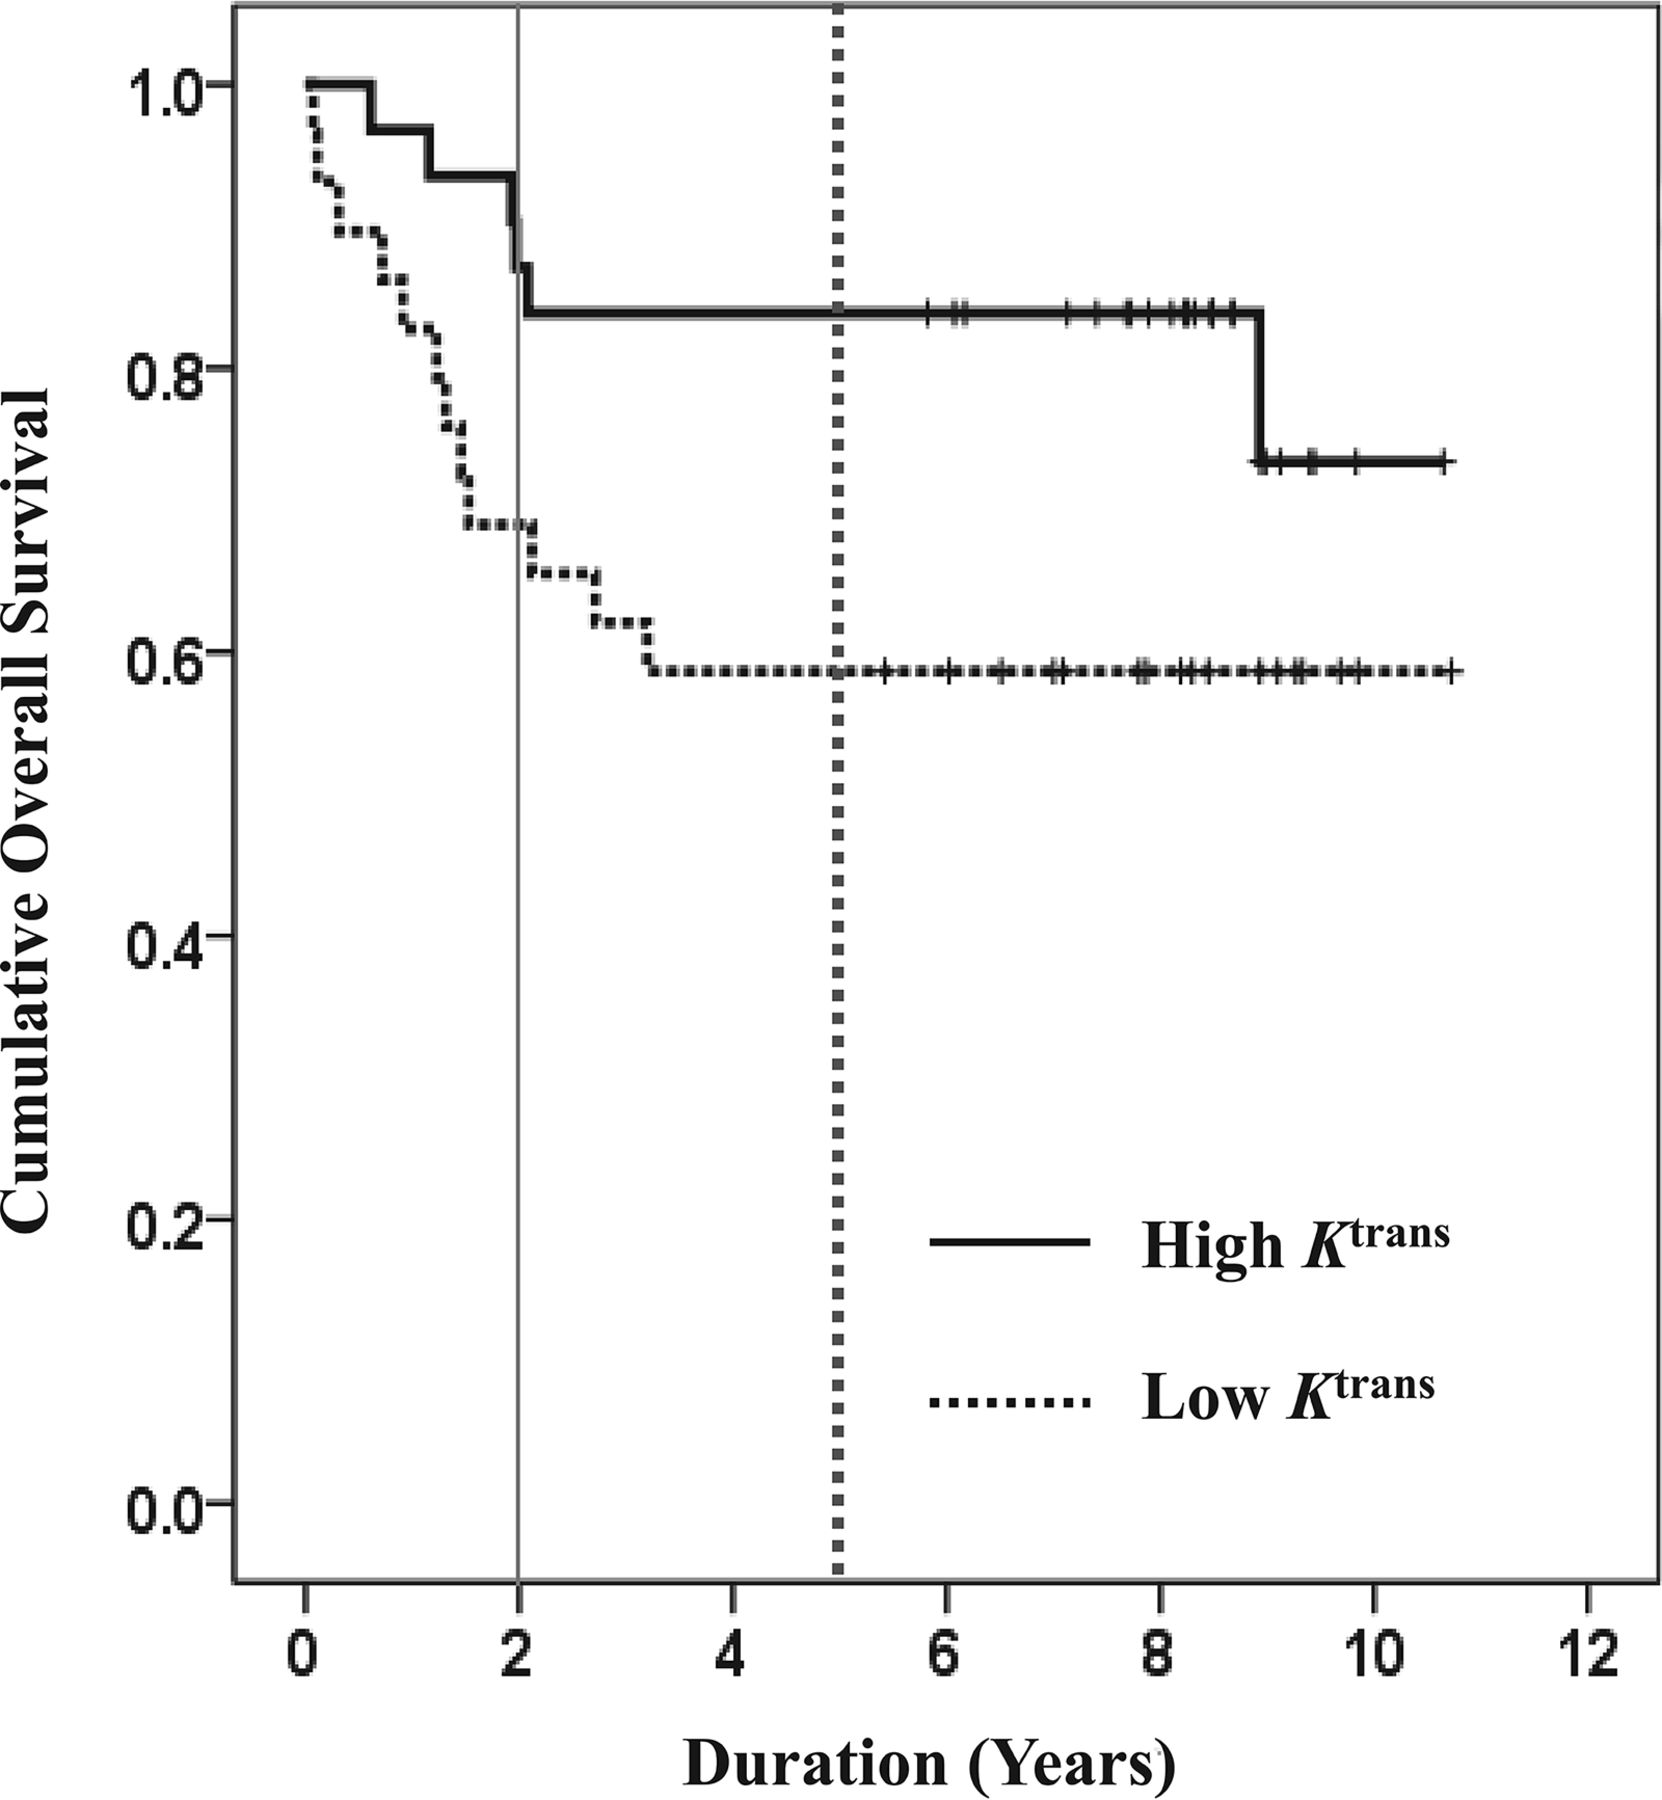
Kaplan-Meier plots for Ktrans. Patients with higher pretreatment Ktrans (solid curves) demonstrate longer OS compared with patients with lower Ktrans (broken curves) at the 2-year (solid vertical line; P = .07), 5-year (dotted vertical line; P = .028), and long-term (median duration, >7 years; P = .06) follow-up periods.
Cox regression analyses showed nonsignificant differences between the 2 groups for 2 years (P = .09) with HR of 2.78 (95% CI, 0.85–9.05) and for long-term periods (P = .06) with HR of 2.52 (95% CI, 0.94–6.72). However, a P value of .04 with HR of 3.04 (95% CI, 1.07–8.64) was observed in predicting 5-year OS.
Prognostic Utility of Combined Analysis Involving τi and Ktrans
By 2 years, the longest OS was observed for patients with high τi/high Ktrans (n = 15, 2 deaths). On the other hand, patients with low τi/low Ktrans (n = 14, 7 deaths) had the shortest OS (log-rank P = .02). In the group of patients (n = 31) who had either high τi/low Ktrans or low τi/high Ktrans, 4 patients died. Moreover, patients with high τi/low Ktrans had longer OS than patients with low τi/high Ktrans. Similarly, at 5 years, patients with high τi/high Ktrans (n = 15, 2 deaths) had the longest OS, whereas patients with low τi/low Ktrans (n = 14, 10 deaths) had the shortest OS (log-rank P < .0001). Of the remaining 31 patients, 5 patients were deceased and patients with high τi/low Ktrans had longer OS than patients with low τi/high Ktrans.
A similar pattern was observed for long-term analysis. Patients with high τi/high Ktrans (n = 15, 2 deaths) had the longest OS, and patients with low τi/low Ktrans (n = 14, 10 deaths) had the shortest OS (log-rank P < .0001). Of the remaining 31 patients, 6 died, and again, patients with high τi/low Ktrans had longer OS than patients with low τi/high Ktrans (Fig 5).

Kaplan-Meier plots for combinations of τi and Ktrans. Patients with high τi/Ktrans (thick broken curve) had the longest OS, and patients with low τi/Ktrans (thin broken curve) had the shortest OS for the first 2-year (solid vertical line; P = .02), 5-year (dotted vertical line; P < .0001), and long-term (median duration, >7 years; P < .0001) follow-up periods. In addition, patients with high τi/low Ktrans (thick solid curve) exhibited longer OS than patients with low τi/high Ktrans (thin solid curve) at all clinical end points.
For the first 2-year follow-up period, multivariate Cox regression analyses revealed a P value of .048 with HRs of 0.21 (95% CI, 0.04–1.00; P = .05), 0.22 (95% CI, 0.05–1.07; P = .06), and 0.20 (95% CI, 0.04–0.95; P = .04) for patients with high τi/high Ktrans, high τi/low Ktrans, and low τi/high Ktrans, respectively, with respect to patients with low τi/low Ktrans. Similarly, a P value of .003 with HRs of 0.13 (95% CI, 0.03–0.60; P = .009), 0.14 (95% CI, 0.03–0.63; P = .01), and 0.19 (95% CI, 0.05–0.69; P = .01) for the first 5 years, and P value of .003 with HRs of 0.12 (95% CI, 0.03–0.58; P = .007), 0.13 (95% CI, 0.03–0.61; P = .01), and 0.26 (95% CI, 0.08–0.82; P = .02) for long-term OS were observed.
When all the combinations of variables (high τi/high Ktrans, high τi/low Ktrans, low τi/high Ktrans) were considered together, HRs of 1.84 (95% CI, 1.05–3.23; P = .03), 2.32 (95% CI, 1.35–3.97; P = .002), and 2.31 (95% CI, 1.38–3.87; P = .001) for the first 2 years, 5 years, and long-term OS, respectively, were observed. Overall, combination of the τi and Ktrans groups demonstrated differential OS (Wald test, P = .003).
Stratifying HPV/p16-Positive and p16-Negative Patients
Of 32 patients with the availability of p16 status, 13 died by the date of last observation. Patients with p16-positive status had significantly longer OS than p16-negative patients (P = .05; Fig 6A). Noticeably, no significant difference (P = .17) in OS was observed between patients in whom p16-expression data were or were not available.

Kaplan-Meier plots for p16 expression. (A) Patients with p16-positive expression (solid curve) exhibited significantly longer long-term (median duration, >7 years) OS (P < .05) than patients with p16-negative expression (broken curve) (B). Patients with positive p16 expression and high τi/high Ktrans (thick broken curve) had longer OS than p16-positive patients with low τi/low Ktrans (thin broken curve). In addition, patients with high τi/low Ktrans (gray solid curve) exhibited longer OS than patients with low τi/high Ktrans (black solid curve) at all clinical end points. However, these differences were not significant (P > .05).
Patients with p16-positive status with higher τi demonstrated nonsignificantly longer OS (P = .20) than patients with lower τi. Similarly, nonsignificant (P = .61) differences were observed for Ktrans. Moreover, p16-positive patients with high τi/high Ktrans had the longest OS, and patients with low τi/low Ktrans had the shortest OS. However, these findings were also not significant (Fig 6B; P > .05). In addition, patients with p16-negative status and higher τi demonstrated nonsignificantly (P = .12) longer OS than those with lower τi. We could not compare OS by using Ktrans because all patients in this subgroup had Ktrans higher than the median value.
Discussion
Our observations suggest that patients with higher pretreatment τi and Ktrans from metastatic nodes exhibit longer OS. These results are particularly encouraging given the adverse prognosis associated with nodal metastases and offer potential opportunities to develop alternative therapeutic approaches in the poor prognosis cohort.
Earlier studies12,25,26 have reported that τi is inversely correlated with cell membrane ion-pump activity, a measure of mitochondrial metabolism suggesting that τi might be a sensitive indicator of cellular energy turnover. Similarly, some studies have reported that increased metabolic activity is associated with lower τi (median, 0.16–1.03 seconds) in regions of prostrate15,16 and esophageal cancer17 compared with normal tissues. In yet another study,18 lower τi (0.11 ± 0.02 seconds versus 0.29 ± 0.53 seconds) was observed from normal liver parenchyma (a metabolically more active region) compared with hepatocellular carcinomas. The inverse correlation between τi and tumor metabolism was corroborated when higher τi was observed in complete responders compared with poor responders with breast carcinomas.12,14 Taken together, these studies imply that malignant cells from tumors with high τi have reduced metabolic energy available for their growth relative to malignant cells from tumors with low τi.
In the present study, patients with HNSCC with higher pretreatment τi from the metastatic nodes were associated with prolonged OS measured at 3 different clinical end points, suggesting that malignant cells were associated with reduced metabolic energy. An inverse correlation of τi with EF5, a marker of hypoxia, and direct correlation of elevated τi regions with high blood flow have been reported.27 An earlier study28 reported that tumors with relatively higher blood flow and reduced hypoxia are associated with increased oxygenation, resulting in better access to chemotherapeutic drugs and radiosensitivity. Taken together, these studies and our observations suggest that tumors with higher τi may harbor a favorable microenvironment for CRT. We postulate that the combined effect of lower hypoxia and reduced metabolic activity of the tumor cells might have contributed to higher pretreatment τi that led to better treatment response and prolonged OS in patients with HNSCC. This notion is supported by a HR of 4.24 that was observed at the long-term follow-up period, implying a 4-fold higher risk of death in patients with low τi than in patients with high τi.
Pretreatment Ktrans (median value, 0.19–0.64 minutes−1) has been reported to predict treatment response to CRT,4⇓–6 induction therapy,7 and short-term survival in patients with HNSCC.8,9 We also observed that higher pretreatment Ktrans was associated with better OS. Because Ktrans reflects a combination of tumor perfusion and microvascular permeability, our results and those of earlier published reports support the notion that tumor vascularity might be an important predictor of disease control in HNSCC. The fact that Ktrans predicted only 5-year OS while τi was useful in predicting both 5-year and long-term OS suggests that τi is a more robust prognostic imaging biomarker in evaluating HNSCC.
When τi and Ktrans were combined, significantly longer OS was observed for patients with high τi/high Ktrans for all clinical end points. We believe that synergistic interaction between these 2 parameters in predicting OS was greater than what would be expected from an individual parameter. The fact that patients with high τi/high Ktrans demonstrated the longest OS agrees with the hypothesis that these patients may have had the most favorable conditions such as elevated tumor blood flow, lower hypoxia, and lower cellular metabolic energy for optimal therapeutic benefit of CRT. Another interesting finding was that patients with high τi/low Ktrans exhibited longer OS than patients with low τi/high Ktrans at all clinical end points. This indicates that τi was a more dominant factor than Ktrans in the synergistic interaction leading to longer OS, further substantiating that τi is a robust prognostic indicator in HNSCC.
We performed an exploratory analysis to investigate if τi and Ktrans could predict OS in HPV/p16 patients because HPV/p16 is a key etiological factor in HNSCC, with distinct epidemiologic, clinical, and molecular characteristics.21,22 Patients harboring the p16 gene are generally more sensitive to CRT and are associated with improved prognosis and prolonged survival.20 The favorable outcome in p16-positive patients may be attributed to fewer and distinct somatic genetic alterations and positive immunologic response.21,22 In agreement with prior studies,20,21 significantly longer OS was observed for p16-positive patients compared with p16-negative patients in our study. A nonsignificant, but positive trend toward longer OS for p16-positive patients harboring high τi and Ktrans suggests the prognostic utility of τi and Ktrans may also be valid in stratifying p16-positive patients. We recognize that these results may be subject to selection bias inherent to the availability of tissue specimens. However, a nonsignificant difference in OS between patients who had and those who did not have tissues for p16 expression indicated that there was a minimal influence of sample size in the determination of OS.
While predicting short-term (6 months) treatment response to CRT, no significant differences in pretreatment τi were observed between complete and partial responders.5 However, in the present study, patients who had higher pretreatment τi were associated with prolonged OS. The difference might be related to different follow-up duration, assessment of clinical outcome (local regional recurrence/evidence of residual disease on pathology versus OS), and different number of patients (n = 33 versus n = 60) enrolled between these 2 studies. We focused on assessing nodal metastases in predicting OS because lymphadenopathy in the neck is a well-known prognostic determinant in patients with HNSCC.29 A DCE-MRI analysis of primary tumors would also be important; however, artifacts induced by physiologic motion precluded the analysis of primary tumors. We combined DCE-MRI data from MR systems with 2 different field strengths (1.5T and 3T). To account for this variability, blood T1 and contrast agent relaxivities corresponding to the field strengths were used for converting signal intensity curves to concentration curves and estimating pharmacokinetic parameters. Previously,5 we reported similar trends for Ktrans in predicting treatment response in patients scanned at 2 different field strengths, suggesting that DCE-MRI–derived parameters are independent of magnetic field. Our supposition is corroborated by a study30 in which no significant differences in signal enhancement ratio, time to peak enhancement, uptake, and washout rates were observed for breast lesions scanned with 1.5T and 3T MR systems.
Conclusions
Our data indicate that shutter-speed model analysis of DCE-MRI provides 2 important imaging biomarkers (τi and Ktrans) presenting complementary physiologic information about the tumor microenvironment. Although τi may be a potential independent prognostic imaging biomarker for predicting OS, combined analysis of τi and Ktrans greatly improves the predictive power of these parameters in determining OS in HNSCC. Future prospective trials involving a larger patient population are required to confirm our findings.
Footnotes
Disclosures: Suyash Mohan—UNRELATED: Grants/Grants Pending: Galileo, CDS, NovoCure*. Virginia LiVolsi—RELATED: Grants/Grants Pending: National Institutes of Health, Comments: grant R01-CA102756 (Harish Poptani)*. Harry Quon—UNRELATED: Grants/Grants Pending: University of Pennsylvania*. Harish Poptani—RELATED: Grants/Grants Pending: National Institutes of Health*; UNRELATED: Employment: University of Liverpool. *Money paid to the institution.
This work was supported by National Institutes of Health grant R01-CA102756 (H.P.).
Paper previously presented at: American Society of Neuroradiology Annual Meeting and the Foundation of the ASNR Symposium, May 21–26, 2016; Washington, D.C.
Indicates open access to non-subscribers at www.ajnr.org
References
- Received February 21, 2017.
- Accepted after revision September 4, 2017.
- © 2018 by American Journal of Neuroradiology


Jump to section
Related Articles
Cited By...
- No citing articles found.