
Abstract
BACKGROUND AND PURPOSE: Endovascular treatment of intracranial aneurysms has relevantly changed over the past decades. Multiple new devices such as intrasaccular flow diverters have broadened the treatment spectrum but require very exact aneurysm sizing. In this study, we investigated multidetector and flat panel angiographic CT and digital subtraction imaging as well as different postprocessing methods (multiplanar reconstruction, volume-rendering technique, 3D DSA, and conventional 2D angiography) for their ability to exactly size 2 aneurysm models.
MATERIALS AND METHODS: Two aneurysm models with known aneurysm sizes were placed inside a human skull. After injection of iodine contrast media, imaging was performed using a 128-slice CT scanner or an Artis Q biplane angiosuite, respectively. Aneurysms were measured for width, neck, and height, and the mean difference from the known sizes was calculated for each technique. The technique with the most exact measurement was defined as the criterion standard. We performed Bland-Altman plots comparing all techniques against the criterion standard.
RESULTS: Angiograms adjusted according a previous 3D run with a short object-to-detector distance resulted in the most exact aneurysm measurement: −0.07 ± 0.61 mm for aneurysm 1 and 0.17 ± 0.39 mm for aneurysm 2. Measurements of conventional DSA images were similar, and CT-based images were significantly inferior to the criterion standard.
CONCLUSIONS: 2D DSA with a short objective-to-detector distance adjusted according to a previous 3D run resulted in the most exact aneurysm measurement and should therefore be performed before all endovascular aneurysm treatments.
ABBREVIATIONS:
- FDCTA
- flat panel detector CTA
- MDCTA
- multidetector row CTA
- VRT
- volume-rendering technique
Endovascular treatment of ruptured aneurysms has become the standard of care, and it is also a well-accepted alternative to microsurgical clipping for the treatment of unruptured aneurysms.1,2 However, in anatomically challenging aneurysms such as broad-based bifurcational aneurysms, coil embolization alone is of limited use. Therefore numerous adjunctive devices and intraluminal and intrasaccular flow diverters for intra-arterial aneurysm repair have been developed during the past decade and are currently used in clinical practice.3⇓–5 Some of these new devices such as the Woven EndoBridge (WEB) aneurysm embolization system (Sequent Medical, Aliso Viejo, California) require a very exact preinterventional aneurysm sizing for favorable angiographic results.4 Simultaneously, aneurysm imaging has emerged significantly with the introduction of 3D digital subtraction angiography and different reconstruction modalities (MPR) and the volume-rendering technique (VRT) for multidetector row CT angiography (MDCTA) and flat panel detector CT angiography (FDCTA). However; until recently, only a few studies have examined the capability of these different techniques regarding the accuracy of intracranial aneurysm sizing, yielding contradictory findings.6⇓⇓–9 The aim of this study was to evaluate different image-acquisition and reconstruction techniques in regard to their ability to optimize preinterventional device sizing in endovascular aneurysm repair.
Materials and Methods
Phantom Preparation and Image Acquisition
Intracranial aneurysms were simulated using 2 different 3D aneurysm models printed according to a 3D angiographic dataset with a Form 2 printer (Formlabs, Somerville, Massachusetts). Known sizes of the aneurysms were the following—aneurysm 1: neck, 7.5 mm; height, 10.9 mm; width, 11.0 mm; aneurysm 2: neck, 3.2 mm; height, 3.7 mm; width, 3.4 mm.
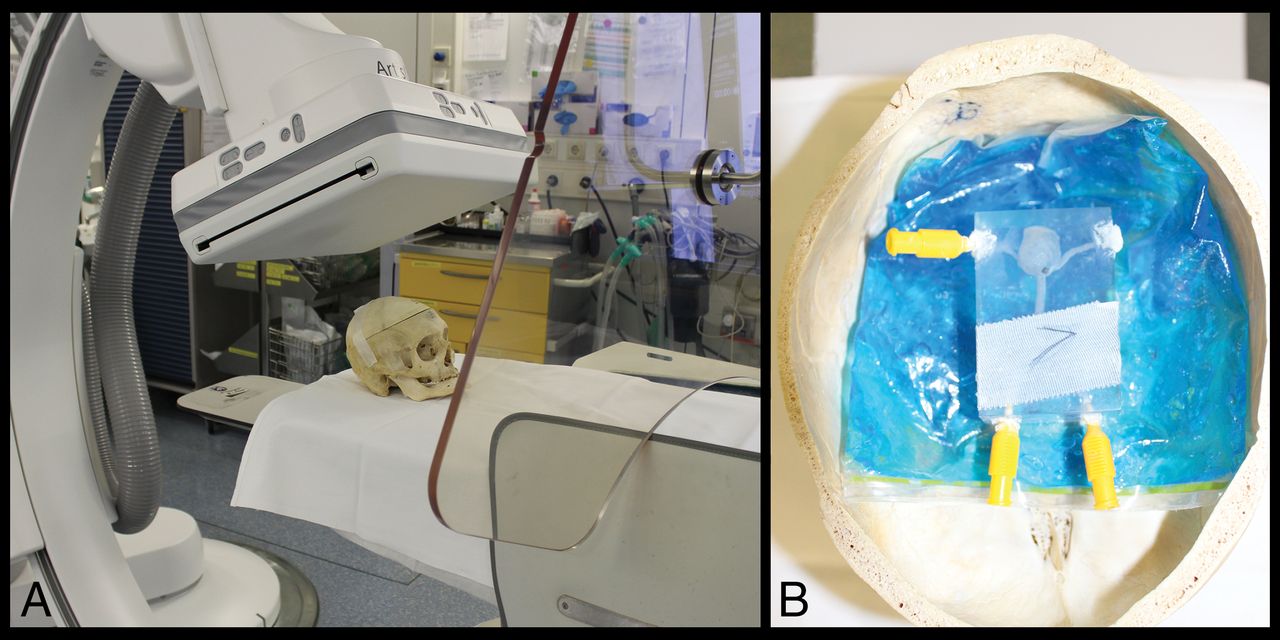
For a better simulation of a clinical setting, the models were placed in a human skull (Fig 1). Both models were examined in the 3 different modalities (MDCTA, FDCTA, DSA) 5 times with different positions of the model. For MDCTA and FDCTA, the silicone models were filled with diluted iodinated contrast agent (Imeron 400, iopamidol; Bracco, Milan, Italy). For DSA runs, 50% diluted contrast agent and saline flush were injected during image acquisition. DSA runs were performed with 3 different detector distances from the model (as short as technically possible = near; as far away as possible = long; and in middle position = middle); 3D DSA and DSA runs that were adjusted to the optimal projection of the 3D run, again with 3 different positions of the detector. Each examination was performed with 5 different positions of the skull/aneurysm, resulting in 90 acquisitions and 120 datasets.

Experimental setup of an aneurysm model inside a human skull on the biplane Artis Q angiosuite.
The nomenclature used in this study is as follows: MDCTA or FDCTA, MPR and VRT. DSA long, middle, or near represents 2D-DSA images with different detector differences; and DSA rotation near, middle, and long represents 2D-DSA images that were acquired according an optimal projection from the rotational images of a 3D-DSA. Additionally, 3D-DSA MPR and VRT represent reconstructed images from the 3D-DSA.
DSA and FDCTA images were acquired with biplane flat panel angiography (Artis Q; Siemens, Erlangen, Germany). For the FDCTA, we used a commercially available FDCTA sequence (DynaCT Clear; Siemens) with 10 seconds of rotation, 70 kV, 1.2 μGy/frame, 200° angle, 0.8°/frame angulation step, weighted CT dose index of approximately 40 mGy. For 3D DSA, we applied the syngo DynaCT (Siemens) 3D setup with 5-second rotational time, 70 kV, 0.36 μGy/frame, 200° angle, 0.8°/frame angulation step, weighted CT dose index of approximately 9mGy. MDCTA images were acquired on a 128-section CT scanner (Somatom Definition AS+; Siemens) with the following parameters: 128-row collimation at 0.6 mm; pitch = 0.6; acquisition parameters at 120 kV/140 effective mA (Table 1). The raw data were transformed into a volume dataset using a sharp reconstruction kernel (only for MDCTA) and a slice thickness of 0.6 mm. Postprocessing of the rotational data and measurements of the MDCTA and FDCTA as well as VRT and MPR images was performed on a syngo workstation (syngo X Workplace; Siemens) using the 3D or/and 4D tool (Siemens). Reconstruction of the 3D-DSA VRT and FDCTA VRT images was performed with a smooth kernel and small VOI, whereas MPR images were acquired from a normal kernel and large VOI (Fig 2).
Examination parameters
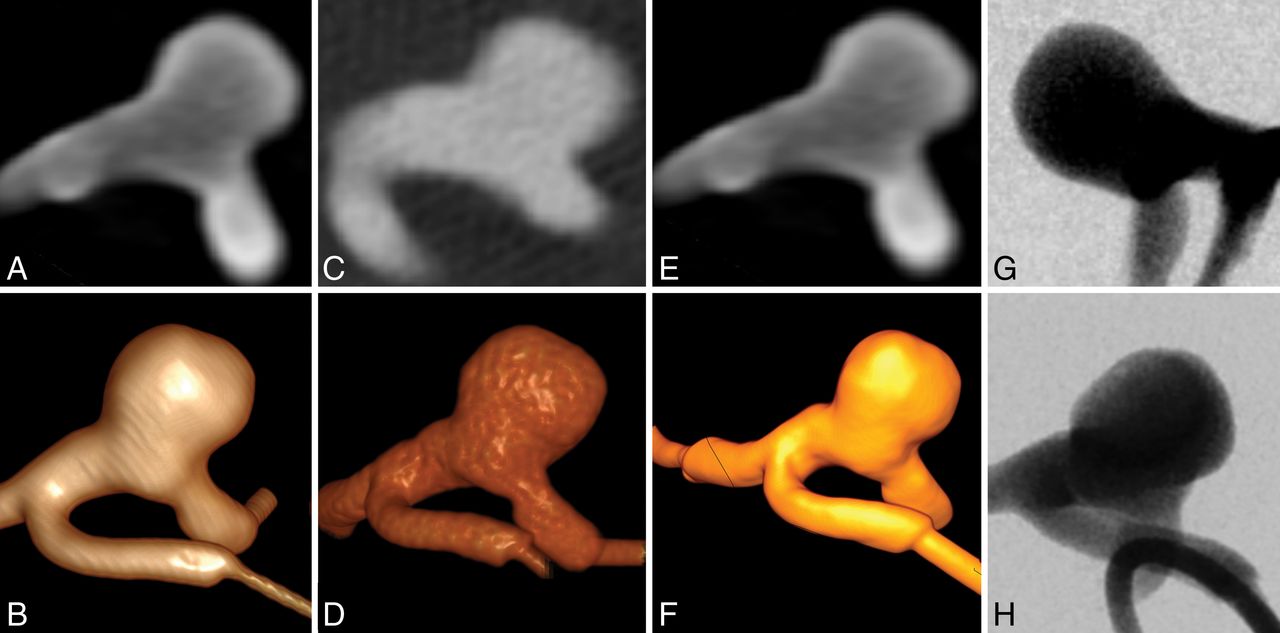
Examples of the different image techniques applied: MPR and VRT of MDCTA images (A and B), MPR and VRT images of FDCTA images (C and D), MPR and VRT images obtained from a 3D-DSA run (E and F), short object-to-detector distance DSA image no optimal projection (G), and optimized projection DSA image with short object-to-detector distance (H, DSA rotation near).
Image and Statistical Analysis
Each examination was analyzed and measured individually on the previously mentioned syngo workstation by 3 readers with different experiences in aneurysm diagnostics and treatment (M.N.P. with > 7 years, D.B. with >5 years, N.A. with >3 years) who did not perform the examinations. The readers were blinded to the aneurysm model. They were asked to measure 3 dimensions of the aneurysm: neck and maximal width and height. Window levels and settings for MPR as well as VRT were not standardized, allowing all readers to choose their personal preferences. The mean of the 3 raters was compared with the known sizes of the aneurysms. The differences in the means for all techniques were calculated. The technique with the smallest deviation (in mean and smallest SD) from the known aneurysm sizes was defined as the criterion standard. To compare the different techniques, we generated Bland-Altman plots for all techniques comparing them to the criterion standard by plotting the differences between the 2 methods against the mean of the 2 techniques. Arithmetic mean, 95% CI of the arithmetic mean, lower and upper limits (±1.96 SD), and 95% confidence intervals were calculated. We calculated interrater agreement using the interclass correlation coefficient, considering an interclass correlation coefficient of >0.8 as representing almost perfect agreement. Statistical analyses were performed using MedCalc for Windows (MedCalc Software, Mariakerke, Belgium).
Results
Of all applied techniques and reconstructions, 2 DSA images acquired in an optimal projection according to a previous rotational angiogram and a short object-to-detector distance (DSA rotation near) resulted in the smallest mean difference and SD compared with the known aneurysm size. The measurements of all 3 raters resulted in a −0.07 ± 0.61 mm mean difference for aneurysm 1 and 0.12 ± 0.25 mm mean difference for aneurysm 2. 2D-DSA images with medium and long detector distances resulted in similar measurements, whereas MPR and VRT from either MDCTA, FDCTA, or even DSA resulted in larger mean differences. (For an overview of all techniques, see Tables 2 and 3 and Fig 3.) Accordingly, the analysis of the mean differences in DSA rotation near was defined as the criterion standard, and Bland-Altman plots were calculated for all other techniques compared with the criterion standard (Fig 3). When compared with DSA images acquired in the same projection (optimized according the rotational images) but with other distances of the detector, the smallest differences in the mean were found. The arithmetic mean difference between DSA rotation near and DSA rotation middle was 0.01 (95% CI, −0.08–0.11; lower limit: −0.89; 95% CI, −1.05–0.7; upper limit: 0.91; 95% CI, 0.75–1.08) and 0.9 (95% CI, −0.04–0.21, lower limit: −1.13; 95% CI, −1.36 to −0.91; upper limit: 1.31; 95% CI, 1.09–1.54) for DSA rotation long, respectively. In comparison with normal DSA images (no optimized projection), the smallest difference in the mean was found for the DSA images obtained with a long detector-to-object distance, with a mean difference of −0.48 (95% CI, −0.63 to −0.33; lower limit: −1.90; 95% CI, −2.16 to −1.64; upper limit: 0.94; 95% CI, 0.68–1.20). The mean difference was −0.51 (95% CI, −0.67 to −0.36; lower limit: −1.98; 95% CI, −2.25 to −1.71; upper limit: 0.95; 95% CI, 0.68–1.22) for the middle distance and −0.58 (95% CI, −0.75 to −0.41; lower limit: −2.15; 95% CI, −2.44 to −1.86; upper limit: 0.99; 95% CI, 0.70–1.28) for the near detector position.
Aneurysm model 1—mean of differences in known aneurysm sizes (all 3 dimensions combined)
Aneurysm model 2—mean of differences in known aneurysm sizes (all 3 dimensions combined)

Bland-Altman plots comparing all techniques with DSA rotation near MDCTA MPR (A) versus DSA rotation near MDCTA VRT (B) versus DSA rotation near FDCTA MPR (C) versus DSA rotation near FDCTA VRT (D) versus DSA rotation near 3D DSA MPR (E) versus DSA rotation near 3D DSA VRT (F) versus DSA rotation near DSA long (G) versus DSA rotation near DSA middle (H) versus DSA rotation near DSA rotation long (I) versus DSA rotation near DSA rotation middle versus DSA rotation near (J).
When comparing DSA rotation near measurements with MPR and VRT images derived from 3D-DSA, a smaller mean difference was found for rotational DSA MPR images: −0.72 (95% CI, −0.98 to −0.46; lower limit: −3.19, 95% CI, 3.64 to −2.74; upper limit: 1.75; 95% CI, 1.30–2.20 versus −0.86; 95% CI, −1.03 to −0.69; lower limit: −2.49, 95% CI, −2.9 to −2.19, upper limit: 0.77; 95% CI, 0.47–1.07) for rotational DSA VRT images. The comparison with angiographic images from MDCT resulted in a mean difference of −0.84 (95% CI, −1.05 to −0.62; lower limit: −2.89; 95% CI, −3.27 to −2.52; upper limit: 1.22; 95% CI, 0.85–1.60). Comparable measurements were obtained using VRT images derived from the MDCTA data, resulting in a mean difference from DSA rotational near of −1.34 (95% CI, −1.56 to −1.13; lower limit: −3.37; 95% CI, −3.74 to −2.99; upper limit: 0.68; 95% CI, 0.31–1.05).
When image acquisition was performed using the flat panels of the angiography scanner, we measured the following mean differences: −0.67 (95% CI, −0.86 to −0.49; lower limit: −2.37; 95% CI, −2.68 to −2.06; upper limit: 1.02; 95% CI, 0.71–1.33) for VRT images reconstructed from a FDCTA run and −0.64 (95% CI, −0.91 to −0.37; lower limit: −3.14; 95% CI, −3.60 to −2.68; upper limit: 1.86; 95% CI, 1.40–2.32). For an overview of all arithmetic means and lower and upper limits including CIs see Table 4; all Bland-Altman plots can be found in Fig 3.
Statistical analyses of the Bland-Altman plots comparing all techniques against DSA rotation “near” images
Discussion
Endovascular aneurysm repair has become the standard of care for ruptured intracranial aneurysms during the past decades.1 Along with this clinical development, a broad range of adjunctive devices for the endovascular treatment of intracranial aneurysms has been developed, and several of them are currently used in clinical practice. For all of these devices, sizing is a critical issue and additionally too adjunctive devices and all types of flow diverters; even the sizing of standard coils has a relevant impact on occlusion rates after endovascular treatment.4,10,11 From a technical and clinical point of view, sizing should thereby have the accuracy of ±1 mm because most devices are available in 1-mm steps. However, until recently, there were no guidelines or consensus on how intracranial aneurysm sizing should be performed, and only a few studies have focused on this issue though there is growing evidence for the importance of the chosen image technique and reconstruction method applied.12⇓–14 Considering the above-mentioned dimension of 1-mm deviation to be clinically relevant, our study revealed 2D-DSA images adjusted to previous 3D DSA (optimal projection) performed the best in terms of accuracy when comparing the absolute mean difference and SD of the aneurysm dimensions with −0.07 ± 0.61 for aneurysm 1 and 0.12 ± 0.25 for the second aneurysm model. Therefore, all other techniques in this study were compared with this predefined criterion standard.
Considering the lower and upper limits of the Bland-Altman plots to represent our defined goal of 1-mm accuracy, only DSA images with optimized projection (according to a previous 3D run) and middle detector position fulfilled the requirement of being equivalent to 2D-DSA images with optimal projection and short detector distance (Table 4) with an arithmetic mean difference of 0.01 and a lower limit of −0.89 and an upper limit of 0.91 (Table 4). Although all techniques besides MDCTA VRT had arithmetic mean differences of <1 mm (Table 4), their lower and upper limits were significantly different (Fig 3) and the 95% CI of the mean difference was outside our 1-mm goal. Accordingly, in general, small differences in the interclass correlation coefficient were very high in all techniques, favoring VRT over MPR reconstructions for MDCTA- and FDCTA and with slightly better results for DSA images (Table 5) compared with CT images.
Interclass correlation coefficient for all techniques
If not only mean differences of the techniques but also 95% CI as well as upper and lower limits of the Bland-Altman plots are considered, 2D DSA images performed in a projection adjusted to a previous 3D run are the only images that fulfilled our predefined quality standards in virtually all investigations. When we looked more closely at the results of the CT-based CTA analysis, this study shows that MDCTA MPR and VRT measurements of both aneurysms resulted in significant overestimation of the aneurysm size. For MDCTA MPR, the mean difference was 1.15± 1.26 mm for aneurysm 1 and 0.54 ± 0.31 mm for aneurysm 2 compared with the known sizes of the aneurysms. The Bland-Altman plots depicted larger discrepancies between the MDCTA-derived MPR and VRT images for larger dimensions of the aneurysms (Fig 3). These results confirm what has been known of the capability of MDCTA-derived measurements of intracranial stenosis.15 Regarding MDCTA, a sharp reconstruction kernel is thought to lead to very exact aneurysm imaging compared with a smooth kernel, and if a 3D DSA was used as the criterion standard what could not been proved in our study because in our setting 3D DSA also overestimated aneurysm sizes.13 However, the use of different reconstruction kernels does play a critical role in not only MDCTA but also 3D-DSA as has been described recently by Lauric et al.12
In this study, different kernels were used for different purposes, and we found 3D-DSA VRT and MPR images from smooth/normal kernel reconstructions to overestimate aneurysm sizes, in line with findings of Lauric et al12 recently. Most interesting, Lauric et al and O'Meara et al13 compared different techniques and different reconstruction kernels with 3D-DSA images, which we found to significantly overestimate aneurysm sizes and therefore were not recommended for use as a criterion standard in aneurysm sizing. In another study, Ruedinger et al16 reported that edge-enhancement reconstructions with a smooth or normal kernel resulted in the most accurate measurements of aneurysms, which supports our experimental setup using these reconstruction algorithms. Additionally, Bland-Altman plot analysis showed that 3D-DSA MPR and VRT images overestimated larger aneurysm dimensions more than smaller dimensions. In terms of accuracy, FDCTA MPR and VRT images had smaller mean differences to the known aneurysm sizes compared with MDCTA or 3D-DSA (Tables 2 and 3). When we compared FDCTA VRT and MPR versus MDCTA VRT and MPR, it became evident that both had smaller mean differences in sizing with the chosen criterion standard (DSA rotation near). These findings are similar to those reported in the literature for intracranial vessels or stenosis measurement and for intracranial aneurysms.6,7,15,17
From a clinical point of view, most techniques investigated in this study produced accurate measurements of the aneurysm models. However, when it comes to device sizing, one should be aware that only optimized DSA images (ie, optimal projection) resulted in almost perfect measurements with <1-mm deviation toward the lower and upper limits of the Bland-Altman plots. Regarding the radiation dose applied, a 3D-DSA run with a 5-second rotation time has a significantly lower dose compared with a biplane DSA run or MDCTA/FDCTA, which suggests that an initial 3D run for planning of optimized 2D images (optimized projection) leads to optimal 2D images for aneurysm measurement and treatment planning and lower doses.18,19
There are several limitations to our study. The main limitation is the phantom design, though it allows a comparison with known aneurysm sizes. However, as we have described above, 3D printing may have influenced our study results. Additionally, there were only 2 aneurysm models, and both were saccular aneurysms; the investigation of very complex aneurysms, therefore, might have led to other results. Another limitation is the use of standardized contrast attenuation for most investigations (MDCTA and FDCTA), which usually varies in patients for several reasons. Moreover, aneurysms in real patients may be located close to the skull base and therefore may be more challenging to investigate compared with our aneurysm models, though they were placed in a skull. Notably, all our findings are limited to Siemens scanners and may not be true for CT scanners or angiosuites of other vendors.
Conclusions
2D-DSA with a short object-to-detector distance adjusted according to a previous 3D-DSA run resulted in the most exact aneurysm measurement and is therefore recommended for device sizing.
Footnotes
Disclosures: Daniel Behme—UNRELATED: Consultancy: Acandis. Marios-Nikos Psychogios—RELATED: Grant: Siemens*; UNRELATED: Payment for Lectures Including Service on Speakers Bureaus: Penumbra, phenox, Acandis, Siemens, Stryker. *Money paid to the institution.
Previously presented in part at: Annual Meeting of the Deutsche Gesellschaft für Neuroradiologie (DGNR), October 11–14, 2017; Cologne, Germany.
References
- Received June 22, 2018.
- Accepted after revision September 17, 2018.
- © 2018 by American Journal of Neuroradiology


