
Abstract
BACKGROUND AND PURPOSE: Both thalamic iron deposition and atrophy have been reported in patients with multiple sclerosis compared with healthy controls, but how they are related is unclear. The purpose of this study was to understand the pathophysiologic basis for this iron deposition.
MATERIALS AND METHODS: Ninety-five patients with relapsing-remitting multiple sclerosis underwent 3T MR imaging with a standardized protocol that included quantitative susceptibility mapping to measure iron concentration and a 3D T1 echo-spoiled gradient-echo sequence to obtain thalamic volumes. Volumes of interest were manually delineated on the quantitative susceptibility map to encompass both thalami. Multivariate regression analyses were performed to identify the association between thalamic susceptibility and volume. Associations between thalamic susceptibility and total gray matter volume, cortical thickness, and T2 lesion volume were also assessed.
RESULTS: The relative susceptibility of the thalamus was associated with T2 lesion volume (P = .015) and was higher in the presence of enhancing lesions (P = .013). The relative susceptibility of the thalami was not associated with thalamic volumes, total gray matter volumes, or cortical thickness (P > .05).
CONCLUSIONS: Iron levels in the thalami are associated with T2 lesion burden and the presence of enhancing lesions, but not with thalamic or gray matter volumes, suggesting that iron accumulation is associated with white matter inflammation rather than gray matter neurodegeneration.
ABBREVIATION:
- QSM
- quantitative susceptibility mapping
Thalamic atrophy has been reported to be an early finding in patients with multiple sclerosis1⇓⇓⇓⇓⇓–7 and may result from growth factor depletion after lesional transection of thalamocortical fibers8⇓–10 or nonlesional microstructural degeneration.11 Iron accumulation in the thalamus has also been widely reported,1,3,4,12⇓⇓⇓⇓⇓–18 but it is unclear how it relates to the observed thalamic degeneration.
One possibility is that iron may be an epiphenomenon of thalamic neurodegeneration,19 as has been described in several neurodegenerative disorders, including amyotrophic lateral sclerosis,20 Alzheimer disease,21 and Parkinson disease.21 Alternatively, iron may accumulate as a result of inflammation along tracts that connect with the thalamus, with activated microglia along these tracts expressing high levels of ferritin22⇓⇓–25 and iron being released by degenerating oligodendrocytes and myelin fibers. As iron imaging becomes more recognized as a marker of disease in multiple sclerosis,26 it will become increasingly important to understand the pathophysiologic basis for changes in iron relative to existing markers of atrophy and lesion burden.
The primary aim of our study was therefore to determine the relationship between iron levels in the thalami and thalamic atrophy, using quantitative susceptibility mapping (QSM), an MR imaging technique used to quantify tissue iron concentrations.27 Second, we evaluated whether iron levels in the thalami are associated with T2 lesion burden and the presence of enhancing lesions, reflective of white matter inflammation. Finally, we evaluated whether iron levels in the thalami are associated with markers of global gray matter neurodegeneration, including total gray matter volume and cortical thickness.
Materials and Methods
Subjects
One hundred patients with relapsing-remitting multiple sclerosis from an ongoing, prospective cohort of patients, followed at our Multiple Sclerosis Center from August 2013 through March 2015, were initially included in this retrospective analysis. For homogeneity of the cohort, patients with primary-progressive multiple sclerosis were not included. Five patients were excluded due to poor imaging quality of the QSM or the T1-weighted anatomic sequence, leaving 95 patients in our final analysis. All subjects gave written informed consent for participation in this study, which was approved by our institutional review board. Patient age, sex, use of disease-modifying therapies at the time of the MR imaging, and disease duration since the first clinical symptom were obtained from the medical record.
MR Imaging Data Acquisition and Analysis
All patients underwent our standardized multiple sclerosis research protocol on a 3T scanner (Signa HDxt; GE Healthcare, Milwaukee, Wisconsin) with an 8-channel phased array head coil. The imaging protocol included the following: 1) a 3D T2*-weighted spoiled multiecho gradient recalled-echo sequence (TR/TE = 57/4.3 ms, flip angle = 20°, 416 × 320 matrix, 0.5 × 0.5 × 2 mm3 resolution); 2) a T2-weighted fast spin-echo sequence (TR/TE = 5250/86 ms, flip angle = 90°, 3-mm sections, 416 × 256 matrix); 3) a 3D T2 FLAIR sequence (TR/TE = 6050/140 ms, 0.6 × 0.6 × 1.2 mm3 resolution); and 4) a pre- and postgadolinium 3D inversion recovery–prepared T1-weighted fast echo-spoiled gradient-echo sequence (TR/TE = 8.8/3.4 ms, flip angle = 15°, 256 × 256 matrix, 0.45 × 0.45 × 1.2 mm3 resolution). QSM was reconstructed from the gradient recalled-echo sequence using the morphology-enabled dipole inversion method.28
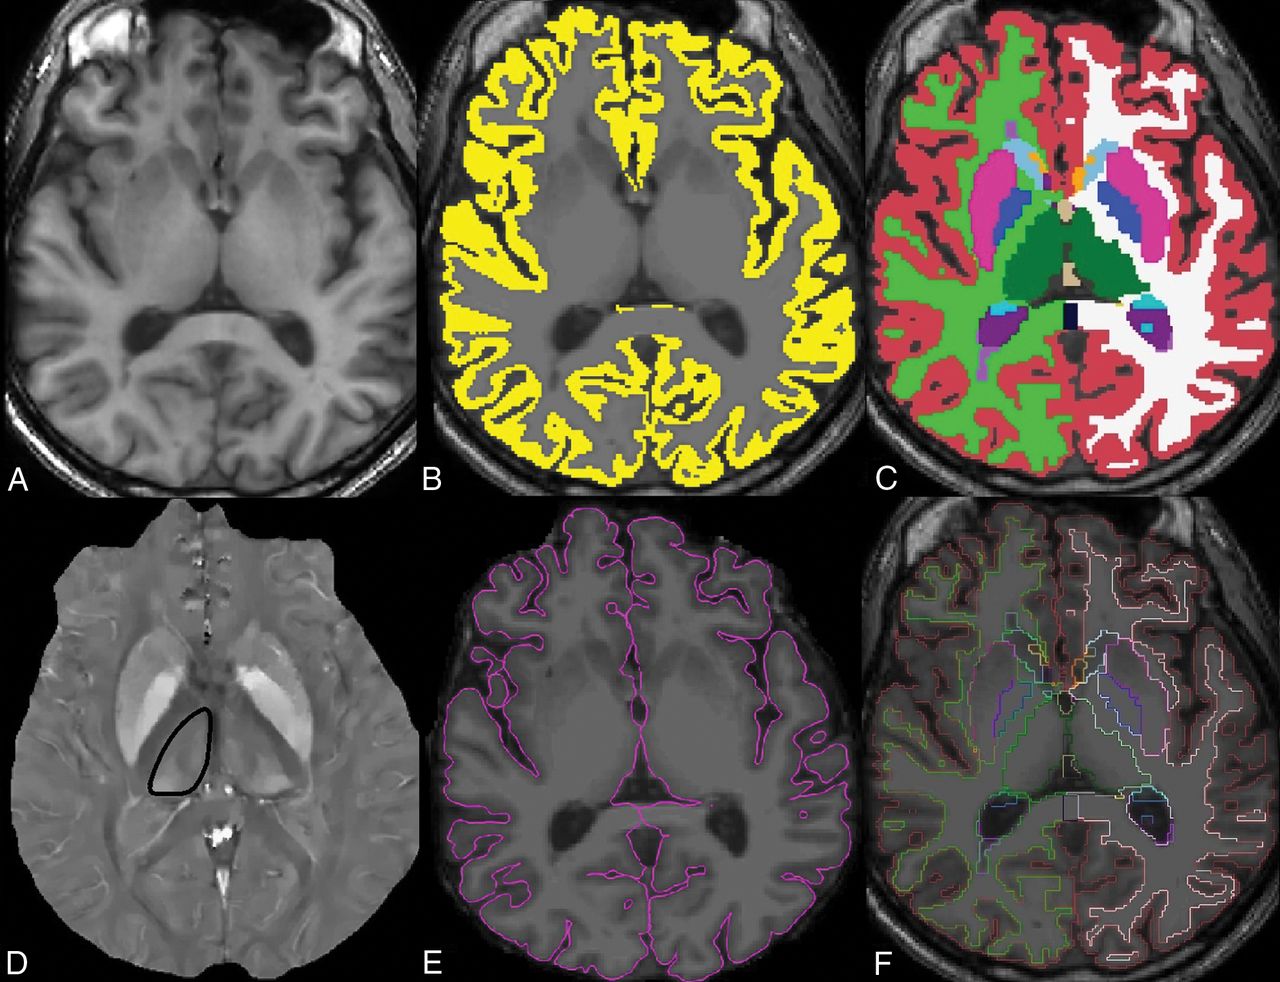
The volumetric 3D T1-weighted images were aligned, skull-stripped, and segmented by using FreeSurfer software, Version 5.1 (http://surfer.nmr.mgh.harvard.edu) to obtain thalamic volumes (Fig 1).29 The left and right thalamic volumes were summed to obtain the total thalamic volume in cubic millimeters. FreeSurfer was also used to obtain total gray matter volume and cortical thickness. 3D T1-weighted images were first segmented into gray matter masks, which were visually checked and manually edited for misclassification. The cortical thickness measurement was then calculated as the shortest distance between each point on the pial surface and the gray/white surface, measured in millimeters. All FreeSurfer analyses were performed by a trained senior research aide with 3 years of experience (E.M.) and visually checked for anatomic accuracy by both the aide and a board-certified neurologist (S.A.G.).

Axial images through the thalami from the 3D T1 MPRAGE sequence (A), with an overlaid gray matter mask (B) and volumetric segmentation (C) from FreeSurfer. Thalamic volumes of interest are shown in green. The quantitative susceptibility map image from the same axial level (D) shows the contoured right thalamus (black outline). The pial boundary (E) is used for cortical thickness estimation, and the segmentation outline (F) is overlaid on the axial T1-weighted image.
The volume of T2-hyperintense white matter lesion load was calculated using FDA-approved software (Olea Sphere 2.3; Olea Medical, La Ciotat, France) (Fig 2). Briefly, 3D volumes of the white matter lesions were created by selecting a seed voxel at the center of the lesions and expanding the volumes of interest to include surrounding voxels of similar signal intensities across all slices. Manual editing was then performed to include or exclude voxels as necessary on the basis of visual inspection.

Axial image from the 3D T2 FLAIR sequence (A) with overlaid volumetric segmentation of T2 lesions (purple) (B) from Olea software processing in the same patient as in Fig 1.
Iron concentrations of the thalami were determined by using syngo.via software (Siemens, Erlangen, Germany). First, QSM maps were fused to the 3D T2 FLAIR images for improved anatomic delineation. Then, with the Volume-of-Interest tool, the upper and lower borders of the thalami were manually delineated by a board-certified radiologist with subspecialty certification in neuroradiology (G.C.C.) (Fig 1). The Contour tool then identified the appropriate margins for the thalami on the intervening slices in semiautomated fashion, and the Nudge tool was used to exclude major veins that could confound the QSM values, particularly the internal cerebral veins and basal veins of Rosenthal. As a zero reference, a small circular ROI was also placed in the CSF in the atrium of each lateral ventricle, adjacent to the thalamus. The relative susceptibility within the thalami was calculated by subtracting the mean susceptibility in the thalami from that in the CSF ROI.
Statistical Analysis
All statistical analyses were performed in STATA, Version 13 (StataCorp, College Station, Texas). A sample size of 95 was determined to have 80% power to detect a correlation coefficient of 0.28 between variables with a 2-sided α of .05.30
Multivariate regression analyses were used to determine whether the relative susceptibility of the thalami was associated with thalamic atrophy, T2 white matter lesion volumes, the presence of enhancing lesions, total gray matter volume, and cortical thickness. Ladder-of-powers quantile-normal plots were assessed to determine the normality of the outcome variables. White matter lesion volume was log-transformed for normalization. Age, sex, disease duration, and use of disease-modifying therapies were included as covariates.
To exclude the potential confounder of age-related T2 white matter lesions on lesion volume, we also repeated the analysis excluding all patients older than 50 years of age.
Results
The mean age of the patients included in this study was 42 ± 10 years, with a range of 25–71 years. Two-thirds of the cohort was female, and one-third, male, reflecting the higher disease prevalence in women. The mean Expanded Disability Status Scale score was 2.2 ± 2.2, with a range of 0–8.5. Fifty-seven of the 95 patients were on disease-modifying agents. Nine had enhancing lesions at the time of the scan. The mean duration of disease since the patient's first reported symptom was 8.9 ± 7.8 years, with a range of 0.3–33.7 years. The mean volume of white matter lesions was 11.0 ± 15.8 mL, with a range of 0.1–122.4 mL. The mean total thalamic volume was 14.0 ± 2.1 mL, with a range of 8.4–20.0 mL. The mean relative susceptibility of the thalami was −29.0 ± 11.7 parts per billion, with a range of −61.5 to 6.4 parts per billion. The mean total gray matter volume was 607 ± 67 mL, with a range of 411–784 mL. The mean cortical thickness was 2.40 ± 0.16 mm, with a range of 1.92–2.68 mm.
The results of the regression analyses are shown in Tables 1 and 2. The relative susceptibility of the thalami was associated with T2 lesion volume both before (P = .037) and after adjusting for covariates (P = .015), with higher thalamic susceptibility associated with a greater T2 lesion burden. Repeating the analysis with patients younger than 50 years of age did not change the results (P = .036), suggesting that age-related white matter lesions were not a significant confounder. Longer disease duration was also associated with greater T2 lesion burden (P < .001), whereas age (P = .25), sex (P = .90), and use of disease-modifying agents (P = .81) were not.
Results of the regression analyses evaluating associations between thalamic susceptibility and thalamic volume, total gray matter volume, cortical thickness, and T2 lesion volume
Results of the regression analyses evaluating whether thalamic susceptibility is associated with baseline characteristics
The presence of enhancing lesions was also associated with higher iron levels before (P = .04) and after (P = .013) adjustment for covariates. Older age was associated with higher iron levels only after adjustment (P = .028).
The relative susceptibility of the thalami was not associated with thalamic volumes, total gray matter volume, or cortical thickness (P = .63, 0.16, and 0.94, respectively).
Discussion
Both thalamic atrophy3⇓⇓⇓–7 and iron deposition1,3,4,12⇓⇓⇓⇓⇓–18 have been reported in patients with multiple sclerosis, but whether these 2 processes are interrelated is unclear. Using QSM to quantify tissue susceptibility, which correlates with iron concentrations in postmortem specimens27,31,32 and is less sensitive to local changes in water content than R2*,33⇓⇓–36 we found no association between thalamic susceptibility and volume. On the other hand, we found that thalamic susceptibility was associated with overall T2 lesion burden and the presence of enhancing lesions.
Several prior studies have described increased thalamic iron levels among patients with multiple sclerosis or clinically isolated syndrome compared with healthy controls.3,4,13,14,17,18 One explanation for this increased iron could be that iron accumulates because of thalamic neurodegeneration. Studies have shown that as neurodegeneration occurs, activated microglia and tissue macrophages that arrive to clear out the iron-rich cellular debris express high levels of ferritin,23⇓–25 perpetuating ongoing oxidative stress, neurodegeneration, and iron accumulation.37⇓–39 A postmortem study of patients with amyotrophic lateral sclerosis confirmed this link between neurodegeneration and iron accumulation, with the susceptibility detected on MR imaging corresponding to iron-rich microglia in the motor cortex.20 Another study described iron accumulation as an epiphenomenon of neuronal damage because iron levels in the basal ganglia of patients with multiple sclerosis were closely associated with the degree of gray matter atrophy and were not elevated early in the disease course in patients with clinically isolated syndrome.19
However, in our cohort, we found no association between iron levels in the thalamic nuclei and thalamic atrophy, suggesting that these may be disparate processes. Our finding is consistent with a prior longitudinal study that reported that short-term changes in iron levels in the deep gray matter of patients with multiple sclerosis appear to occur independent of changes in volume.1 We further found no association between thalamic iron levels and markers of gray matter neurodegeneration, including total gray matter volume and cortical thickness, suggesting that iron accumulation and gray matter neurodegeneration are likely independent processes.
On the other hand, we found that thalamic iron levels were associated with markers of white matter inflammation, including overall T2 lesion burden and the presence of enhancing lesions. Several prior studies have shown that proinflammatory cytokines seen in patients with multiple sclerosis, such as tumor necrosis factor α, interleukin-1, and interferon γ, lead to increases in ferritin40⇓–42 and iron accumulation in the deep gray matter.42,43 Demyelinating lesions disrupting tracts that connect with the thalamus may also result in inflammation, microglial activation, and iron accumulation in the thalami. Studies in animal models have shown that a chemical injection in the region of the striatum results in iron accumulation, not just locally, but also in distant interconnected regions.44,45 In patients, activated microglia expressing ferritin have also been detected along tracts affected by acute subcortical ischemia as an indicator of poststroke inflammation.46 We hypothesize that white matter lesions and inflammation taken together lead to axonal transaction and white matter degeneration in tracts that connect to the thalamus, resulting in thalamic iron accumulation. Although age-related iron accumulation was also noted in our cohort, as has been described in the literature,47 adjusting for age did not weaken the association between the presence of enhancing lesions and thalamic iron accumulation.
This study has several limitations. First, we used manual segmentation of the thalami, which limits reproducibility and use in larger cohorts but better avoids venous contamination of QSM parameters. Second, we did not acquire diffusion tensor imaging data to determine the burden of lesions along specific thalamocortical tracts, which may contribute to iron accumulation. Third, we did not include patients with primary-progressive multiple sclerosis; iron in these patients may accumulate via a different pathophysiologic mechanism. Finally, further confirmation of these findings in larger cohorts is necessary.
Conclusions
Using QSM, we found that iron concentrations in the thalami are associated with T2 lesion burden and the presence of enhancing lesions, both imaging markers of white matter inflammation. Iron concentrations were not found to be associated with local thalamic or global gray matter neurodegeneration.
Footnotes
Disclosures: James Hu—RELATED: Support for Travel to Meetings for the Study or Other Purposes: Weill Cornell, Comments: research award. Yi Wang—RELATED: Grant: National Institutes of Health, Comments: R01NS090464*; UNRELATED: Grant: National Institutes of Health, Comments: R01NS095562, S10OD021782*; Patents (Planned, Pending or Issued): QSM patents*; Stock/Stock Options: Medimagemetric, Comments: Medimagemetric is working with Cornell on commercialization of QSM technology. Susan A. Gauthier—UNRELATED: Grants/Grants Pending: Novartis, Genzyme, Mallinckrodt.* *Money paid to the institution.
This work was supported, in part, by the National Institutes of Health National Center for Advancing Translational Sciences/Clinical and Translational Science Center grant (UL1 TR000457-06), the National Institutes of Health/National Institute of Neurological Disorders and Stroke grant (R01NS090464), and the Weill Cornell Medicine-Qatar Medical Student Research Award.
Paper previously presented, in part, at: Annual Meeting of the America Society of Neuroradiology, May 21–26, 2016; Washington, DC.
Indicates open access to non-subscribers at www.ajnr.org
References
- Received July 24, 2017.
- Accepted after revision November 15, 2017.
- © 2018 by American Journal of Neuroradiology


