
Abstract
BACKGROUND AND PURPOSE: A detailed delineation of the MR imaging changes in the globus pallidus in pantothenate kinase–associated neurodegeneration will be helpful for diagnosis and monitoring of patients. The aim of this study was to determine the morphologic spectrum of the “eye-of-the-tiger” sign and the topographic pattern of iron deposition in a group of patients with pantothenate kinase–associated neurodegeneration.
MATERIALS AND METHODS: Seventy-four MR imaging scans from 54 individuals with PANK2 mutations were analyzed for signal patterns in the globus pallidus. Sixteen SWI data from 15 patients who underwent 1.5T (n = 7), 3T (n = 7), and 7T (n = 2) MR imaging were included to visualize the iron topography.
RESULTS: The linear hyperintensity alongside the medial border of the globus pallidus was the earliest T2 signal change. This finding was evident before SWI changes from iron deposition became visible. T2WI performed in early childhood mostly showed isolated hyperintense signal. In adult patients, marked signal reduction within an earlier hyperintense center resulting from iron accumulation led to the loss of signal difference between the central and surrounding areas. Signal hypointensity on SWI progressed from the medial to the lateral portion of the globus pallidus with increasing age. The fiber connections between the medial globus pallidus and the anteromedial aspect of the substantia nigra and subthalamic nucleus were markedly hypointense on SWI.
CONCLUSIONS: In pantothenate kinase–associated neurodegeneration, the globus pallidus MR imaging changes using SWI develop as region-specific and age-dependent phenomena. Signal inhomogeneity was observed across the globus pallidus in pantothenate kinase–associated neurodegeneration and should be considered when determining the concentration of iron.
Abbreviations:
- PKAN
- pantothenate kinase–associated neurodegeneration
- GP
- globus pallidus
- SN
- substantia nigra
- STN
- subthalamic nucleus
Neurodegeneration with brain iron accumulation is a heterogeneous group of genetic diseases that shares the feature of basal ganglia iron accumulation.1 The diagnosis of neurodegeneration with brain iron accumulation is suspected by combining clinical features and MR imaging evidence of iron accumulation in the brain.1 The most common neurodegeneration with brain iron accumulation disorder is pantothenate kinase–associated neurodegeneration (PKAN), caused by a mutations in the pantothenate kinase 2 (PANK2) gene.1
PKAN is usually suspected when the “eye-of-the-tiger” sign on T2WI is present.2,3 It comprises a central region of signal hyperintensity, reflecting gliosis and edema, and surrounding hypointensity caused by iron accumulation in the globus pallidus (GP).4,5 However, this specific MR imaging sign for PKAN may be absent in early disease stages.3 Isolated GP hyperintensity on T2WI may predate the appearance of surrounding hypointensity related to iron accumulation.3 Additionally, it appears to change with time, obscuring an initially hyperintense center by the accumulation of iron.6 The eye-of-the-tiger sign has been reported to occur as an imaging phenocopy in other conditions, such as neuroferritinopathy, carbon monoxide intoxication, multiple system atrophy, and corticobasal degeneration, and in healthy adults.3,5,7,8 A detailed delineation of the radiographic changes in the GP in PKAN, especially early in the disease, will be helpful for the diagnostic evaluation.
In most cases of PKAN, iron accumulation is limited to the GP and substantia nigra (SN), even in advanced stages.1,2,4 The detection of iron depends on the MR imaging sequence used.4 SWI has shown higher sensitivity for visualization of brain iron than conventional techniques, including T2WI.9 Previous SWI studies demonstrated iron-related signals in the GP and SN.10,11 SWI also showed marked hypointense tracts connecting the GP and SN.10,11 However, their anatomic delineation and clinical significance have not yet been determined.
The aim of this study was to delineate the topographic spectrum of the eye-of-the-tiger sign and pathologic iron accumulation using SWI in individuals with PKAN across the life span and their disease course. On the basis of this analysis, we propose a definition of the eye-of-the-tiger sign that is specific to PKAN.
Materials and Methods
Brain MR imaging scans of patients with PKAN were obtained from the Oregon Health & Science University and Pusan National University Yangsan Hospital using protocols approved by the respective institutional review boards. Seventy-four MR imaging scans were collected on 54 patients with PKAN (mean age at first MR imaging, 13.4 years; range, 9 months ∼ 76 years) with PANK2 mutations from 49 families. Serial MR imaging scans were available for 14 patients: 9 patients with 2 serial scans and 5 patients with 3 serial scans (mean time between scans, 2.08 years; range, 9 months ∼ 5 years). MR imaging was performed with 1.5T (n = 51), 3T (n = 21), and 7T (n = 2) scanners. Two siblings underwent both 3T and 7T MR imaging at the same time point. T2WIs were available for all subjects; the corresponding axial T1WIs were available in 48 MR images from 41 subjects.
To identify the eye-of-the-tiger sign on axial T2WI, we selected 2 consecutive images at the level of and just above the level of the anterior commissure (On-line Fig 1). The presence of a visible round hyperintense center in the anteromedial aspect of the GP at the level of the anterior commissure was considered a key component of the eye-of-the-tiger sign. We divided typical cases with the round hyperintense center into 2 groups according to the surrounding signal intensity. The signal intensity of the surrounding GP area was scored as isointense or hypointense relative to adjacent internal capsule (On-line Fig 1).3 The MR imaging findings were classified as “atypical” in the cases with marked signal reduction within an earlier hyperintense center, which led to the obscuring or loss of signal difference between the central and surrounding areas.
Among 54 patients with PKAN, 16 SWI data from 15 patients who underwent MRI at 1.5T (n = 7), 3T (n = 7), and 7T (n = 2) were analyzed to determine the topography of iron accumulation (On-line Table). One patient had 2 serial SWIs at 3T (patient 9). SWI findings of 2 siblings have already been published (patients 7 and 13).10 We evaluated the following demographic and clinical data: sex; age at clinical evaluation and MR imaging with SWI acquisition; age at onset; family history; clinical features; clinical subtype (classic or atypical based on age at onset and rate of disease progression according to the criteria of Hayflick et al2); and PANK2 mutation data (NM_153638.2). SWI sequences were defined as those with low flip angles acquired with a gradient-echo technique designed to accentuate susceptibility effects (TR, 27–50 ms; TE, 20–40 ms; flip angle, 12°–15°; slice thickness, 2.0–3.0 mm). SWI was created by combining the magnitude and phase images. SWI was viewed in the axial and coronal planes using the open-source OsiriX Imaging Software (http://www.osirix-viewer.com), which provided multiplanar reconstruction views. SWI was used to identify the subthalamic nucleus (STN) and SN. In coronal SWI, the SN lies inferior and medial to the STN.12 T2- and T2*-weighted sequences were excluded from the analysis because they were not sufficiently sensitive to visualize the signal changes in the SN and STN in detail for the determination of iron topography. Five age- and sex-matched healthy individuals served as controls at each field strength (1.5T and 3T).
Because this was a retrospective study, the scans were obtained on different MR imaging scanners with corresponding sequence parameters. Field strength and sequence parameters were taken into account in determining normal-versus-abnormal signal intensity characteristics. T2 or T1 signal intensity in the GP was compared with that in the adjacent normal-appearing white matter. The globus pallidus becomes hypointense with respect to white matter around the end of the first decade of life.13 The signal changes associated with myelination on T1WI and T2WI were considered when evaluating MR imaging scans obtained during infancy and early childhood. All MR images were anonymized without clinical information and presented randomly during the interpretation. To ensure consistency, the same rater (J.-H.L.) rated the MR images. They were then reviewed by the second rater (S.J.H.) to provide independent validation of the results. Any discrepancy between raters was resolved by consensus.
Results
The Eye-of-the-Tiger Sign on T2WI and T1WI
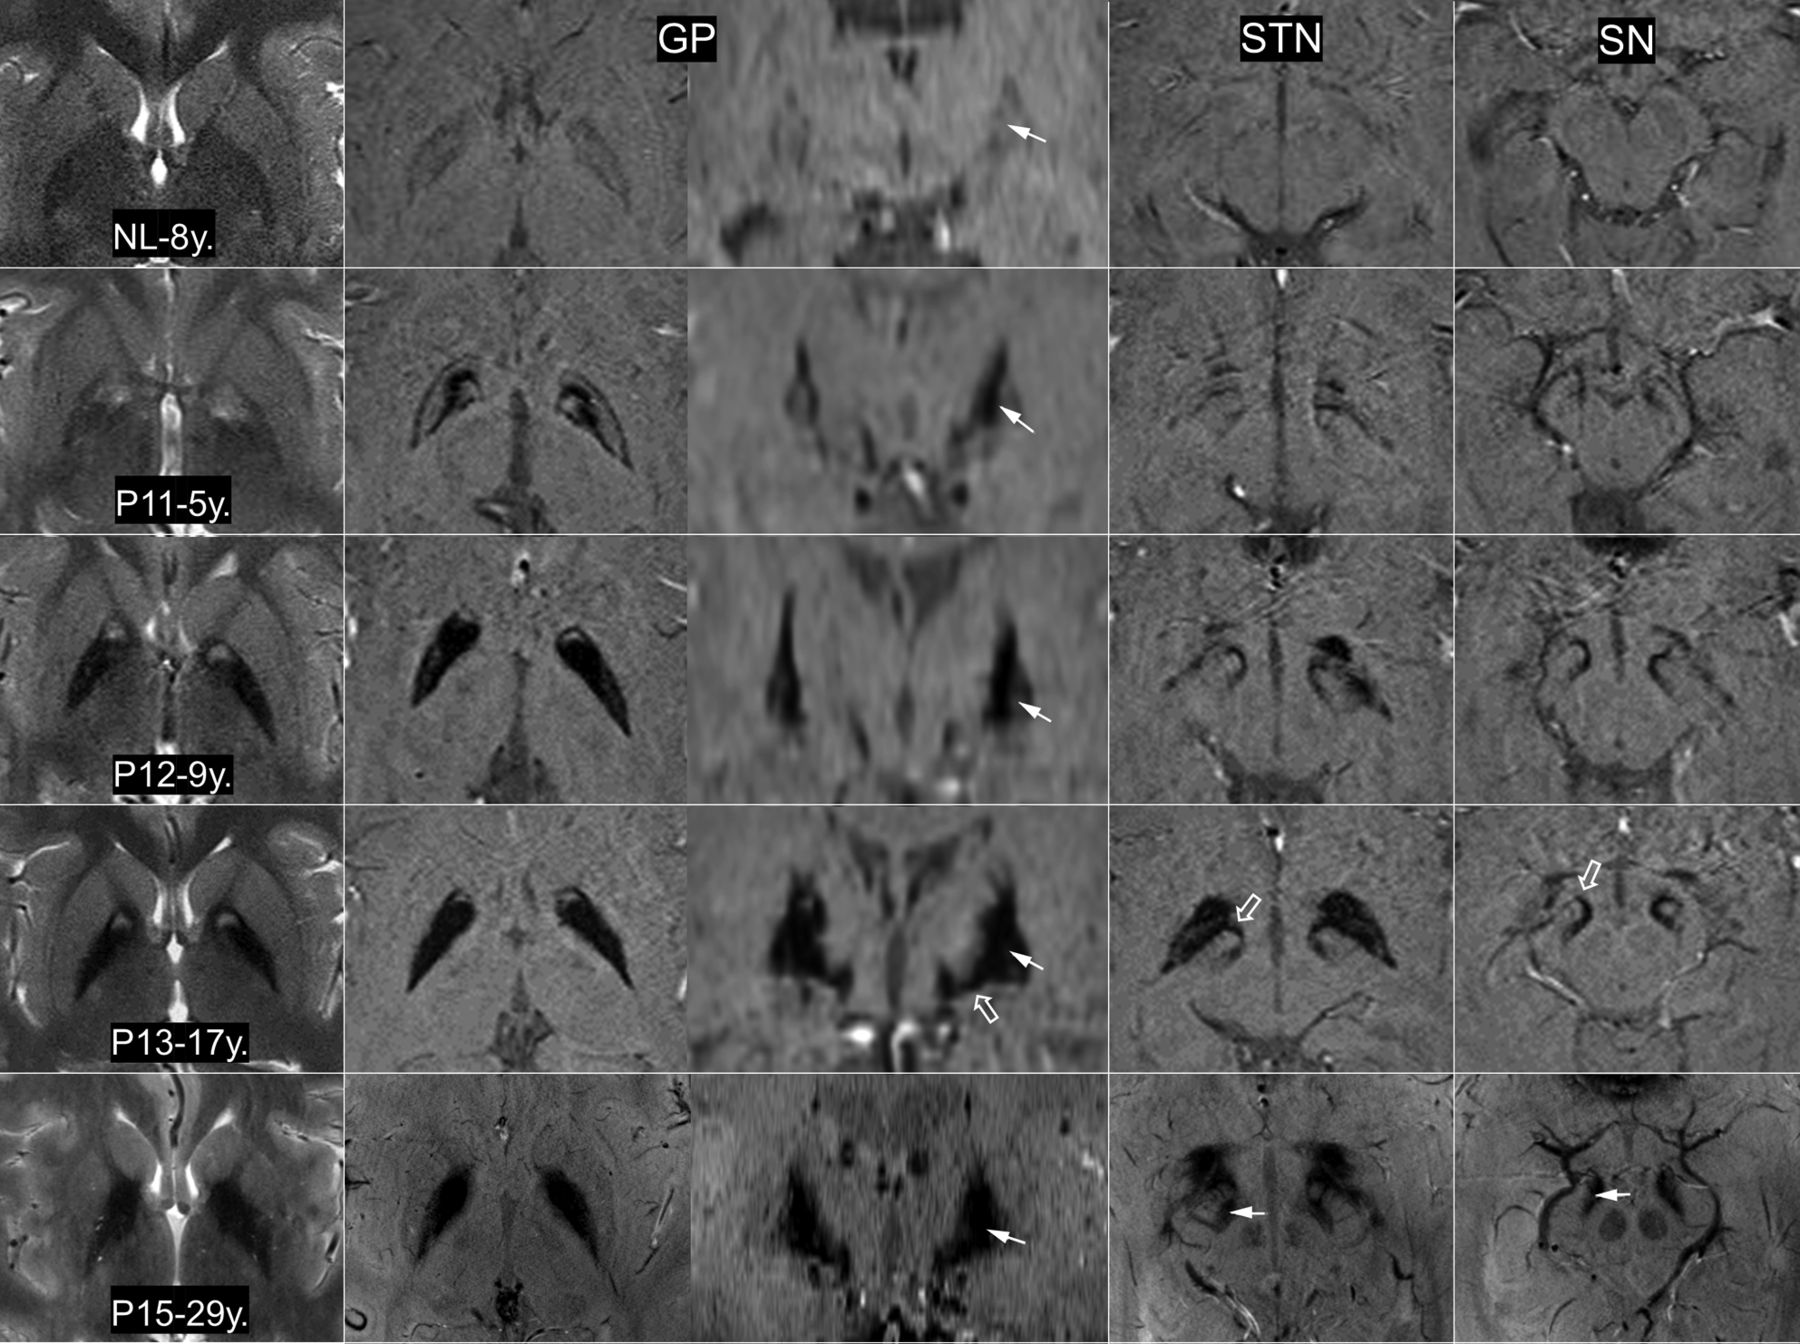
On T2WI, the eye-of-the-tiger sign with the hyperintense round center was observed in 47 MRIs (63.5% of all MRIs) from 42 patients. Among them, 15 MRIs (mean age at MR imaging, 4.7 years; range, 3∼7 years) from 13 patients were found to have an isolated T2-hyperintense center without surrounding hypointensity (Fig 1). At a higher resolution, these hyperintense centers were not confined to the anterior GP but extended to the posterior GP at the level just above the anterior commissure (On-line Fig 1). The posteroinferior portion of the GP appeared isointense. Thirty-two images from 30 patients (mean age at MR imaging, 15.1 years; range, 3∼45) showed surrounding hypointensity related to excessive iron accumulation. The surrounding areas of hypointensity tended to increase in size and decrease in signal intensity with age (Fig 1).

The eye-of-the tiger sign on T2WI and iron topography on SWI at 3T MR imaging (NL, P11, P12, P13) and 7T MR imaging (P15). On T2WI, the round hyperintense center is reduced in size with extension of the surrounding hypointensity. A noticeable difference in signal hypointensity between the medial and lateral segments of the globus pallidus tends to be obscured with increasing age (arrows). The reduction of signal intensity in both the subthalamic nucleus and substantia nigra (P15, arrow) tends to be proportional to that of the GP. The fiber connections of the medial GP with the SN and STN are dramatically visualized (P13, open arrow). NL indicates healthy control; P11/P12/P13/P15, the number of patients in the On-line Table; y., years of age.
None of 12 MR imaging scans from 8 patients younger than 3 years of age had a typical eye-of-the-tiger sign. The round hyperintense center in the anteromedial GP was observed at older than 3 years of age. Seven MRIs from 6 patients (mean age at MR imaging, 2.15 years; range, 22 months ∼ 3 years) showed linear T2-hyperintensity that streaked along the medial border of the GP (Fig 2). In 4 of those 6 patients, the round hyperintense centers were visualized in the follow-up scans.
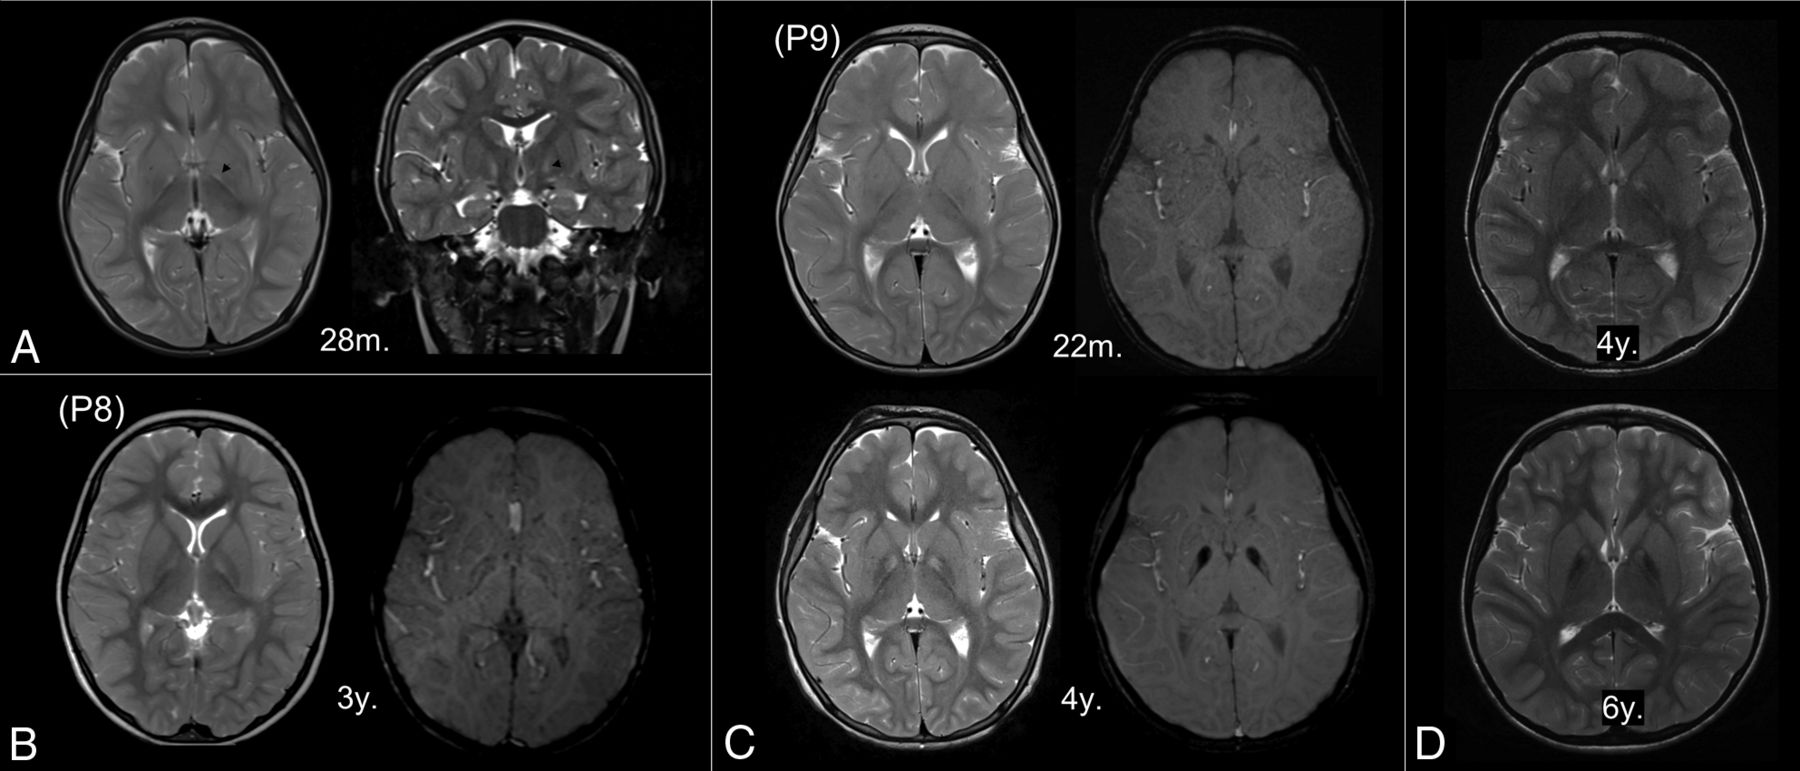
Early MR imaging changes in the globus pallidus. The linear T2-hyperintensity that streaks along the medial border of the GP is the earliest T2 change (A, arrowhead). The round center in the anteromedial aspect is first observed at 3 years of age (B, left). Subtle hypointensity is also detected on the susceptibility-weighted image (B, right). In patients with serial MRIs (C and D), iron-related hypointensity becomes definitely evident by 4 years of age with the appearance of an isolated T2-hyperintense center (C). The surrounding areas decrease in signal intensity with age (D). P8 and P9 indicate the number of patients in the On-line Table; m., months of age; y., years of age.
Eleven patients presented with atypical imaging features in their 13 MR imaging scans (mean age at MR imaging, 27.1 years; range, 5∼76 years). All of them showed marked signal reduction without clearly visible round hyperintensity in the GP (Fig 3). The dark streak between the medial and lateral segments of the GP extended anteriorly into the hyperintense center. In cases without a hyperintense center, hyperintense streaking was frequently observed in the central region.6 Three patients did not show any hyperintense focus within the GP. In these cases, T2-hypointensity almost always extended into the genu of the internal capsule (Fig 3). Bilateral GP calcification was observed in 3 among 7 patients who underwent brain CT. In 1 patient at 5 years of age, the hyperintense center was obscured probably by calcification (Fig 3). The dark streak was observed within the hyperintense center in the other patient at 4 years of age.
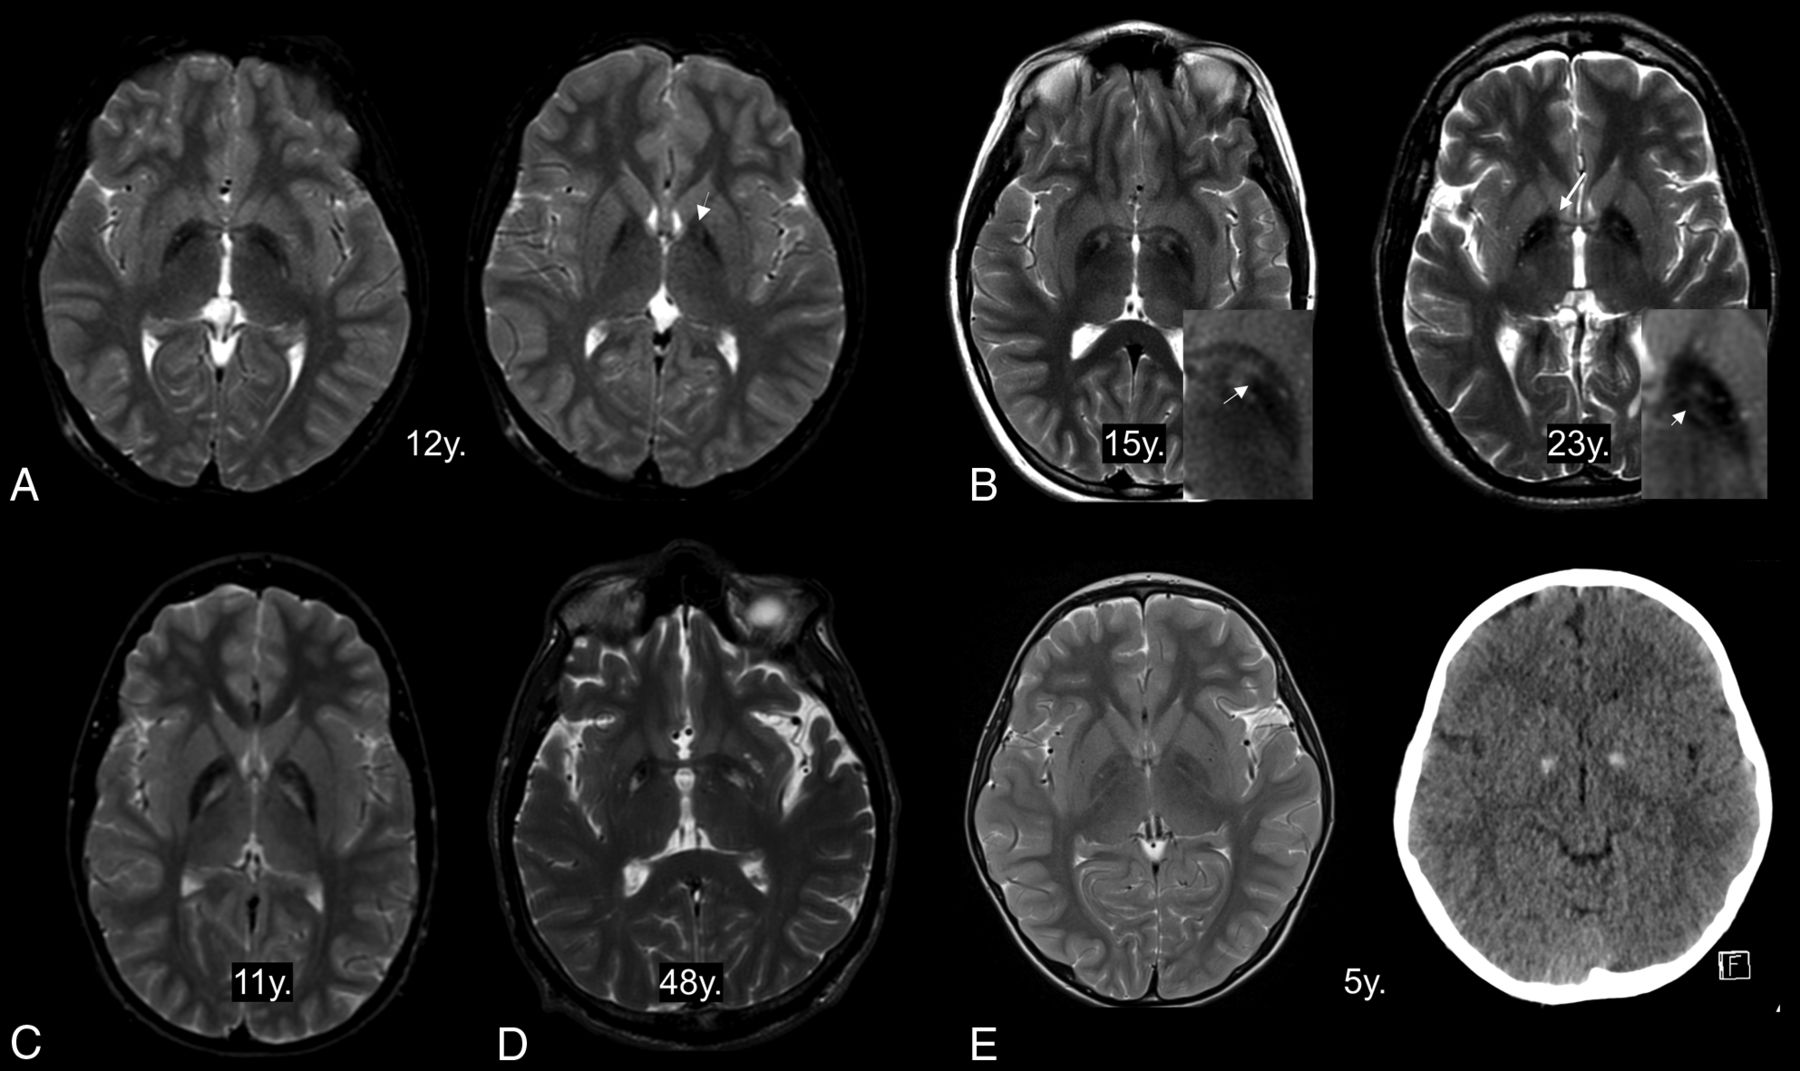
Atypical features of the eye-of-the-tiger sign. The hyperintense area in the anteromedial globus pallidus has totally disappeared at the anterior commissural level (A, left) but is partly visible at just above that level (A, right, arrow). The dark streaks extend into the hyperintense centers (B, left, arrow). The remaining component of hypointensity is observed as hyperintense stripes (B, right, short arrow). T2-hyperintensity extends into the genu of the internal capsule (B, right, long arrow). The hyperintense areas are unusually located in the whole medial GP (C) and posterior GP (D). The hyperintense center is obscured in a patient with GP calcification (E). y. indicates years of age.
Signal changes were commonly observed on T1WI. There were 48 of these MRIs reviewed. The region of T2-hyperintensity appeared hypointense on T1WI in 25 MRIs (52%) from 24 patients (mean age at MR imaging, 12.6 years; range, 4∼76 years) (On-line Fig 2). Thirty-two MRIs (66%) from 30 patients (mean age at MR imaging, 15.9 years; range: 4∼76 years) showed T1-hyperintensity in the region of T2-hypointensity.
Iron-Related Hypointense Signal on SWI
The clinical and imaging features from 15 patients with SWI are summarized in the On-line Table. In our case series, signal hypointensity on SWI with an isolated T2-hyperintense center was first detected in a 3-year-old patient (Fig 2). In a patient with serial MRIs, SWI hypointensity was not evident at 22 months of age. The follow-up SWI at 4 years of age showed the typical pattern of iron deposition accompanied by the appearance of an isolated T2-hyperintense center in the GP. In patients with isolated T2-hyperintensity, SWI showed marked iron-related hypointense signal contiguous with the medial aspect of the GP (On-line Fig 3). There was a noticeable difference in signal intensity between the medial and lateral segments of the GP (Fig 1). SWI signal hypointensity was greatest medially. This SWI signal difference across the GP tended to be obscured and lost as the surrounding T2-hypointensity became more evident. The reduction of signal intensity in both the STN and SN tended to be proportional to that of the GP (Fig 1). SWI showed marked hypointense tracts connecting the medial portion of the GP and the STN. The hypointense connecting tracts ran medially through the crus cerebri from the pars reticulata of the SN. They were more prominent in the rostral and anterior portions of the SN. All hypointense areas showed similar tendencies toward decreasing signal intensity with age. MR imaging with a higher field strength provided better spatial and contrast resolution. Two siblings underwent 7T MR imaging, which showed iron deposition in the SN and STN and their connecting tracts more clearly.
Discussion
In this study, we demonstrated a wide morphologic spectrum of the eye-of-the-tiger sign and the characteristic pattern of iron deposition using SWI. However, this study is limited by a retrospective collection of cases, simple visual assessment without quantitation, and intersite or interscanner variability in the MR imaging sequence parameters. Despite these limitations, important conclusions can be drawn from this large series.
The MR imaging signal pattern in the GP was found to differ within subjects as their age increased and disease advanced, as well as across subjects depending on the extent of surrounding hypointensity resulting from iron accumulation. The typical eye-of-the-tiger sign with surrounding hypointensity was observed in only about half of the patients. T2WI performed in early childhood mostly showed the round center without surrounding hypointensity (Fig 4). In adult patients older than 20 years of age, the hyperintense center was often condensed, streaked, or entirely lost, presumably due to increased iron accumulation. With the increase and extension of iron deposition, the hyperintense center varied in shape from small round to streaked. In addition to the effects from iron, the T2-hyperintense area of the sign was probably obscured by diamagnetic calcium deposits in some cases.14
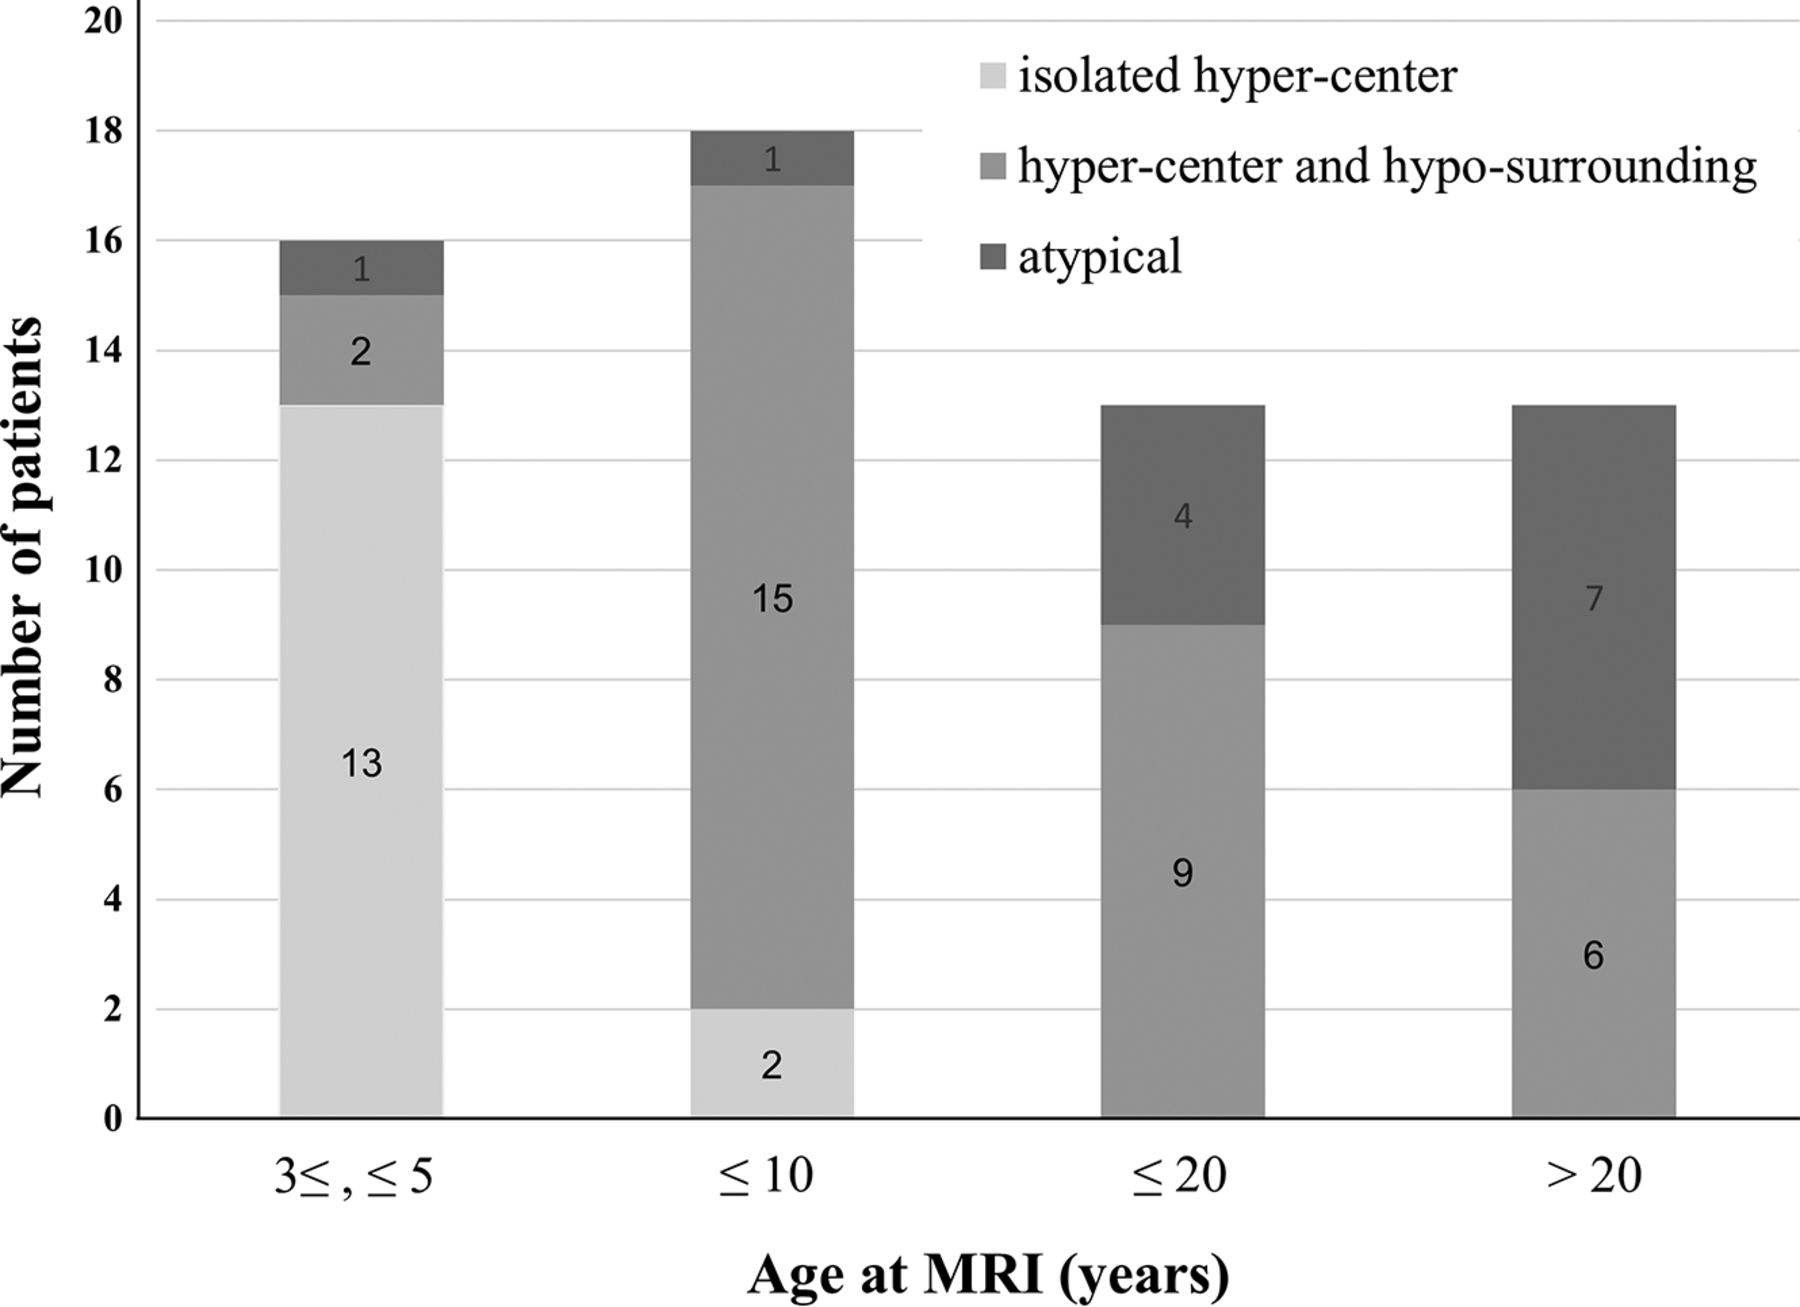
Graph shows the age distribution of the eye-of-the tiger sign classified into 3 categoric patterns. “Hyper-center” indicates T2-hyperintense center of the GP; “hypo-surrounding,” the surrounding area with T2-hypointensity; atypical, atypical features.
The isolated hyperintense center on T2WI of the GP has been described as the earliest MR imaging change in patients with PKAN.3 Additionally, we found it present as a linear T2-hyperintense signal that streaks along the medial border of the GP in children younger than 3 years of age. This finding was evident before SWI changes from iron deposition became visible. The current understanding of PKAN pathogenesis and the sequence of cellular changes supports tissue edema and gliosis arising from the primary metabolic insult and preceding the accumulation of iron.15 Notably, in the early change, the posteroinferior portion of the GP appeared isointense or without signal changes, suggesting less tissue damage from a primary metabolic insult. The efficacy of deep brain stimulation from previous reports also suggests that this area may retain greater preservation of functional activity than the anteromedial region of the GP.16
The detection of the eye-of-the-tiger sign can be influenced by MR imaging acquisition settings, such as axis plane or thickness. The T2-hyperintense center in the anteromedial region is typically visible at the level of anterior commissure. The sensitivity for detecting the sign depends on the MR imaging sequences. Signal changes reflecting gliosis or iron deposits were also observed on T1WI, though the sensitivity of T1WI was much lower than that of T2WI. SWI clearly depicted the increase and extension of iron deposition in the white matter, small structures such as the STN and SN, and the corresponding area of T2-hyperintensity. Even in cases of isolated T2-hyperintense centers, SWI showed the specific pattern of iron deposition. This is because SWI is less affected by factors such as myelin loss and changes in water concentration than other conventional sequences using T2 methods.9
In PKAN, the signal hypointensity on SWI progressed from the medial to the lateral portion of the GP with increasing age and advancing disease. Although rigorous serial follow-up data are lacking, topographic spreading of iron deposition does not clearly correlate with the duration or severity of disease symptoms.3,6 Our observations are most consistent with age-related patterns of iron deposition. In previous investigations using in vivo MR imaging, iron deposition increased with age in the GP, occurring first in the internal GP and progressing from the medial to the lateral aspect during normal brain development and aging.17 The region-specific pattern of iron deposition in normal aging can be enhanced and observed in pathologic conditions, such as parkinsonian variant multisystem atrophy, in which iron deposits mostly in the posterolateral part of the putamen are in line with the aging pattern.18,19
The ability to quantify the iron content in the GP of patients with PKAN would help to understand disease progression and possibly monitor treatment response as disease-modifying agents are developed. There have been attempts to quantify iron stores in vivo in patients with PKAN, in which the surrounding hypointense area of the GP was usually used to determine the concentration of iron.11,20,21 However, most studies, including clinical trials of the iron-chelating drug deferiprone in PKAN, used single or 2 consecutive, manually drawn ROIs of the 2D images without delineating the exact boundaries of the GP.22,23 Signal inhomogeneity across the GP observed in this study should be considered when determining the concentration of iron.
Involvement of the SN and STN in previous studies may have been underestimated due not only to less sensitive sequences for the detection of iron but also less spatial resolution to discriminate among structures.3,7 SWI dramatically visualizes the paramagnetic signals from iron deposition around the fiber connections of the GP with the SN and STN. The findings of increasing iron deposition along these tracts in proportion to GP iron content, with a trend toward higher levels in their rostral connection to the GP, may suggest an underlying spreading process.24 The damage to white matter tracts could represent neural network dysfunction. Similar paramagnetic susceptibility was detected in the pallidoreticular pathways after carbon monoxide intoxication and was related to worse neuropsychiatric performance and a greater likelihood of parkinsonism.25 In a previous diffusion tensor imaging study of PKAN, the alterations in white matter integrity were more widespread, affecting mainly the connections between the basal ganglia and the frontal regions.26 However, the correlation of white matter damage with clinical parameters in patients with PKAN has not been fully elucidated.
Conclusions
The eye-of-the-tiger sign specific for PKAN was better defined using SWI in combination with T2WI. The morphology of the sign was found to differ depending on the extent of iron accumulation. Iron-related SWI changes in the GP develop as region-specific and age-dependent phenomena, which may contribute to the better understanding of the disease process in PKAN.
Acknowledgments
We thank the Advanced Imaging Research Center and the Oregon Opportunity partnership for advancing biomedical research. The AIRC helped us obtain the 7T MRI data.
Footnotes
Jae-Hyeok Lee and Susan J. Hayflick contributed equally to this work.
References
- Received August 20, 2017.
- Accepted after revision October 31, 2017.
- © 2018 by American Journal of Neuroradiology


