
Abstract
BACKGROUND AND PURPOSE: A lower radiation dose can have a detrimental effect on the quality of head CT images. The aim of this study performed in a pediatric population was to test whether an image-processing algorithm (Correlative Image Enhancement) based on the correlation among intensities of neighboring pixels can improve gray-white differentiation in head CTs.
MATERIALS AND METHODS: Sixty baseline head CT images with normal findings obtained from scans of 30 children were processed using Correlative Image Enhancement to produce corresponding enhanced images. Gray-white differentiation in baseline and enhanced images was assessed quantitatively by calculating the contrast-to-noise ratio and conspicuity in equivalent ROIs in gray and white matter. Two masked readers rated the images for visibility of gray-white differentiation on a 5-point Likert scale. Differences in both quantitative and qualitative measures of gray-white differentiation between baseline and enhanced images were tested for statistical significance. P values < .05 were considered significant.
RESULTS: Image processing resulted in improvement in the contrast-to-noise ratio (from 1.86 ± 0.94 to 2.26 ± 1.00, P = .02) as well as conspicuity (from 37.28 ± 11.56 to 46.4 ± 11.5, P < .001). This was accompanied by improved subjective visibility of gray-white differentiation as reported by both readers (P < .01).
CONCLUSIONS: Image processing using Correlative Image Enhancement had a beneficial effect on quantitative measures of gray-white differentiation. This translated into improved perception of gray-white differentiation by readers. Further studies are needed to assess the effect of such image processing on the detection of disease processes using head CTs.
ABBREVIATIONS:
- CIE
- Correlative Image Enhancement
- CNR
- contrast-to-noise ratio
- GWD
- gray-white differentiation
- SI
- signal intensity
Differentiation of gray and white matter on head CTs is important in the recognition of normal structures as well as identification of pathologic changes within brain parenchyma.1⇓–3 Accordingly, it has long been used as a measure of the diagnostic quality of head CT images.3 The ease of gray-white differentiation is adversely affected by the presence of noise, which, while being inherent in the process of image generation, can be particularly prominent when images are acquired at a lower radiation dose. This is the case with pediatric head CTs, which, in response to increased awareness and concern about radiation-induced harm, are often acquired using aggressive dose reduction.4⇓⇓⇓⇓–9 A number of optimization techniques have been developed that aim to maintain diagnostic quality while reducing radiation exposure.10⇓⇓⇓⇓⇓⇓–17 Many of these strategies such as tube current modulation or use of iterative reconstruction techniques are applicable at the level of image generation or reconstruction at the scanner.10,11,15⇓–17 In addition, some image postprocessing techniques have been proposed that can improve gray-white differentiation on head CT images after they have been generated.13
Correlative Image Enhancement (CIE, patent pending) is an image-processing algorithm that aims to increase the conspicuity of details of interest within digital images by targeted noise reduction and contrast optimization.18⇓–20 Using both qualitative and quantitative measures such as conspicuity and contrast-to-noise ratio (CNR), we aimed to test whether CIE improved gray-white differentiation (GWD) in pediatric head CT images with normal findings.
Materials and Methods
This retrospective, institutional review board–approved, Health Insurance Portability and Accountability Act–compliant study was approved by the institutional review board at Washington University in Saint Louis with a waiver of consent for using existing data.
Patient and Image Selection
We identified head CTs of 30 children (17 males, 13 females; mean age, 7.5 ± 5.6 years) performed during 1 month in 2014, and with normal findings. These included 15 children scanned with our routine “low-dose” head CT protocol with aggressive dose reduction (100 kV[peak], 89 ± 16 mA, 137 ± 27 mGy × cm dose-length product) and 15 children scanned with our “standard” protocol with less aggressive dose reduction (100 kVp, 302 ± 72 mA, 486 ± 121 mGy × cm dose-length product). At our institution, all head CTs of children are acquired using a low-dose protocol except for patients with head trauma and those in the intensive care unit. All scans had been performed with an FOV range of 150–230 mm and slice thickness of 4 mm. From each study, we selected 2 images, one across the basal ganglia and the other through the centrum semiovale. These 60 baseline images were converted into Portable Network Graphics format for processing.
Image Processing
Image processing was performed by one of the coauthors using CIE, an algorithm developed by him, within Matlab (MathWorks, Natick, Massachusetts) to generate corresponding enhanced images. This coauthor did not participate in subsequent image or statistical analysis. The algorithm modified the intensity of each pixel in the image on the basis of its intensity and that of its neighboring pixels relative to a threshold intensity defined by the user. This threshold was chosen at a level in-between the intensities of normal-appearing white matter and gray matter. This process aimed to simultaneously correct the variations in the pixel intensities induced by noise (Fig 1) and to exaggerate the difference between the intensities of pixels around the chosen threshold. The enhanced images thus created were saved as individual files in Portable Network Graphics format. The size of baseline and enhanced images was identical.

These images represent 9 contiguous pixels representing the same structure that spans these pixels. In an ideal noise-free image (A), these 9 pixels would have identical intensities. The presence of noise that invariably accompanies digital images causes intensities of some of these pixels to be higher or lower than expected (B). Modifying the intensities of pixels (asterisk) on the basis of the preponderance of intensities (plus sign) in their neighboring pixels can mitigate the effect of noise (C).
Quantitative Image Review
All baseline and enhanced images were converted into DICOM format using the JPEG to DICOM plugin for Osirix Lite (Pixmeo, Bernex, Switzerland) for quantitative analysis. Means (SI) and SDs of the gray matter (gm) and the white matter (wm) intensities were measured from equivalent ROIs in the baseline and enhanced images (Fig 2). These measurements were then used to calculate gray matter conspicuity and the CNR between gray and white matter using the following formulae:
 For images obtained at the ganglionic level, GM was sampled in the putamen and white matter in the frontal lobe. For the supraganglionic images, GM was sampled along the cerebral convexity and the white matter within the centrum semiovale.

Axial head CT image across the centrum semiovale before (baseline image) and after (enhanced image) processing with CIE, with equivalent ROIs used to measure gray and white matter intensities. These measurements were used to calculate the conspicuity of gray matter and CNR between gray and white matter.
Qualitative Image Review
Two blinded readers (a board-certified neuroradiologist with 10 years of practice experience and a neuroradiology fellow) who did not participate in the image processing rated the ease of perception of GWD in each image on a predefined 5-point scale ranging from 1 (imperceptible GWD) to 5 (very easily perceptible GWD). Readers also rated the presence of artifacts within the image on a 3-point scale (1, artifacts making the image nondiagnostic; 2, some artifacts but the image is still diagnostic; 3, no artifacts present). Images were presented to the readers in fixed display settings that were identical for baseline and enhanced images.
Statistical Analysis
We analyzed the baseline data to assess the association between the qualitative measure of GWD (mean GWD ratings provided by 2 readers) and quantitative measures (conspicuity and CNR) using regression analysis. As part of this analysis, residuals were assessed for normality with the Shapiro-Wilk W test. If residuals were normally distributed (Shapiro-Wilk W, P value > .05), least-squares regression analysis was used to determine the product-moment correlation coefficient (r) and the coefficient of determination (r2). If residuals were non-normally distributed (Shapiro-Wilk W, P ≤ .05), the Spearman ρ rank correlation coefficient was calculated.
To test the effect of image processing on conspicuity and CNR, we tested differences between variables on baseline and enhanced images for normality with the Shapiro Wilk W test, and equality of variances was tested with the F test. If data distributions were normal (Shapiro-Wilk W, P value > .05) and variances were equal (F test, P value >.05), the 2-tailed t test was used. If either or both of the data distributions were non-normally distributed (Shapiro-Wilk W, P value ≤ .05) and/or variances were not equal (F test, P value ≤ .05), the 2-tailed Mann-Whitney U test was used. Because most comparisons involved non-normally distributed data, boxplots of results were used to illustrate differences.
To assess the effect of image processing on the qualitative perception of GWD, we subtracted baseline GWD and artifact ratings from corresponding enhanced ratings. Positive numbers indicated beneficial effects of image enhancement, and negative numbers indicated detrimental effects of image enhancement. The normality of the data distributions for differences in ratings was tested with the Shapiro-Wilk W test, and all distributions were non-normal (P < .05); therefore, minimum, maximum, and median values plus 25th and 75th quantiles (quartiles) were used for descriptive statistics. In addition, the number of positive and negative differences was determined. The 1-sample, signed rank test (2-tailed, with a test value of zero) was used to assess the probability of obtaining the observed differences (or more unlikely differences) if the null hypothesis that there was no difference between baseline and enhanced images was true.
The effect of image processing was also assessed for subgroups with 2 distinct radiation levels used.
P ≤ .05 was considered statistically significant. Statistical analyses were performed with JMP Pro Statistical Software, Release 12.0.1 (SAS Institute, Cary, North Carolina) and MedCalc Statistics for Biomedical Research, Version 17.2, (MedCalc Software, Ostend, Belgium; https://www.medcalc.org; 2017).
Results
Correlation between Qualitative and Quantitative Measures of GWD
At baseline, gray matter conspicuity was 37.3 ± 11.6 with a baseline CNR between gray and white matter of 1.9 ± 0.9. The mean GWD rating assigned by 2 readers on baseline images was 3.2 ± 0.9. A positive correlation was observed between the mean GWD rating and both conspicuity (r = 0.29; 95% confidence limits, 0.035, 0.50; r2 = 0.08; P = .027) and CNR (ρ = 0.54; 95% confidence limits, 0.33, 0.70; P < .001).
Effect of Image Processing on Quantitative Measures of GWD
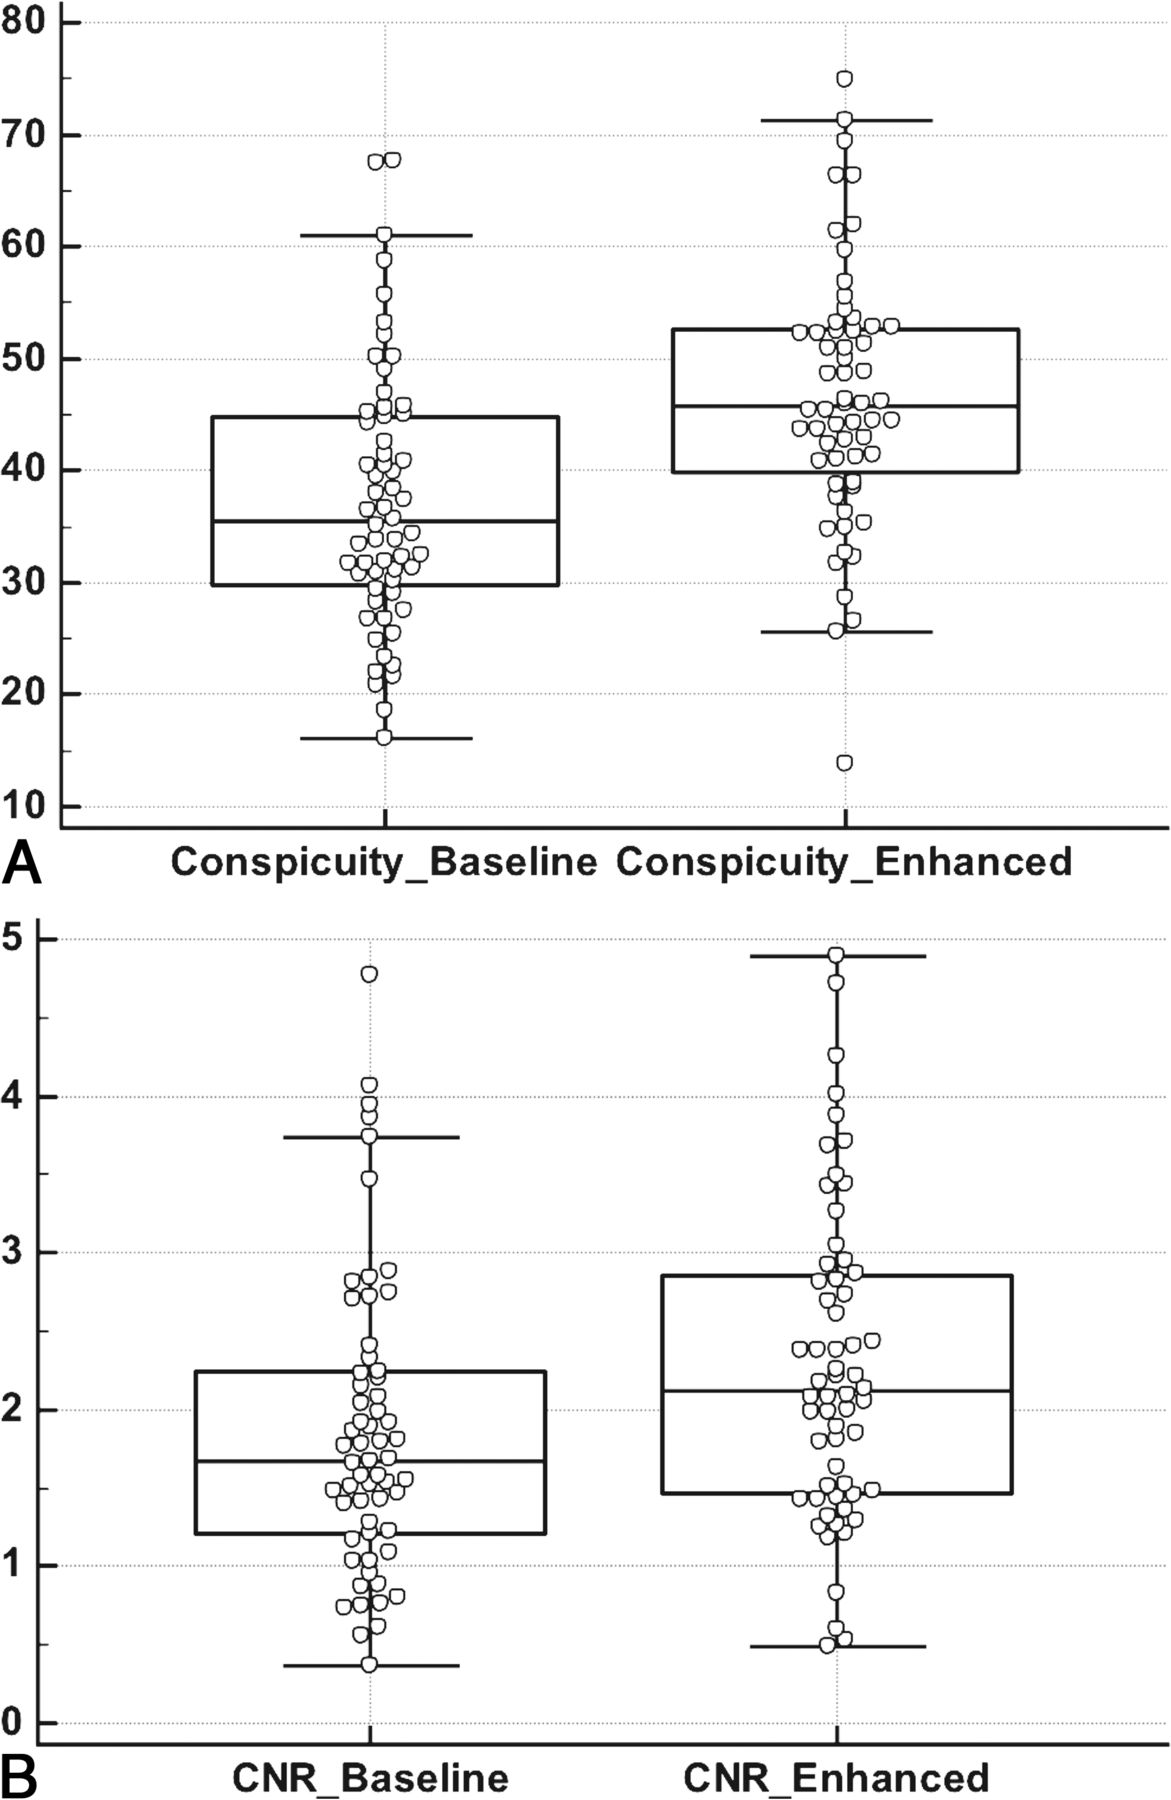
Image processing resulted in a significant (P < .001) increase in the gray matter conspicuity from a value of 37.3 ± 11.6 on baseline images to 46.4 ± 11.5 on enhanced images (Fig 3A). Similarly, the CNR between gray and white matter on the enhanced images (2.3 ± 1.0) represented a significant increase from the corresponding baseline value of 1.9 ± 0.9 (Fig 3B, P = .02).

Boxplots showing the distribution of gray matter conspicuity (A) and CNR between gray and white matter (B) in 60 paired head CT images with normal findings before (baseline) and after (enhanced) processing with CIE. Both of these quantitative measures of gray-white differentiation demonstrated significant improvement following image processing (P < .001 for conspicuity; P = .015 for CNR).
For patients scanned using standard protocol, conspicuity increased from 38.3 ± 12.3 at baseline to 47.5 ± 11.2 (P < .001) on enhanced images, and CNR increased from 2.3 ± 1.0 at baseline to 2.8 ± 0.9 (P = .024) on enhanced images. For the subgroup scanned with the low-dose protocol, there was significant improvement (P = .003) in conspicuity from a baseline value of 36.3 ± 10.9 to 45.4 ± 11.9 on enhanced images. While CNR increased by 24% from a baseline value of 1.4 ± 0.6 to 1.7 ± 0.7 on enhanced images, differences did not reach significance (P = .058).
Effect of Image Processing on Qualitative Perception of GWD
Reader 1 assigned a median GWD rating of 4 to baseline images (range, 1–5; 25th quartile 3; 75th quartile 4) and a median GWD rating of 5 to enhanced images (range, 2–5; 25th quartile 5; 75th quartile 5). For reader 2, the median baseline GWD rating was 3 (range 1–5; 25th quartile 2; 75th quartile 3) and the median enhanced GWD rating was 3 (range, 1–5; 25th quartile 3; 75th quartile 4). For both readers, these ratings constituted a significant improvement in the GWD rating following image processing (Fig 4, P < .01). Improvement in the GWD rating was observed for images obtained with standard protocol and for images obtained with low-dose protocol (P < .01 for each reader in each group). There was no difference in the artifact ratings of baseline and enhanced images assigned by either reader (P = .11 for reader 1 and P > .99 for reader 2).

Clustered columns showing the distribution of qualitative GWD ratings assigned by 2 blinded radiologists to baseline and enhanced images on a 5-point Likert scale ranging from 1 (imperceptible GWD) to 5 (very easily perceptible GWD). The vertical axis shows the percentage of all cases assigned a given GWD rating. A favorable shift toward higher GWD ratings was seen with image processing for both radiologists (P < .01).
Discussion
Increasing recognition of the adverse effects of radiation has prompted efforts to reduce the radiation dose used to obtain diagnostic CT scans, especially in the pediatric population.9,21⇓–23 A lower signal-to-noise ratio, resulting from a reduction in the radiation dose,21 can, however, adversely affect the visibility of gray-white matter differentiation on pediatric head CTs. By demonstrating an objective improvement in CNR and the conspicuity of GWD, our results indicate that image processing using CIE may help in mitigating some of the detrimental effects of the lower radiation dose on head CT. The beneficial effect of this image processing was observed even in scans that were obtained with an aggressive dose-reduction protocol. Our results are similar to those of Bier et al,13 who achieved improvement in GWD in adult head CTs using a different image-processing algorithm based on the frequency-selective nonlinear blending. Both studies are also similar in demonstrating that such improvement in GWD can be achieved without inducing any appreciable artifacts. These image-processing algorithms are, however, dissimilar in that CIE, being based on the continuity of structures, is technique-neutral and has been used both for enhancing CT and MR images.20
Radiologists routinely adjust the window and level of digital radiologic images to optimize the contrast needed for easy visualization of details of interest such as GWD.24⇓⇓–27 Such contrast optimization, however, does not affect the relative intensity values assigned to individual pixels on the Hounsfield unit scale and would not be expected to improve the inherent CNR between gray and white matter. On the other hand, our image-processing algorithm improved the GWD by modifying relative assigned values of individual pixel intensity for pixels representing gray and white matter as indicated by improved CNR. The image algorithm used by Bier et al13 appears to have a similar effect because they described the signal intensity (SI) of cortical gray matter after image processing as approximately 60, a level that would not be expected for normal gray matter on the Hounsfield unit scale. While previous authors described this newly assigned intensity level in terms of Hounsfield units, it may not be appropriate because the newly assigned intensities may not align with the expected value of certain tissues on the Hounsfield unit scale.
Both quantitative measures of GWD correlated with and translated into easier perception of GWD by both readers (Fig 4). This may indicate that the beneficial effects of this tool may help readers of different experience levels. Given the subjective nature of the GWD rating scale, one reader rated the images more critically than the other (Fig 4). These differences could either represent an actual difference in the ease of GWD perception between readers or differences in the expectation of best possible GWD achievable on head CT images. While we are not able to postulate the exact cause for these differences, improved GWD perception was noted for each reader irrespective of their baseline ratings. Improved perception of GWD can be expected to be helpful for diagnosing diseases in which it is lost (such as ischemic infarction, encephalitis) as well as for diseases in which gray matter is unduly thickened (such as malformations of cortical development).1,2,28⇓⇓–31 Using the same image-processing algorithm that improved GWD on head CT images with normal findings, previous investigators were able to improve the accuracies of radiologists in diagnosing acute infarction and encephalitis on head CTs.13,30,32 Further studies are needed to test whether improved gray-white differentiation afforded by CIE on head CT images can translate into similar improved sensitivity for the detection of disease processes such as ischemic infarcts (Fig 5).
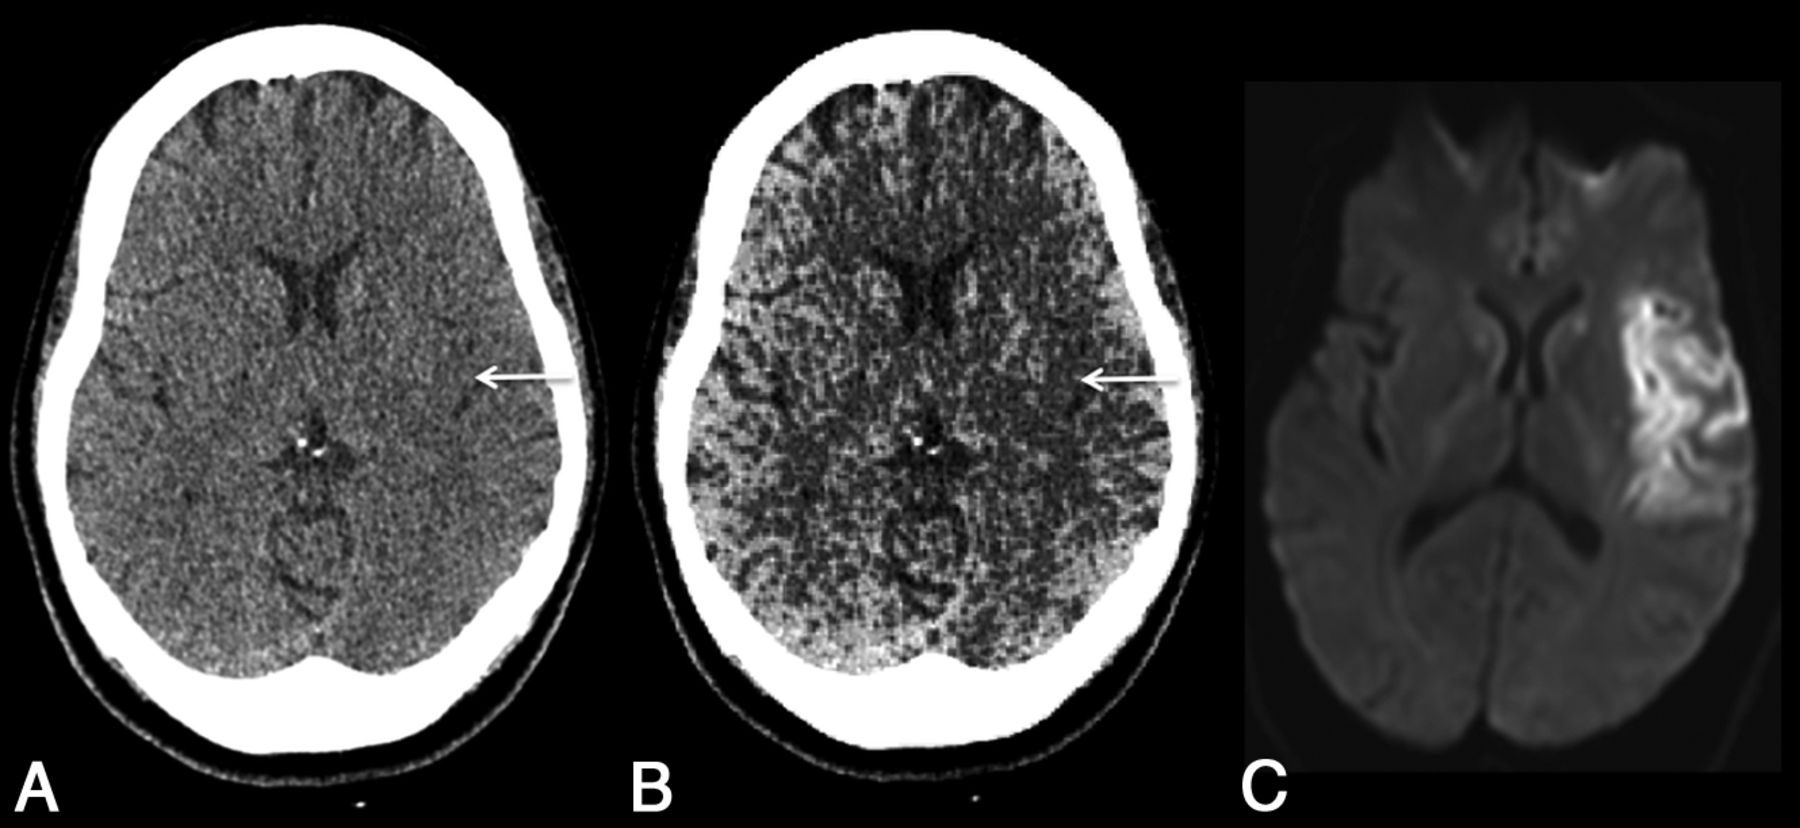
Axial head CT image across the insula obtained within 3 hours of stroke onset before (A) and after (B) processing with CIE. Note that improved gray-white differentiation following image processing makes it easier to perceive the loss of normal gray matter density in the insula (arrow), corresponding to the infarction proved on subsequent DWI (C).
In this feasibility study, the readers were not able to adjust the window or level of the images. It is likely that the ability to optimize window settings would have allowed radiologists to improve the visibility of GWD in baseline images. However, improvement in objective, quantitative measures indicates a favorable effect of CIE beyond what would be achievable by window and level adjustments. Furthermore, enhanced images generated with this image-processing algorithm could also be subject to further optimization using window and level adjustment tools. While the algorithm was applied to only 2 images from each patient's scan, we expect similar results if this algorithm were to be applied to the entire set of images in head CT.
Conclusions
Image processing using an algorithm based on correlative properties of contiguous pixels improved the CNR between normal gray and white matter in head CTs of children. This benefit was also observed for scans obtained using a low radiation dose. Further studies are needed to see whether these results can translate into better detection of disease processes.
Footnotes
Disclosures: Aseem Sharma—UNRELATED: Consultancy: Biomedical Systems, Comments: As a consultant, I serve as an independent reviewer for imaging studies performed for research by third parties; RELATED: The algorithms used in this study were coinvented by me. I have applied for a patent (pending) for these algorithms and founded a company (Correlative Enhancement LLC) with the aim of future commercialization of the IP. I am the sole proprietor of the company, and since the inception of the company until now (including the time during which I processed the images for this study), this company has not received funding from any external source. While I used the algorithms to process the images for this study, I did not participate in image review, image analysis, or the subsequent statistical analysis.
References
- Received June 2, 2017.
- Accepted after revision October 30, 2017.
- © 2018 by American Journal of Neuroradiology


