
Abstract
BACKGROUND AND PURPOSE: Measures for spinal cord atrophy have become increasingly important as imaging biomarkers in the assessment of neuroinflammatory diseases, especially in neuromyelitis optica spectrum disorders. The most commonly used method, mean upper cervical cord area, is relatively easy to measure and can be performed on brain MRIs that capture cervical myelon. Measures of spinal cord volume (eg, cervical cord volume or total cord volume) require longer scanning and more complex analysis but are potentially better suited as spinal cord atrophy measures. This study investigated spinal cord atrophy measures in a cohort of healthy subjects and patients with aquaporin-4 antibody seropositive neuromyelitis optica spectrum disorders and evaluated the discriminatory performance of mean upper cervical cord cross-sectional area compared with cervical cord volume and total cord volume.
MATERIALS AND METHODS: Mean upper cervical cord area, cervical cord volume, and total cord volume were measured using 3T MRIs from healthy subjects (n = 19) and patients with neuromyelitis optica spectrum disorders (n = 30). Group comparison and receiver operating characteristic analyses between healthy controls and patients with neuromyelitis optica spectrum disorders were performed.
RESULTS: Mean upper cervical cord area, cervical cord volume, and total cord volume measures showed similar and highly significant group differences between healthy control subjects and patients with neuromyelitis optica spectrum disorders (P < .01 for all). All 3 measures showed similar receiver operating characteristic–area under the curve values (mean upper cervical cord area = 0.70, cervical cord volume = 0.75, total cord volume = 0.77) with no significant difference between them. No associations among mean upper cervical cord cross-sectional area, cervical cord volume, or total cord volume with disability measures were found.
CONCLUSIONS: All 3 measures showed similar discriminatory power between healthy control and neuromyelitis optica spectrum disorders groups. Mean upper cervical cord area is easier to obtain compared with cervical cord volume and total cord volume and can be regarded as an efficient representative measure of spinal cord atrophy in the neuromyelitis optica spectrum disorders context.
ABBREVIATIONS:
- AQP4-Ab+
- aquaporin-4 antibody seropositive
- CCV
- cervical cord volume
- EDSS
- Expanded Disability Status Scale
- MUCCA
- mean upper cervical cord area
- NMOSD
- neuromyelitis optica spectrum disorders
- SCA
- spinal cord atrophy
- TCV
- total cord volume
Several imaging biomarkers have been established in treatment trials for neuroinflammatory diseases. The most prominent example is T2 lesion count and/or volume in multiple sclerosis.1 In neuromyelitis optica spectrum disorders (NMOSD), no such imaging biomarkers have been established yet. In most patients with NMOSD, standard brain MR imaging shows only nonspecific lesions.2,3 However NMOSD has a predilection for affecting the optic nerves and spinal cord.4⇓–6
Spinal cord atrophy (SCA) can appear after longitudinally extensive transverse myelitis7⇓–9 and has therefore been suggested as an imaging biomarker for disease severity and treatment response in NMOSD. Previous studies have demonstrated that SCA can be associated with longer disease duration and more severe disability and can potentially indicate poor prognosis in NMOSD.10,11
The SCA measurement most commonly used is the mean upper cervical cord area (MUCCA). It is measured as the cross-sectional area of the spinal cord at the level between the C2 and C3 vertebrae.12⇓⇓–15 Although longitudinally extensive transverse myelitis predominantly affects the cervical and upper thoracic spinal cord, the lower thoracic and lumbar cord in patients with NMOSD is often affected as well.16,17 Hence, the main disadvantage of MUCCA is that though it can be easily obtained and measured, it covers only a very small fraction of the spinal cord. Therefore, quantification of the total cord volume (TCV) is theoretically beneficial for a more precise assessment of SCA.
The main disadvantage of assessing TCV is that it requires extra scan time and a more complex and time-consuming analysis procedure. As a compromise between MUCCA and TCV quantification, cervical cord volume (CCV) could be measured.
In theory, TCV should best discriminate between patients with NMOSD and healthy control subjects and should also show a stronger association with clinical measures of disability. Our hypothesis was that TCV best reflects full SCA. Our study compares the discriminatory power of MUCCA, CCV, and TCV between patients with NMOSD and a healthy control group and investigates associations of MUCCA, CCV, and TCV with clinical disability measures.
Materials and Methods
Patients and Subjects
Clinical, demographic, and MR imaging data from 30 patients with NMOSD and 19 healthy control subjects were included (Table 1) in this study. These data were acquired from an ongoing longitudinal prospective observational cohort study, which was approved by the local ethics committee.
Demographics and clinical characteristics
All patients and subjects provided written informed consent. The study was conducted in accordance with the Declaration of Helsinki in its current applicable version and applicable country-specific laws.
All patients had a definite diagnosis of NMOSD according to current panel criteria7 and were aquaporin-4 antibody seropositive (AQP4-Ab+).18 We limited the patient cohort to those with AQP4-Ab+ NMOSD only, to ensure a homogeneous patient cohort with a comparable mechanism of spinal cord damage. All patients with AQP4-Ab+ NMOSD except for 2 (93%) had an attack history of myelitis. Clinical assessments consisted of the Expanded Disability Status Scale (EDSS), averaged timed 25-foot walk test time, and the averaged 9-hole peg test time.
MR Imaging Acquisition
All MR imaging scans were performed on a 3T (Magnetom Trio Tim; Siemens, Erlangen, Germany) scanner. The MR imaging protocol for this study included the following: 1) a T1-weighted 3D magnetization prepared rapid acquisition of gradient echo brain MR imaging (1 × 1 × 1 mm3 resolution, TR = 1900 ms, TE = 3.03 ms, in-plane resolution = 1 × 1 mm) including the upper cervical cord, and 2) sagittally oriented 2D T2-weighted sequences (slice thickness = 2 mm, gap size = 0.2 mm, TR = 3500 ms, TE = 101 ms, in-plane resolution = 1.2 × 0.9 mm) at the cervical, thoracic, and lumbar levels.
Spinal Cord Analysis
All spinal cord measurements were performed with Jim software (Version 7.0; http://www.xinapse.com/home.php). Jim software applies a semiautomatic active surface model, which is based on spinal cord surface parametrization, yielding reproducible measurements of cord cross-sectional areas. This method is also applicable in full spinal cord segmentation of 2D multislice T2-weighted MRI, giving volume measurements of specified spinal cord regions such as the cervical cord or full spinal cord.19 Because this method has been validated for area and volumetric measurements in both research and clinical settings, we chose the Jim software for this study.20⇓–22
Mean Upper Cervical Cord Area
MUCCA was measured in 3D MPRAGE images by averaging the cross-sectional areas from 5 consecutive slices. Following standard convention, the C2–C3 intervertebral space was used as a horizontal reference level for the middle slice.12
Cervical Cord Volume
CCV was measured in a cervical spinal cord 2D T2-weighted sagittal MR imaging sequence. Images were reoriented to the axial orientation and interpolated with multiplanar reconstruction. The centerline of the cord was manually marked at 4 levels along the spinal cord from the tip of the dens to the rostral border of the T1 vertebral body. Subsequent automatic volumetric analysis of the cervical spinal cord was measured with the active surface model as implemented in Jim 7.0 software.
Total Cord Volume
TCV was measured using spinal cord sagittal 2D T2-weighted MR imaging sequences at 3 different levels: cervical, thoracic, and lumbar. All preprocessing by reorientation, multiplanar reconstruction, and centerline indication was the same as with the CCV. Therefore, the volumetric analysis of the full spinal cord required segmentation into 3 parts: 1) the cervical cord from the tip of the dens to the rostral border of the T1 vertebral body, 2) the thoracic cord from the rostral border of the T1 vertebral body to the T11 vertebral body rostral border, and 3) the lumbar cord from the T11 vertebral body rostral border to the conus tip. The TCV was calculated by adding all segmented volumes together.
Figure 1 shows a sample segmentation performed with the active surface model for MUCCA, CCV, and the thoracic and lumbar cords.

Sample segmentation of MUCCA (A), CCV (B), the thoracic spinal cord (C), and the lumbar spinal cord (D). TCV is calculated from the sum of B, C, and D.
Statistical Analysis
Proportional group differences in sex were tested with a χ2 test. For group comparison of continuous measurements (age, MUCCA, CCV, TCV), a Welch 2-sampled t test was used.
Association analysis of MUCCA, CCV, and TCV with each other and with clinical performance measures (averaged timed 25-foot walk and dominant and nondominant hand 9-hole peg test times) was performed with the Pearson correlation test and for EDSS with the Spearman rank correlation test. Further group discriminatory performance was evaluated with receiver operating characteristic analysis including area under the curve comparison using the DeLong method.23
All statistical analyses and plots were produced using R software (http://www.r-project.org/)24 with the tidyverse,25 ggpubr,26 and pROC packages.27
Results
Demographics
Table 1 shows the demographic data of the study cohort. No significant differences were found between groups in sex or age.
Group Comparison and Receiver Operating Characteristic Analysis
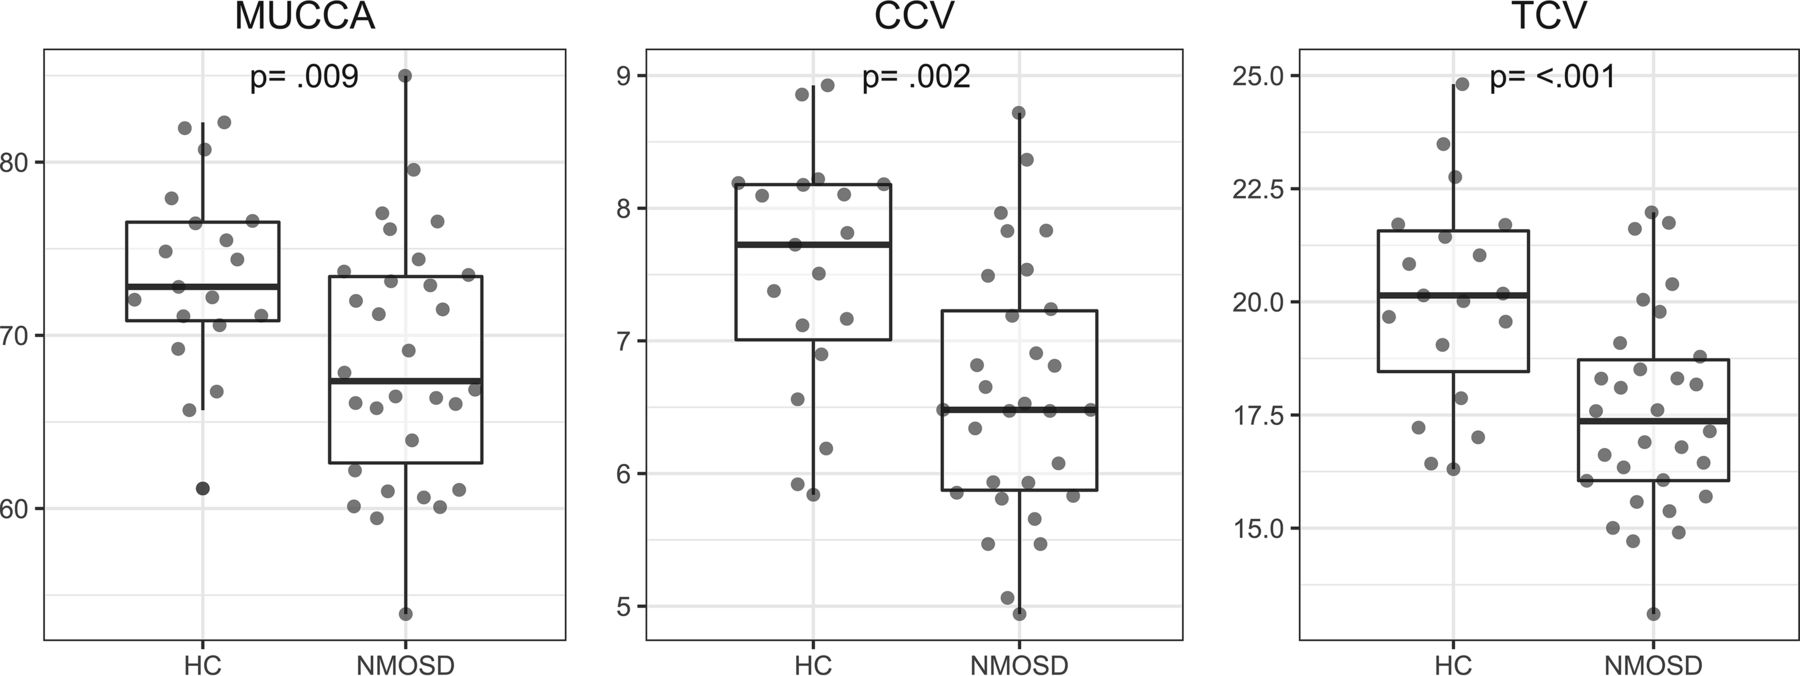
Table 2 and Figs 2 and 3 summarize the group comparison analysis and spinal cord association analyses between patients with NMOSD and healthy controls for MUCCA, CCV, and TCV. All 3 measures show a clear and significant difference between each group and significant associations with each other.
Spinal cord measurements

Group differences between healthy control (HC) subjects and patients with NMOSD for MUCCA in square millimeters, CCV and TCV, in milliliters.

Pearson correlation tests of each spinal cord measure for healthy controls and patients with NMOSD combined. MUCCA is shown in square millimeters; CCV and TCV, in milliliters.
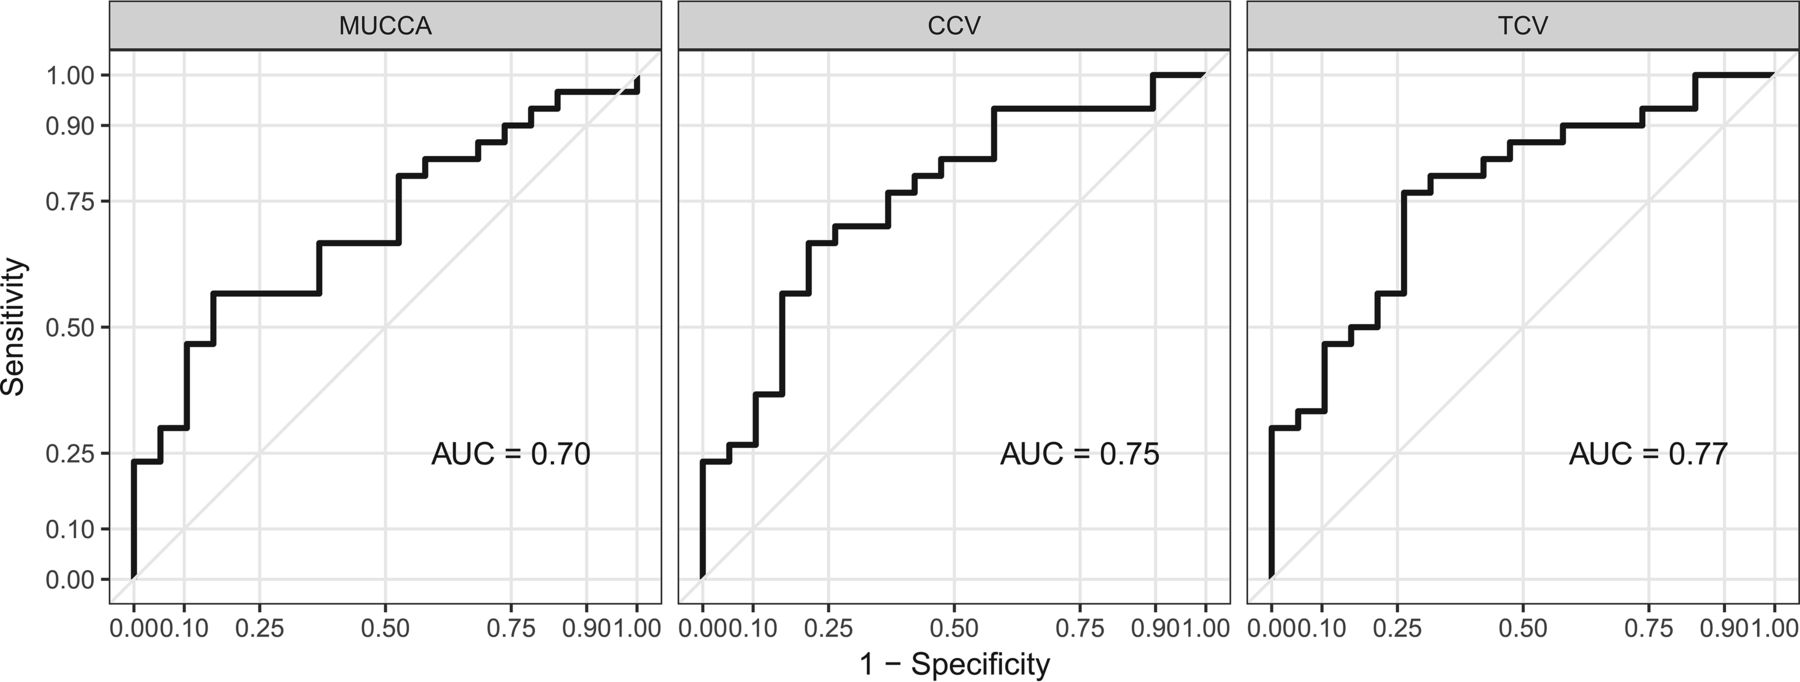
Differentiation between healthy control and NMOSD group spinal cord measures are evident, as shown in Fig 2. MUCCA, CCV, and TCV have comparable area under the curve values in the receiver operating characteristic analysis, as shown in Fig 4. Area under the curve values were tested for a statistically significance difference using the DeLong method,23 yielding no increased performance of any spinal cord measure over the other.

Receiver operating characteristic analysis for MUCCA, CCV, and TCV indicates good sensitivity (true-positive fraction) and specificity (false-positive fraction) for spinal cord atrophy measures in NMOSD. AUC indicates area under the curve.
Associations with Clinical Disability
Associations of MUCCA, CCV, and TCV with the EDSS and the pyramidal functional system score of the EDSS28 all showed nonsignificant associations (Fig 5 and Table 3). No spinal cord measures showed significant associations with the averaged timed 25-foot walk or 9-hole peg tests (Table 3).

Associations of each spinal cord measure with the Expanded Disability Status Scale score. The x-axis shows measurements for MUCCA in square millimeters, CCV and TCV, in milliliters.
Associations of spinal cord measurements with clinical disability
Discussion
This study investigated 3 different MR imaging–based SCA measures for discriminatory performance in a cohort of patients with NMOSD and healthy control subjects. We demonstrated that all 3 types of quantification could significantly differentiate these 2 groups. In a receiver operating characteristic analysis, all measures showed similar area under the curve values in the range of 0.70–0.77, in which TCV had the highest value on a descriptive level. In a statistical comparison, these values were not significantly different. MUCCA, CCV, and TCV did not correlate with clinical disability, as measured by the EDSS, the pyramidal functional system score, and the averaged timed 25-foot walk and 9-hole peg tests.
The observed significant difference in MUCCA between groups is in line with results from other studies.29,30
The area under the curve values obtained from receiver operating characteristic analysis for these 3 measures indicate that MUCCA, CCV, and TCV are not sufficiently sensitive or specific to be deemed clinically relevant diagnostic biomarkers in NMOSD.31 We believe that measuring MUCCA longitudinally could still indicate whether SCA or cord damage occurred.32
The similar performance of MUCCA compared with CCV and TCV could be because the cervical and upper thoracic cord levels are most commonly affected in patients with NMOSD.20,33 Also, all fibers of the thoracic and lumbar spinal cord eventually converge, passing through the cervical cord. Hence, the cervical portion will reflect the overall damage even from lower segments.
Our results showed no clinical associations with the spinal cord measures we investigated. The literature on the associations of clinical disability with spinal cord measures is mixed for NMOSD.
Two studies from the same group found very strong associations of MUCCA with clinical measures in MS and NMOSD.29,34 One other spinal cord study in NMOSD observed some non-lesion-related damage and demonstrated a significant correlation of MUCCA with the patient-determined disease steps, but did not report any statistical tests with EDSS.30
This discrepancy with our results could be due to ethnic, demographic, or cohort-selection differences. Another reason for this finding could be that the EDSS was developed for multiple sclerosis and might not be an ideal instrument reflecting NMOSD disease severity.35
We chose not to apply normalization to all spinal cord measures because no consensus has been reached on how to normalize SCA measures.36⇓⇓–39 Performing spinal cord measurements using different types of MR imaging sequences may require different normalization methods, which we did not investigate in this study.
Measurement of MUCCA, CCV, and TCV could be influenced by inflammation of the spinal cord, yielding larger values than the true cross-sectional areas. None of the patients in our cohort were imaged during an acute myelitis phase. Thus, no patient MRIs exhibited edema in any part of the myelon, which may have affected the spinal cord measurements.
Some limitations apply to our study. The study was performed in a relatively small sample of patients with AQP4-Ab+ only. We conducted this study in NMOSD because we expected a relatively strong difference in SCA measures compared with a healthy control group. We have limited this study cohort to patients with AQP4-Ab disease only to keep the patient cohort homogeneous, so damage mechanisms should be similar. Where the addition of patients with AQP4-Ab seronegativity would include patients with myelin oligodendrocyte glycoprotein antibody seropositivity, likely with different damage in the spinal cord.40,41 The main purpose of our study was to compare 3 possible measures of SCA and investigate whether the additional effort of full spinal cord analysis performs better than a simple MUCCA approach. Thus, we did not evaluate spinal cord lesion load or location in this study.
We are aware that sagittally oriented MR images are not ideal for detailed analysis of the spinal cord. Full spinal cord MR imaging is usually acquired in a sagittal orientation because larger portions of the spinal cord can be imaged compared with an axial orientation. Axially acquired spinal cord images would have been advantageous due to fewer partial volume effects. When one looks at the axial slices in Fig 1, it becomes clear that image resolution in the 2D axial plane is coarse. However, the active surface model used by the Jim software smooths out voxels and interpolates the slice spacing. It does not remove the spacing; rather, it fills in the gaps using an average from the signal coming from the contributing slices on either side. Thus, we believe the discrepancy between 3D and 2D images is minimized and the partial volume errors are decreased by this method.19 Moreover, the acquisition of axial images over the full spinal cord would have required excessively long scan times, and our results would not be comparable with the standard clinical setting.42
There has been sparse research into MR imaging biomarkers for patients with NMOSD. Those who have investigated deep gray matter and white matter tracts have shown little discernable difference between patients with AQP4-Ab+ NMOSD and healthy controls.43,44 Thus, the decrease in spinal cord measures found in this study and others shows that SCA could be a suitable imaging biomarker in these patients.
Emerging quantitative MR imaging methods of white and gray matter segmentation in the spinal cord are now becoming clinically available.8,20,39,45 Further studies will be required to show whether these new measures can better characterize SCA in the NMOSD context.
Conclusions
MUCCA shows similar performance for SCA evaluation in comparison with CCV and TCV. The hypothetical benefit of a more complete volumetric measurement could not be confirmed in our study. Therefore, in our opinion, MUCCA is an efficient and representative surrogate parameter for SCA analysis, at least in the context of patients with AQP4-Ab+ NMOSD.
MUCCA has 2 advantages: 1) being relatively easy to acquire, without the need for a dedicated spine sequence because 3D T1-weighted cerebral images can be used for MUCCA measurement; and 2) the measurement is relatively simple and quick to perform. The pathogenesis of SCA in NMOSD is still poorly understood, and the disease is difficult to study due to its rarity. It is, thus, of great advantage to have an efficient and easy-to-standardize method in future longitudinal studies. Our study demonstrates that MUCCA measurements are a good representative marker of whole spinal cord SCA in patients with NMOSD.
Acknowledgments
We thank all the patients and healthy control subjects for their participation. We would also like to acknowledge our MR imaging technicians, Cynthia Kraut and Susan Pikol, for their assistance in this research.
Footnotes
F. Paul and M. Scheel were equally contributing senior authors.
Disclosures: A.U. Brandt—UNRELATED: Board Membership: Motognosis; Consultancy: Biogen, Comments: Vision Study; Payment for Lectures Including Service on Speakers Bureaus: Teva Pharmaceutical Industries; Patents (Planned, Pending, or Issued), Comments: ocular coherence tomography analysis, perceptive computing, MS biomarkers; Stock/Stock Options: Motognosis. J. Bellmann-Strobl—UNRELATED: Payment for Lectures Including Service on Speakers Bureaus, Comments: payment for lectures on fatigue in 2016 and pregnancy and MS in 2017; Travel/Accommodations/Meeting Expenses Unrelated to Activities Listed, Comments: travel grants in 2015, 2016, and 2017. Klemens Ruprecht—RELATED: Grant: KKNMS (Competence Network Multiple Sclerosis) Bundesministerium für Bildung und Forschung, Comments: research grant; UNRELATED: Grants/Grants Pending: Novartis Pharmaceuticals, Merck Serono, Comments: research grants. Friedemann Paul—UNRELATED: Board Membership: Guthy Jackson Charitable Foundation–International Clinical Consortium.* *Money paid to the institution.
The data collection and analyses for this study were funded by the Deutsche Forschungsgemeinschaft, German Research Foundation (grant No. Exc 257).
Indicates open access to non-subscribers at www.ajnr.org
References
- Received December 3, 2017.
- Accepted after revision March 13, 2018.
- © 2018 by American Journal of Neuroradiology


