
Abstract
BACKGROUND AND PURPOSE: Vessel wall imaging can identify intracranial atherosclerotic plaque and give clues about its components. We aimed to investigate whether the plaque hyperintensity in the middle cerebral artery on T2-weighted vessel wall imaging is associated with ischemic stroke.
MATERIALS AND METHODS: We retrospectively reviewed our institutional vessel wall MR imaging data base. Patients with an acute ischemic stroke within 7-day onset in the MCA territory were enrolled. Patients with stroke and stenotic MCA plaque (stenosis degree, ≥50%) were included for analysis. Ipsilateral MCA plaque was defined as symptomatic, and contralateral plaque, as asymptomatic. Plaque was manually delineated on T2-weighted vessel wall imaging. The plaque signal was normalized to the ipsilateral muscle signal. The thresholds and volume of normalized plaque signal were investigated using logistic regression and receiver operating characteristic analysis to determine the association between normalized plaque signal and stroke.
RESULTS: One hundred eight stenotic MCAs were analyzed (from 88 patients, 66 men; mean age, 58 ± 15 years), including 72 symptomatic and 36 asymptomatic MCA plaques. Symptomatic MCA plaque showed larger plaque hyperintensity volume compared with asymptomatic MCA plaque. The logistic regression model incorporating stenosis degree, remodeling ratio, and normalized plaque signal 1.3–1.4 (OR, 6.25; 95% CI, 1.90–20.57) had a higher area under curve in differentiating symptomatic/asymptomatic MCA plaque, compared with a model with only stenosis degree and remodeling ratio (area under curve, 0.884 versus 0.806; P =.008).
CONCLUSIONS: The MCA plaque hyperintensity on T2-weighted vessel wall imaging is independently associated with ischemic stroke and adds value to symptomatic MCA plaque classification. Measuring the normalized signal intensity may serve as a practical and integrative approach to the analysis of intracranial atherosclerotic plaque.
ABBREVIATIONS:
- AUC
- area under curve
- NPS
- normalized plaque signal
- MCA
- middle cerebral artery
Intracranial atherosclerotic disease is a common cause of ischemic stroke, especially in Asian populations.1,2 Atherosclerotic plaque rupture is one of the major mechanisms leading to ischemic events.3 Plaque components such as a thin fibrous cap, a large lipid core, the presence of neoangiogenesis, intraplaque hemorrhage, and juxtaluminal thrombus are associated with an elevated risk of plaque rupture in extracranial artery atherosclerosis.3,4 However, the association between intracranial plaque components and the risk of ischemic stroke has not been well-studied.
Recently, the development of vessel wall imaging has provided a repeatable and reliable tool for observing intracranial plaque in vivo,5 which is demonstrated as an eccentric arterial wall thickening.6 Although noncontrast and postcontrast T1-weighted vessel wall MR imaging has been used to study intracranial atherosclerotic disease,7,8 the clinical utility of T2-weighted vessel wall imaging has not been well-established. Thin fibrous cap,6,9 intraplaque hemorrhage, and juxtaluminal thrombus were associated with hyperintensity of atherosclerotic plaque on T2-weighted imaging,4,10 while calcification11,12 and hemosiderin were associated with hypointensity on T2-weighted imaging. The purpose of the study was to investigate whether symptomatic middle cerebral artery (MCA) plaque is associated with a characteristic signal distribution on T2-weighted imaging.
MATERIALS AND METHODS
Patients
We retrospectively reviewed our vessel wall MR imaging data base starting from January 2007 to December 2016. Patients with acute stroke (within 7-day onset) in the MCA territory with confirmed infarct lesions on DWI were included in this study. Patients were excluded if they had evidence of the following: 1) cardioembolism, such as a history of atrial fibrillation or recent myocardial infarction within 1 month, atrial fibrillation identified by electrocardiography or Holter monitor, or left atrial/ventricular thrombus identified by echocardiography; 2) extracranial atherosclerosis with stenosis degree of >50%; and 3) nonatherosclerotic vasculopathy such as Moyamoya disease, vasculitis, and arterial dissection. Symptomatic MCA plaque was defined as MCA plaque ipsilateral to the infarct lesions with stenosis degree exceeding 50%, measured on vessel wall MR imaging (see Imaging Analysis). Asymptomatic MCA plaque was defined as present if the MCA was contralateral to the infarct lesions with stenosis exceeding 50% and no history of ischemic stroke or transient ischemic attack in that territory. Occluded MCAs and motion- or artifact-degraded studies were excluded. The study protocol was approved by the ethics committee of the Peking Union Medical College Hospital. All patients or their families gave written consent before participation.
Imaging Protocol
MR imaging was performed on 3T systems (Signa VH/I; GE Healthcare, Milwaukee, Wisconsin) from January 2007 to June 2013 and Discovery MR750 (GE Healthcare) from June 2013 to November 2016, equipped with an 8-channel head coil. The protocol included conventional 3D TOF-MRA, DWI, and a fat-suppressed (June 2013 to November 2016) or non-fat-suppressed (January 2007 to June 2013) sequence of the MCA. Vessel wall imaging was performed perpendicular to the MCA M1 segment after TOF-MRA. A non-fat-suppressed T2-weighted fast spin-echo sequence was obtained using the following parameters: TR/TE, 3200/45 ms; FOV, 13 × 13 cm; matrix size, 256 × 256; section thickness, 2 mm; 4 signal averages; pixel band width, 97.6. The total scan time was 3 minutes 20 seconds. A fat-suppressed T2-weighted fast spin-echo sequence was performed with the following parameters: TR/TE, 4200/60 ms; FOV, 13 × 13 cm; matrix size, 256 × 256; section thickness, 2 mm; 4 signal averages; pixel band width, 162.7. Total scan time was 3 minutes 20 seconds, and total study protocol time was approximately 10 minutes. The parameters of the other imaging series were described in our previous studies.7,13
Imaging Analysis
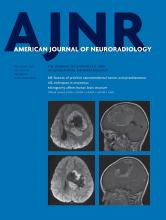
Image quality was graded as poor if the MCA lumen was poorly visible with moderate-to-substantial blurring or artifacts and good if the MCA lumen was clearly identified with minimal or no blurring or artifacts.14 Only patients with good image quality were included in the analysis (Fig 1).

Example of plaque from 4 patients with symptomatic MCA plaque (A and C) and asymptomatic MCA plaque (B and D) and a histogram of 2 individual plaques (E). A and B, Scanned with a non-fat-suppressed T2 sequence. C and D, Scanned with a fat-suppressed T2 sequence. A and B, Plaque has a similar total volume but different signal features. E, Orange bars represents the signal distribution of A, which has more hyperintense signals seen as larger volume within high normalized plaque signal; blue bars represent the signal distribution of B, which has fewer hyperintense signals seen as larger volume within low normalized plaque signal. The plaque area (red dotted contour lines), vessel outer wall area (blue contour lines), and luminal area (yellow contour lines) are manually delineated on every cross-section containing plaque. Facial muscle signals are sampled by the pink box. The muscle signal of D was sampled in adjacent slices. Note the consistent image quality.
Atherosclerotic plaque was defined as eccentric vessel wall thickening in which the thickest wall was twice the size of the thinnest wall by visual inspection15 on T2-weighted images. The region of plaque in an MCA M1 segment was manually delineated along all involved cross-sectional images using ROI tools in Osirix MD (https://download.cnet.com/OsiriX-MD/3000-2054_4-75705449.html) by a neurologist with 5-years' experience (Y.-N.Y.) blinded to all clinical information (Fig 1). For evaluation of interobserver and intraobserver agreement of area and volume, J.P.V. (with 10-years' experience) and Y.-N.Y., respectively, repeated the identification of the target ROIs and confirmed the plaque contours of each ROI in 18 randomly selected MCA segments. Consensus interpretations were used in case of disagreements. The interobserver and intraobserver agreement of luminal area and outer wall area measurements was also performed using the intraclass correlation coefficient.
To convert MR imaging signals to a comparable value among subjects, we used muscle signal as the reference to normalize the plaque signal.7 Instead of using 1 summarized value such as mean, we used a histogram that contains the normalized plaque signal (NPS) of each pixel within the ROIs to represent the detailed signal distribution of MCA plaque. The plaque hyperintensity was quantitatively evaluated as the volume of tissue within a certain NPS threshold. The NPS was defined as the ratio of the signal of each pixel in MCA plaque to the mean muscle signal. The mean muscle signal is calculated from the reference ROI delineated in the masseter or buccinator muscle in the same section containing the plaque or the section adjacent to the plaque (Fig 1). We chose those large facial muscles because larger ROIs can obtain an unbiased mean value of the muscle signal and the signal is not affected by any intracranial lesions. An automated tool programmed using Python (Version 2.7; https://www.python.org/download/releases/2.7/) extracted the pixels inside the plaque and calculated NPS according to the manually delineated ROIs.
Stenosis degree and remodeling ratio have both been reported to be important characteristics of symptomatic plaque.16 Therefore, they were also measured in this study to adjust the logistic regression models. The luminal and outer wall areas were manually measured on the maximal lumen narrowing section of the M1 segment. Reference slices were defined as the plaque-free section that was proximal and distal to the maximal narrowing section (the averaged area was calculated); when plaque involved the entire M1 segment, the plaque-free counterpart of the contralateral artery was used as the reference section:17 Stenosis Degree = 100% × (1 – Luminal Area at the Maximal Lumen Narrowing Site/Reference Luminal Area); Remodeling Ratio = Outer Wall Area at the Maximal Lumen Narrowing Site/Reference Outer Wall Area.17,18
Statistical Analysis
Statistical analysis was performed using STATA 14.0 (StataCorp, College Station, Texas) and R 3.4.0 statistical and computing software (http://www.r-project.org). Patients with and without fat-suppression imaging were analyzed separately. According to the data distribution shown in Fig 2, thresholds of the NPS were investigated with an increment of 0.1. Receiver operating characteristic analysis and logistic regression analysis were used to determine the diagnostic value of plaque hyperintensity (the volume of a given NPS threshold) associated with symptomatic MCA plaque after being adjusted for stenosis degree and remodeling ratio and whether fat suppressed imaging was used for analysis. The optimal NPS thresholds for patients with and without fat-suppression were then determined by selecting the largest average area under curve (AUC). Patients with bilateral MCAs included in this study were studied as a subgroup using paired-samples Wilcoxon test analysis to test whether the plaque hyperintensity was associated with symptomatic MCA plaque within a single individual. P < .01 was considered statistically significant after adjustment by the Benjamini-Hochberg method. All the statistical tests were 2-sided.

The summary of the median volume of normalized plaque signal in non-fat-suppressed and fat-suppressed T2 imaging. A, The median volume of symptomatic and asymptomatic MCA plaque in patients with non-fat-suppressed T2-weighted imaging. The difference between the 2 groups becomes more significant when normalized plaque signal is high. B, The median volume of symptomatic and asymptomatic MCA plaque in patients with fat-suppressed T2-weighted imaging. The difference between the 2 groups also becomes more significant when normalized plaque signal is high.
RESULTS
In total, 150 patients were enrolled. Of their 300 MCAs, 192 MCAs were excluded due to occlusion (n = 17), poor image quality or unavailability of vessel wall MR imaging (n = 33), and stenosis degree of <50% (n = 142), leaving a total of 72 symptomatic MCA plaques and 36 asymptomatic MCA plaques from 88 patients for analysis (20 patients had bilateral MCA plaques but only unilateral stroke). Thirty-five MCAs from 30 patients had fat-suppressed T2-weighted vessel wall imaging, and 73 MCAs from 58 patients underwent non-fat-suppressed T2-weighted vessel wall imaging. Of the 88 patients, 66 (75.0%) were men, and the mean age was 58 ± 15 years. Fifty-five patients (65%) had a history of hypertension, 22 (26%) had diabetes mellitus, 36 (43%) had dyslipidemia, and 9 (11%) had coronary artery disease.
Intraobserver agreement for plaque ROI analysis was 94%. The 6% discordance was for slices that were at the very edge (the beginning or ending) of a plaque and contained plaque that was thin and not T2-weighted hyperintense. In the 94% of concordant slices, agreement of visual plaque spatial location and contour reached 100%. The intraclass correlation coefficient for ROI volume reached 0.965 (95% CI, 0.905–0.987). For interobserver agreement, 95% of slices of the first reading were confirmed as containing plaque by a second reader, with agreement of plaque spatial location and contour reaching 100%. The intra- and interobserver agreement for luminal area measurement was 0.78 (95% CI, 0.54–0.91) and 0.78 (95% CI, 0.53–0.90); for outer wall area measurement, it was 0.92 (95% CI, 0.80–0.97) and 0.84 (95% CI, 0.65–0.93).
The average volume of symptomatic MCA plaque was 26.1 ± 16.0 mm3, and 20.0 ± 13.3 mm3 for asymptomatic MCA plaque. There was no statistical difference in plaque hyperintensity between non-fat-suppressed and fat-suppressed T2-weighted imaging.
Symptomatic MCA plaque demonstrated larger hyperintensity areas (volume of high NPS thresholds) than asymptomatic MCA plaque in both fat-suppressed and non-fat-suppressed T2-weighted imaging (Fig 2). For non-fat-suppressed T2-weighted imaging, the volume of areas with NPS 1.3–1.4 and no less than 1.3 had the highest AUCs in differentiating symptomatic and asymptomatic MCA plaque (Table 1). For fat-suppressed T2-weighted imaging, NPS 1.3–1.4 and not less than 1.0 had the highest AUCs (Table 2). The thresholds to differentiate symptomatic and asymptomatic MCA plaque were similar in both imaging sequences.
Volume of NPS threshold, stenosis degree, and remodeling ratio in non-fat-suppressed imaginga
Volume of NPS threshold, stenosis degree, and remodeling ratio in fat-suppressed imaginga
T2-weighted hyperintensity was independently associated with symptomatic MCA plaque, adjusted by stenosis degree and remodeling ratio in non-fat-suppressed imaging (On-line Table 1). Logistic regression was not performed separately within fat-suppressed data due to its small sample size. The NPS thresholds were similar in the separate analysis of fat-suppressed and non-fat-suppressed imaging. There was no interaction of fat-suppressed/non-fat-suppressed imaging on the association of plaque hyperintensity and symptomatic MCA plaque. Therefore, logistic regression models were also performed using the combined dataset. Two logistic regression models incorporating NPS thresholds, stenosis degree, and remodeling ratio with the highest AUCs among all the thresholds and one model incorporating only the stenosis degree and remodeling ratio were compared in Table 3 (see On-line Table 2 and On-line Fig 1 for all tested thresholds). NPS 1.3–1.4 (OR, 6.25 per 1-mm3 increase; 95% CI, 1.90–20.57) was independently associated with symptomatic MCA plaque after adjusting for stenosis degree and remodeling ratio, and it had the highest AUC of 0.884 (95% CI, 0.822–0.945) among all models. NPS no less than 1.2 also demonstrated considerable diagnostic value with a model AUC of 0.863 (95% CI, 0.791–0.935). However, a logistic regression model with only stenosis degree and remodeling ratio yielded the AUC of 0.806 (95% CI, 0.725–0.887), which was lower than that in the best model (P = .008). The optimal cutoff for NPS no less than 1.2 was 3.2 mm3, with a sensitivity of 61% and specificity of 94%.
The logistic regression models of optimal NPS thresholds
In subgroup analysis of 20 patients with bilateral MCA plaque but only unilateral symptoms, the paired-samples Wilcoxon test showed that symptomatic MCA plaque had a larger volume of hyperintensity (NPS = 1.3–1.4) than asymptomatic MCA plaque, 1.7 (interquartile range, 0.4–3.1 mm3) versus 0.3 (interquartile range, 0.0–0.5 mm3) P = .0007; see On-line Fig 2 for the paired plot).
DISCUSSION
It is a critical-but-challenging task to identify the vulnerability of intracranial plaque. Fat-suppressed T1-weighted sequences with and without gadolinium are currently the most commonly used imaging sequences for evaluating intracranial plaque vulnerability. The plaque hyperintensity on the nonenhanced T1-weighted sequence is associated with intraplaque hemorrhage,7,19 while hypointensity is associated with lipid core.8 Gadolinium enhancement within intracranial plaque demonstrated a strong association with ischemic stroke.20 However, the association between ischemic stroke and T2-weighted plaque signal was not well-studied.
The primary finding of this study was that MCA plaque hyperintensity on T2-weighted images with >50% stenosis was associated with symptomatic MCA plaque. We also generated optimal thresholds for identifying the plaque hyperintensity, which could be a reference for future research. The NPS of 1.3–1.4 provided the highest diagnostic value for symptomatic MCA plaque. The NPS of ≥1.2 also provided a clinically practical threshold for evaluating MCA plaque. In addition, the models with NPS performed better than the model with stenosis degree and remodeling ratio only, which are known factors associated with symptomatic plaque.16
There are several components in plaque that may produce a T2 hyperintense signal. These include the fibrous cap, collagen-rich plaque content, and hemorrhage. The fibrous cap of vulnerable plaque and collagen-rich content may demonstrate hyperintensity12,21,22 or sometimes isointensity11 on T2-weighted imaging. Intraplaque hemorrhage and juxtaluminal thrombus are also distinguishing features of vulnerable plaque4,7,10,23 and may appear hyperintense on T2-weighted sequences if the blood products are in the extracellular methemoglobin state. Hyperacute (<12 hours, oxyhemoglobin) and late subacute (1 week to 2 months, extracellular methemoglobin) hemorrhage both demonstrate hyperintensity on T2-weighted imaging. Because the time window for hyperacute hemorrhage is too short to capture, most of the hemorrhage identified as T2-weighted hyperintensity is generally in the late subacute phase. Our previous study found that intraplaque hemorrhage occurs in about 20% of symptomatic MCA stenoses and 3% of asymptomatic MCA stenoses,7 which may contribute to the larger volume of hyperintensity in symptomatic MCA plaque. The variable T2 signal and heterogeneous distribution of specific commonly encountered plaque elements emphasize the challenge of attempting to parse individual plaque elements on a pixel-by-pixel basis and suggest that an integrative signal-intensity-based approach to plaque composition may be clinically useful.
Lipid core is an important element of progressive and vulnerable plaque,5,24 which may influence plaque intensity in T2-weighted images. Although lipid may present as hyperintensity in non-fat-suppressed T2 imaging, the lipid in atherosclerotic plaque mainly consists of liquid cholesteryl esters, which produce hypointensity in non-fat-suppressed T2-weighted images,25⇓–27 while another form of lipid, cholesterol crystals, causes signal voids on T2-weighted images.28 Previous studies were inconsistent in reporting the signal features of lipid in atherosclerotic plaque, partly due to inconsistent imaging sequences across the studies and the plaque heterogeneity.27,29⇓–31 This phenomenon mitigates potential differences between fat-suppressed and non-fat-suppressed T2-weighted imaging and justifies our combined modeling approach. A source of spurious T2 hyperintensity may occur with chemical shift artifacts. However, this was not observed in our image datasets.
The intraplaque T2 hyperintensity we observed may reflect primarily the overall load of intraplaque hemorrhage and juxtaluminal thrombus. These components have been associated with plaque vulnerability.4,7 The optimal cutoff points of NPS in our study had a relatively low sensitivity (61%) but a high specificity (94%). Possible false-negative cases could have been caused by the following: 1) plaque component heterogeneity, in which the T2 signal may have been averaged or washed out if various plaque components existed in a microdistribution rather than as pure pools of specific components; and 2) intraplaque hemorrhage and lipid cores that are isointense or hypointense on T2-weighted imaging.
Nevertheless, our results suggest that by using signal intensity–based thresholding on T2-weighted vessel wall imaging in conjunction with stenosis degree and remodeling ratio, one may be able to classify symptomatic MCA plaque with a high level of specificity. That the results obtained from the subgroup of 20 patients with bilateral MCA plaque but unilateral symptoms were comparable with the conclusions derived from the entire dataset suggests that bilateral disease also comports to our identified NPS thresholds.
Symptomatic intracranial atherosclerotic stenosis has a higher risk for stroke recurrence compared with asymptomatic stenosis.32,33 It is particularly challenging but important in clinical practice to predict the prognosis of an intracranial atherosclerotic disease lesion before symptoms occur. An increasing number of high-risk patients are incidentally discovered to have intracranial artery stenosis before an ischemic stroke or transient ischemic attack occurs, enabling researchers to study those lesions. Previous work suggested that stenosis degree,34 remodeling ratio,16,34 plaque size,16,18,35 plaque surface irregularity,34 MCA geometric features,18 and hyperintensity on noncontrast or postcontrast T1-weighted sequences are indicators of vulnerable plaque.6,7,20,36 Our results suggest that plaque hyperintensity on T2-weighted sequences, in addition to the stenosis degree and remodeling ratio, improves the classification of symptomatic MCA plaque. Further studies with larger sample sizes are required to validate our results and to determine whether intraplaque T2 hyperintensity is a marker comparable with other more commonly used plaque features such as T1-weighted hyperintensity and postcontrast enhancement.
Our study has several limitations. This was a retrospective study, and our conclusions establish associations and not a causal or predictive relationship. The study had a small sample size, and the case number with fat-suppressed imaging was limited, reducing the power of our conclusions. Although we did not use a 3D black-blood sequence and the sensitivity to detect small plaque is therefore limited, the 2D fast spin-echo sequence has blood signal suppressed and can identify most plaque clearly. We did not have patients who underwent both fat-suppressed and non-fat-suppressed imaging at the same time, limiting our ability to determine the signal change due to the fat suppression. However, this limitation is mitigated by the fact that lipid is mostly T2-weighted hypointense even in non-fat-suppressed imaging, and we found no difference between the 2 sequences. It may be interesting to further investigate whether fat-suppressed imaging adds any value in differentiating symptomatic and asymptomatic plaque. Because no histopathologic analysis was performed, we are unable to determine what proportion of our T2 signal was due to specific plaque components. Multicontrast MRIs such as susceptibility-weighted imaging37 and T1-weighted imaging7,8 may help differentiate the plaque components. However, this was not our objective, and we note that our integrative method simplifies the analysis of plaque vulnerability. In the future, we propose to use a multiple-parametric approach, including T1-weighted imaging in a similar patient population in an effort to increase the sensitivity of our approach while maintaining specificity. Finally, the results may not be generalizable to asymptomatic patients because only patients with acute stroke were analyzed in this study. It could be meaningful to design a prospective study including both symptomatic and asymptomatic patients to facilitate this comparison.
CONCLUSIONS
Plaque hyperintensity on fat-suppressed and non-fat-suppressed T2-weighted vessel wall imaging may be a potential imaging marker for identifying symptomatic MCA plaque. The plaque hyperintensity added diagnostic value to the symptomatic MCA plaque classification compared with a model that contains only stenosis degree and remodeling ratio. Therefore, the T2 plaque hyperintensity and its thresholds could provide a clinically practical evaluation method for MCA plaque.
Acknowledgment
We appreciate the statistical consultation provided by Nicholas J. Jackson, PhD, MPH, Department of Medicine Statistics Core, University of California, Los Angeles.
Footnotes
This work was supported by the Ministry of Science and Technology of the People's Republic of China (2017YFC1307900 and 2017YFC1307902), the National Natural Science Foundation of China (81471207 and 81671370), and the 2016 Peking Union Medical College Hospital science fund for junior faculty.
Disclosures: Yunnan Yu—UNRELATED: Employment: Stanford University, Comments: currently a postdoctoral student at Stanford; submitted work was completed at the University of California, Los Angeles; Travel/Accommodations/Meeting Expenses Unrelated to Activities Listed: travel expense reimbursement from the radiology department at Stanford. Feng Feng—UNRELATED: Board Membership: Journal of Magnetic Resonance Imaging editorial board member, deputy editor stipend; Consultancy: GE Healthcare Medical Advisory Board for MRI 2017; Grants/Grants Pending: National Natural Sciences Foundation*; Payment for Lectures Including Service on Speakers Bureaus: GE Healthcare, Bracco; Travel/Accommodations/Meeting Expenses Unrelated to Activities Listed: Chinese Medical Foundation to attend academic conferences,* David S. Liebeskind—UNRELATED: Consultancy: Cerenovus, Stryker, Medtronic, Comments: Consultant for Imaging Core Lab. Wei-Hai Xu—RELATED: Grant: National Natural Science Foundation of China (81471207 and 81671370)*; UNRELATED: Employment: Peking Union Medical College Hospital; Travel/Accommodations/Meeting Expenses Unrelated to Activities Listed: travel expense reimbursement from the hospital. *Money paid to the institution.
Indicates open access to non-subscribers at www.ajnr.org
References
- Received March 23, 2019.
- Accepted after revision August 27, 2019.
- © 2019 by American Journal of Neuroradiology


Jump to section
Related Articles
Cited By...
- No citing articles found.